ABSA Technical Valuations Session JSE Trading Division - July 2010 Presented by: Dr Antonie Kotzé
←
→
Page content transcription
If your browser does not render page correctly, please read the page content below

ABSA
                Technical Valuations Session
                    JSE Trading Division
                          July 2010

Presented by:
Dr Antonie Kotzé

      ©                                        1
ABSA Technical Valuation Session
                                                Introduction
    Some members are lost…..

©                                                              2
ABSA Technical Valuation Session
                                                  Introduction

    … some think Safex talks in “tongues”….

©                                                                3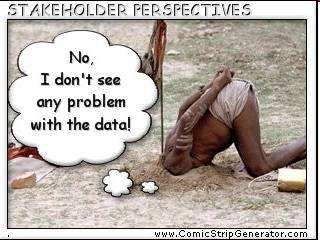
ABSA Technical Valuation Session
                                                              Introduction

    A derivatives market is far more complex than a vanilla market
    This is especially the case if the market is illiquid
    Safex sometimes Mark-to-Model certain instruments and
    sometimes apply a Mark-to-Market methodology
    Safex is continuously engaging with the market to improve fair
    value calculations to get as close as possible to the correct
    market values
    Interestingly, after Safex’s processes and methodologies are
    outlined to market participants, most feel that these values are
    almost as fair as we can reasonably expect them to be.

©                                                                            4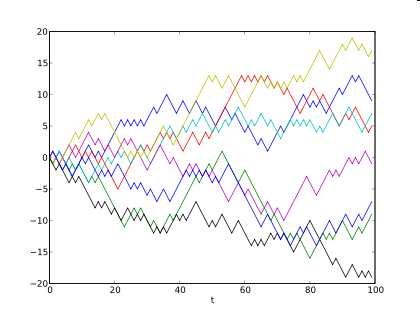
ABSA Technical Valuation Session
                                             Introduction

    How do we deal with technical/mathematical
    problems?

    Safex tries to follow scientific rules and best
    practice when solving problems!

    We work closely with the sell and buy side

©                                                           5
ABSA Technical Valuation Session
IMR: Diffusion of Stock Prices
Background: Around 1900, Louis Bachelier first proposed that financial
markets follow a 'random walk'.
In the simplest terms, a "random walk" is essentially a Brownian
motion: the previous change in the value of a variable is unrelated to
future or past changes. This implies that stock price movements are
totally random.
The assumption is that stock prices diffuse through time like heat
diffuses through a window or wall – scientific theory is sound.
Resistance – can be modeled
mathematically
© 6ABSA Technical Valuation Session
Brownian Motion
• Brownian motion – logarithmic returns are normally distributed
© 7ABSA Technical Valuation Session
Return Distributions
• Does the real world behave like this? We look at DAILY returns
© 8ABSA Technical Valuation Session
Return Distributions
• More SA data
© 9ABSA Technical Valuation Session
Who bears the Risk in a Derivatives Market?
Clearing Houses
SAFCOM bears the credit risk
© 10ABSA Technical Valuation Session
Risk Management
Exchanges employ a system of margining. Accordingly, a counterparty
to a transaction on an exchange is required to pay a sum over to it at
the inception of the derivative transaction to cover any potential losses
arising from a default – initial margin
Risk management may be defined as identifying the risk of loss in a portfolio
and ensuring that the losses can be borne.
A futures contract's Initial Margin Requirement (IMR – also called the FIXED
MARGIN) is equal to the profit or loss arising from the maximum anticipated up
or down move in its price from one day to the next
It is in essence a 1 day Value at Risk (VAR) measure. It is given in Rands per
futures contract.
Should the losses eventuate and the participant be unable to bear them, the
margin is available to the exchange to meet the shortfall.
The current IMRs are found at
http://www.jse.co.za/DownloadFiles.aspx?RequestedNode=DownloadableDocu
ments/Safex/Margin_Requirements/2010
©
This is the current initial margin sheet…. 11ABSA Technical Valuation Session
Risk Management
Margin Requirements as at 13 July 2010 NoteF4366B
Contract Expiry Fixed Spread VSR Series Spread
Code Date Margin Margin Margin
ALMI 16/09/2010 1,700 235 2.00
ALMI 15/12/2010 1,700 240 2.00
ALSI 16/09/2010 17,000 2,350 2.00 9500
ALSI 15/12/2010 17,000 2,400 2.00 9500
ALSI 17/03/2011 17,500 2,400 2.00 9500
ALSI 15/06/2011 17,500 2,450 2.00 9500
ALSI 15/12/2011 18,000 2,500 2.00 9500
ALSI 15/03/2012 18,000 2,500 2.00 9500
ALSI 20/12/2012 19,000 2,650 2.00 9500
ALSI 20/03/2013 19,000 2,700 2.00 9500
ALSI 18/12/2014 21,000 3,000 2.00 9500
BANK 16/09/2010 26000 3,500 3.00
CTOP 16/09/2010 8,400 400 2.00 4250
DIVI 16/09/2010 200 50 4.50
DTOP 16/09/2010 3,600 350 2.00 2000
DTOP 15/12/2010 3,700 350 2.00 2000
DTOP 17/03/2011 3,700 350 2.00 2000
DTOP 15/06/2011 3,700 350 2.00 2000
ETOP 16/09/2010 8,400 400 2.00 4250
ETOP 15/12/2010 8,400 400 2.00 4250
FINI 16/09/2010 6,100 1,900 2.50 1500
FNDI 16/09/2010 16,500 950 2.00 8250
FNDI 15/12/2010 16,500 950 2.00 8250
© 12ABSA Technical Valuation Session
Initial Margin Calculations for Futures
The fixed margin is statistically estimated as follows:
Use 751 daily closing values to obtain 750 daily returns
The risk parameter is set at 3.5 Standard Deviations confidence level
of 99.95%.
Meaning? 99.95% of all possible daily changes in the market will be
covered by the IMR
OR
the IMR will be enough to cover any 1 day loss 99.95% of the time
IMR the worst case in looking backwards AND forwards in time….
See the documents at http://www.safex.co.za/ed/risk_management.asp
Let’s make it real and look at some numbers in Excel ……
© 13ABSA Technical Valuation Session
Spread Margins
Let’s discuss the headings:
Fixed Margin – dealt with
OFFSETS
Spread Margin – also known as calendar spread margin. Trading the
same underlying with different expiry dates e.g. long ALSU0 and short
ALSZ0
A “discount” is thus given for such trades
Calculation similar to that for fixed margin. Use spreads instead of
futures levels. Conservative: use maximum margin over different
expiries
Series Spread Margin – trading in different underlyings e.g. long
ALSU0 and short FNDU0.
Offset only applicable to certain indices
Calculation similar to that for fixed margin using the spreads
© 14ABSA Technical Valuation Session
Concentration and Liquidity Risks
The credit crises showed that we had to enhance the model for illiquid
instruments and concentrated positions
Concentration risk lies in the fact that a single or few parties may hold
large positions relative to the issued share capital.
Ratings of 1 & 2 are considered as Liquid Contracts – SSF will be listed
Ratings of 3 are considered as Illiquid Contracts – SSF will not be listed
© 15Concentration risk = Position / Shares in Issue
ABSA Technical Valuation Session
Initial Margin Calculations for Illiquids
3 2 2.684521 3.928324 6.274398 8.433277 9.511071 9.835002 9.949161 10.00589 10.02
Liquidity
Rating
2 1.2 1.742451 2.724644 4.584617 6.703902 7.974339 8.35733 8.567661 8.632931 8.63
1 1 1.167901 1.628874 2.369143 3.125875 3.704345 4.114506 4.294166 4.507414 4.565
0-10 10-20 20-30 30-40 40-50 50-60 60-70 70-80 80-90 90-100
Concentration risk
Concentration risk = Position / Shares in Issue
12
10
8
Margin Factor
6
4
2
0
0 10 20 30 40 50 60 70 80 90 100
Concentration Risk
© 16ABSA Technical Valuation Session
Initial Margin Requirements for Can-Do futures
Indices and SSFs with nonstandard expiry dates: use IMR for similar
standard contract (nearest expiry date)
Baskets: calculate IMR for each share from IMR for standardised SSF.
Calculate total weighted IMR for basket.
Currently there is no offset between different Can-Dos or Can-Dos and
standard derivatives e.g. if you trade a basket of shares against a
standard Alsi future, no offset will be given
© 17ABSA Technical Valuation Session
Initial Margins for Vanilla Options
We have shown how to calculate the IMR for a futures contract – this is
a 1 dimensional problem
The risk of an option is 2 dimensional: we need to assess the influence
of changes in the underlying market AND changes in volatility
This is done via Risk Array’s and VSR’s
Let’s explain this through a practical example…..
Spreadsheet can be downloaded from
http://www.jse.co.za/Markets/Equity-Derivatives-Market/Margining-
methodology.aspx#IMR
© 18ABSA Technical Valuation Session
Option Margins
© 19ABSA Technical Valuation Session
Can-Do Options
Can-Do Options: listed derivatives with the flexibility of OTC contracts
Current drivers are
− counter-party risk
− disclosure
− mandate issues
− balance sheet management – liquidity costs
The exchange acts as the central counter-party to all trades
JSE acts as calculation agent and provides a “market value”
Trades margined daily
© 20ABSA Technical Valuation Session
Can-Do Options
Listed so far: Asian’s, barrier’s, Variance Swaps, cliquets, lookbacks,
lookbacks with Asian features, digitals and binary barriers, ladders with
time partiality (also called Timers)
Philosophy: if we can value it and risk manage it, we can list it
Safex is the only exchange in the world that offers such flexibility and
such a wide range of listed exotics
© 21ABSA Technical Valuation Session
Can-Do Options
Pricing models are independently created by the
exchange
This can entail either closed-form solutions,
binomial trees, trinomial trees or Monte Carlo
simulations
All models are validated by running parallel tests
between the exchange, the market maker and
institutional investor before the derivative is
listed
© 22ABSA Technical Valuation Session
Exotic Option Margins
Use the same methodology as vanilla options
Use risk arrays but with the exotic option pricer in place of the vanilla
pricer
Be aware of the dynamics of exotic options:
Vanilla option becomes more expensive the higher the
volatility
Knock-Out option becomes cheaper the higher the volatility
There are no offsets between different Can-Dos and/or Can-Dos and
standard derivatives.
Offset is achieved if ALL instruments form part of a single Can-Do
© 23ABSA Technical Valuation Session
Variance Futures
Quite a few Var Swaps listed under the Can-Do banner
There are also standardised Var Futures – Savi Squared
Realised Variance is defined as
Daily MtM is given by
With K the implied variance at t calculated using the Derman-Kani
model
Lastly
IMR = NumberCont racts × VPV × [ 2λ K + λ 2 ]
© 24ABSA Technical Valuation Session
The Initial Margin for Futures
Questions?
© 25ABSA Technical Valuation Session
The Volatility Surface: What is Volatility?
Volatility is a measure of risk or uncertainty
Volatility is defined as the variation of an asset's returns – it indicates
the range of a return's movement. Large values of volatility mean that
returns fluctuate in a wide range – in statistical terms, the standard
deviation is such a measure and offers an indication of the dispersion or
spread of the data
Volatility has peculiar dynamics:
− It increases when uncertainty increases
− Volatility is mean reverting - high volatilities eventually decrease and low
ones will likely rise to some long term mean
− Volatility is often negatively correlated to the stock or index level
− Volatility clusters - it is statistically persistent, i.e., if it is volatile today, it
should continue to be volatile tomorrow
© 26ABSA Technical Valuation Session
Volatility
© 27ABSA Technical Valuation Session
Volatility
© 28ABSA Technical Valuation Session
The Volatility Skew
Options (on the same underlying with the same expiry date) with different
strike prices trade at different volatilities - traders say volatilities are skewed
when options of a given asset trade at increasing or decreasing levels of implied
volatility as you move through the strikes.
© 29ABSA Technical Valuation Session
Term Structure of ATM volatilities
The at-the-money volatilities for different expiry dates are decreasing
in time a
tb
© 30ABSA Technical Valuation Session
Volatility Surface: Admin
Safex currently updates the volatility surface twice per month – second
and last Tuesday
How does the JSE obtain the volatility surface?
Used to poll the market monthly
© 31ABSA Technical Valuation Session
Modeling the Volatility Surface
If the trade data is available, can the skew be modelled?
Yes. Many models have been proposed
Surface Dynamic = Tilt (ρ) + Curvature/Vol of vol (υ) + Shift (γ) + Vertex
Smoothness (ξ) (smile) +…….
Three types of models: local vol models, stochastic vol models and
deterministic model
Two factor stochastic vol model: Stochastic Alpha Beta Rho (Sabr)
− Assumes vol. is stochastic, Sabr (ρ, υ); Beta fixes the underlying volatility
process and is fixed at 80% for equities, 0 for IR (vols Gaussian) and 1 for
currencies (vols lognormal)
Three factor deterministic vol model: Quadratic (Quad)
− Quad(ρ, υ, γ) – no assumption on the dynamics of the volatility process
Four factor deterministic vol model: Stochastic Volatility Inspired (SVI)
− SVI(ρ, υ, γ, ξ) - no assumption on the dynamics of the volatility process
©
Most banks seem to use deterministic models – up to 6 factors 32ABSA Technical Valuation Session
Calibrating the Models
Use trade data to calibrate models
Essentially, need to find model parameters that minimize the distance
between the model volatilities, and the traded volatilities.
Finding model with stable parameters, non-trivial, mainly due to sparse
trade data
Parameterise models using minimal user adjustments – let the data
show the way
© 33ABSA Technical Valuation Session
Model Implemented
Empirical tests show that the quadratic model is best suited to SA
equities market – SVI for commodities and currencies
Safex implemented the following model during October 2010
With K the moneyness NOT the strike
The volatility term structure is modeled by
Optimisation is performed using TRADED DATA only in obtaining the 5
parameters.
One condition to take care of is to ensure that calendar-spread arbitrage
is minimised
© Currently testing a volatility model for White Maize 34ABSA Technical Valuation Session
Model Implemented
The parameters are
β0 = Constant volatility (shift or trend) parameter. β 0 > 0
β1 = correlation (slope) term. This parameter accounts for the negative
correlation between the underlying index and volatility. The no-
spread-arbitrage condition requires that
− 1 < β1 < 0
β2 = is the volatility of volatility (`vol of vol' or curvature/convexity)
parameter. The no-calendar-spread arbitrage convexity condition
requires that
β2 > 0
© 35ABSA Technical Valuation Session
Model Implemented
The document “Constructing a South African Index Volatility
Surface from Exchange Traded Data” can be downloaded from
http://www.jse.co.za/Products/Equity-Derivatives-Market/Equity-
Derivatives-Product-Detail/Equity_Options.aspx
or
http://www.quantonline.co.za/publications_and_research.html
© 36ABSA Technical Valuation Session
ATM Model Volatility
One of the BIG advantages of the current implementation is that we can
calculate the ATM volatilities as well
This is obtained by noting that if K = 100 %
If we work with floating skews alone we note that
© 37ABSA Technical Valuation Session
Different Markets
With the Global Derivatives Market now operational, one needs to know
that different markets have different skew shapes and thus different
volatility dynamics
© 38ABSA Technical Valuation Session
Initial Margins for Vanilla Options
Questions?
© 39ABSA Technical Valuation Session
Contact Details
For more information look at our web site at www.quantonline.co.za
Email: consultant@quantonline.co.za
© 40You can also read