Fatigue Risk Management at easyJet - a case study - By Scott Derbyshire and Phil Barton
←
→
Page content transcription
If your browser does not render page correctly, please read the page content below

Fatigue Risk Management at easyJet – a case
study

By Scott Derbyshire and Phil Barton

                                          1
About
 Some easyJet…
        Facts…
      1995            2012

                      21 bases
     1 base
                    110 airports
   3 airports
                    26 countries

    2 routes         500 routes

                     200 aircraft
2 leased aircraft
                    46 million pax

 Virtual airline!    6500 crew

                                 2
Fatigue and Crew performance

 4 ICAO Definition of Fatigue:

    “A physiological state of reduced mental or
   physical performance capability resulting from
   sleep loss or extended wakefulness, circadian
     phase, or workload that can impair a crew
   member’s alertness and ability to safely operate
    an aircraft or perform safety related duties.”
 4 Everyone carries some level of tiredness and fatigue risk.
 4 It is the point that fatigue degrades crew performance to
   unacceptable levels that must be managed by FRMS.

                                                                3
Prescriptive regulation is not enough

• Historically, control of fatigue has been achieved by prescriptive rules –
  in the UK based upon CAP371.
• This provides a simplistic illusion of safety management:
    • within the limits you are safe, outside the limits you are unsafe
    • “one size fits all” – one set of rules can cover all operational situations.
• Improved understanding of fatigue has led to a more scientific approach
  to FTL based on the analysis of data specific to the operator and
  individual characteristics such as fleet, base and schedule.
• The Safety argument is endorsed by the regulators: ICAO, EASA,
  FAA, CAA.
• Operators who demonstrate responsible management of their fatigue-
  related risks through a mature FRMS are not prevented from gaining
  its full benefits by unnecessarily restrictive constraints.
• FRMS is the means by which easyJet can deliver sustainable flexibility
  and efficiency in a risk controlled environment.

                                                                                     4
When did fatigue management begin at easyJet?
  • In 2003 easyJet identified increased operational risk arising from fatigue.
    This included a high risk event where there was evidence of crew micro
    sleep during a critical phase or flight.
  • There was a realisation that despite being compliant with CAP371,
    easyJet remained exposed to the risk of roster related fatigue.
  • This initiated a fundamental review of rostering practices and philosophies
    which resulted in the creation of a Fatigue Risk Management System.

                                                                                  5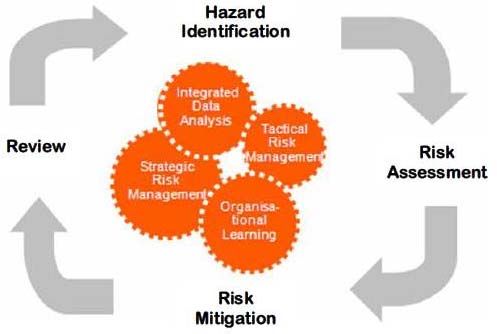
6 & 3 and ‘Project Blue’
  Project Blue
  • A basic human factors study correlating FDM/ASR data against
    duty day on 6 & 3.
  • Analysis showed spikes in FDM on D1 (start), D4 (transition) and
    D6 (final).
  • Results helped negotiate a prototype 5452 pattern that went beyond
    the limits of CAP 371. It demonstrated the application of objective
    scientific data to reinforce and evidence legal rules in a
    collaboration with crews and the UK regulator.
  • Fewer “wasted” duty days: “flexi-days” repackaged as days off.
  • Lower risk of cumulative limits being a constraint.
  • Reserve periods to “absorb” disruption.
  • Increased productivity.
  • Lower sickness rates.
  • Higher retention rates.

                                                                     6
Development of the easyJet FRMS
• Rulesets evolved: 5453 (November 2006) and non fixed pattern variation
  (March 2009).
• FRMS capability evolved: October 2005 programme for the use of
  predictive software (FAID).
• September 2006 availability of online FRF reporting.
• October 2006 rollout of crew computer based FACT.
• December 2007 inclusion of FRMS into CAA approved FTL scheme.
• November 2008 drafting of comprehensive FRMS procedures manual.
• July 2009 coding of FRMS guidelines into optimised rostering systems.
• 2010: Development of HFMP methodology in partnership with NASA
  Ames, Imperial College and ONERA.
• January 2011 completion of first formal regulator FRMS specific audit.
• December 2011: Four year extension of the NASA Space Act Agreement
  collaboration.
• 2012: Second generation FACT training and SAFE contract agreement.

                                                                    7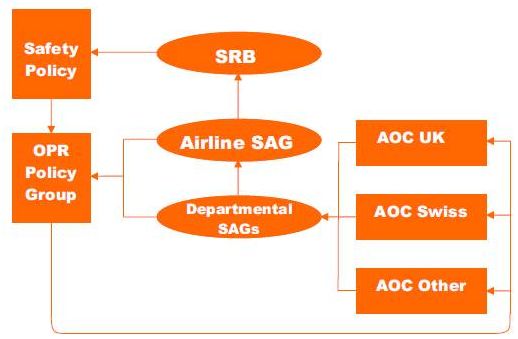
EZY compliant with ICAO requirements
4 The State shall approve an operator’s FRMS:
4 Policy and
Policy and Documentation documentation,
4 FRM processes,
Fatigue Risk Management Processes FRMS Safety Assurance Processes
Fatigue Hazard Compliance Investigations
4 FRMS safety
Identification Performance Indicators
assurance processes,
Risk
Assessment
(Reactive
Evidence
- based
Analysis and
System 4 Effective reporting,
Proactive controls Evaluation
Predictive)
4 FRMS promotion
Manage
Manage processes,
Effective Reporting 4 Parameters;
Hard
FRMS Promotion Processes Soft
8
Utilises the same processes as company SMS

  Risk Assessment including ERC                  Safety Meeting Structure

   Event Risk Classification: How bad could it be? How close did it get?

                                                                            9
FRMS – Dynamic Risk based approach

                                                                             It’s sometime
FRMS uses a ‘risk                                                   acceptable to operate
based’ approach to                                                at the outer limits of the
manage fatigue. This                                               safety space provided
offers easyJet                                                             the risk can be
flexibility to operate                                             dynamically assessed
within a ‘Safety                                                           and mitigated.
Space’, where limits
are not hard.

Dynamic risk assessment enabled by SMS/FRMS works to maximise opportunity when we need it
                                        most…
                                                                                      10
Components of easyJet FRMS 1. Fatigue Reporting Process (FRF) – FRMS processed 5500 reports in 2010 2. Through SafetyNet, FRMS taps into all forms of safety data, trend, analyse 3. Analysis reported through 3-levels of Safety Action Group (SAG) 4. Rosters are analysed using bio-mathematical modelling techniques (SAFE/FAID) 5. Operational staff and all crew undergo initial/recurrent FACT training
Collaborative Research

•    Results from the latest 2011 pilot study into the effectiveness of FRV mitigations
     found:
      • Levels of sleepiness and reduced performance didn’t reach disturbing levels at
        anytime during the study;
      • Since Samn-Perelli scores seldom exceeded 5, the fairly low levels of sleepiness
        for most pilots had little effect on their performance as measured by their PVT
        response times;
      • Samn-Perelli scores correlated significantly with mean PVT response times i.e.
        higher fatigue = reduced performance. PVT scores were impacted greatly by time
        of day showing the influence of circadian rhythm on fatigue;
      • Self perception of being able to operate was invariable higher than actual ability to
        perform. This was particularly true for late duties, where performance was typically
        lower than for earliers – despite lates being preferred over earlies.

                                                                                         12
Some findings - Sleep Analysis
Subjective and objective sleep duration (hrs) Subjective and objective sleep duration (mins) by day
The two graphs illustrate a close relationship between subjective (workbook) and objective (Actiwatch) sleep
duration.
To confirm the relationship objectively, a statistical analysis is utilised.
Strong correlation
Correlation Objective Sleep Duration
Spearman’s Correlation .814
Subjective sleep Strong statistical
Significance (1‐tailed) .000
Duration significance
Number of samples 531
Statistical analysis (Spearman’s) between subjective and objective sleep duration
Significance: A value of .05 and less is scientifically considered to be the indicator of a relationship.
Correlation: The closer it is to 1, the stronger the correlation.
13Performance measured by PVT
Samn-Perelli Fatigue Checklist
PVT reaction time (msec) by perceived fatigue
PVT - An ideal fatigue indicator as it measures human reaction while being highly sensitive and responsive
to sleeping patterns.
Fatigue – Self-assessed 7 point Samn-Perelli Fatigue scale. The graph illustrating PVT and perceived
fatigue Indicates that when reaction time increases, fatigue levels increase.
Correlation Fatigue
Spearman’s Correlation .431 Strong statistical
significance
Reaction time Significance (1‐tailed) .000
Number of samples 1047
Statistical analysis (Spearman’s) between subjective and objective sleep duration (hrs)
Significance: A value of .05 and less is scientifically considered to be the indicator of a relationship.
Correlation: The closer it is to 1, the stronger the correlation.
14PVT continued
PVT valid response and sleep duration (mins)
An upward trend with PVT valid response increasing as sleep duration increases.
Correlation Sleep duration
Strong statistical
Spearman’s Correlation .212 significance
Valid
Significance (1‐tailed) .000
response
Number of samples 290
Statistical analysis (Spearman’s) between PVT valid response and sleep duration
Significance: A value of .05 and less is scientifically considered to be the indicator of a relationship.
Correlation: The closer it is to 1, the stronger the correlation.
15Challenges of FRMS
• Legacy and inertia reinforced by the comfort of binary legislation. Legal =
safe. Illegal = unsafe.
• Demands increased soft coding and penalties in optimiser systems.
• Requires increased understanding of the science behind roster
construction techniques.
• A new generation of more highly skilled staff supported by powerful
systems and complemented by adaptive and dynamic processes.
Demands a change in “the knowledge base and skill sets” required.
• Flexibility brings choice, responsibility and a tension with the perception
of complexity.
• Potential for abuse and misappropriation: independence and credibility.
16Benefits of FRMS
• Reduces operational risk by mitigating against fatigue related crew error.
• Promotes crew effectiveness, lifestyle sustainability and retention.
• Operational flexibility including derogation from the prescriptive FTL rules
that have to be observed by non FRMS carriers.
• Provides the organisation with increased and more wide ranging
rostering opportunities.
• A regulator approved FRMS allows for greater levels of corporate self
governance.
• Promotes informed decision making by the business enabling the
balancing of commercial drive and safety oversight.
17The road ahead
• FRMS reflects the volatile and changing nature of fatigue risk.
Our experience and research continues to open up areas of
interest which will allow us to maintain confidence in our ability
to adequately manage fatigue risk:
• Cumulative fatigue – Impact of intense schedules over longer
time periods (years to entire careers).
• Individual differences – How to consider and tailor FRMS
processes to individual crew members e.g. chronotype,
experience, commute, personal circumstances.
• Sector workload – The impact of consecutive, sector intense
schedules.
• Pilots and Cabin Crew – The different considerations for each
crew group given tasking demands.
• Complacency – Training, automation and adherence to SOPs.
18Enabling Production and
Protection in Harmony
Date : 19You can also read