Characteristics of Foreshocks Occurrence of Onshore Earthquakes In Japan For Mj3.0 To 7.2 Mainshocks
←
→
Page content transcription
If your browser does not render page correctly, please read the page content below
Characteristics of Foreshocks Occurrence of
Onshore Earthquakes In Japan For Mj3.0 To 7.2
Mainshocks
Hong Peng ( peng.hong.62a@st.kyoto-u.ac.jp )
Kyoto University: Kyoto Daigaku
James Jiro Mori
Kyoto University: Kyoto Daigaku
Research Article
Keywords: Foreshocks, Occurrence, Earthquakes, Onshore
Posted Date: September 20th, 2021
DOI: https://doi.org/10.21203/rs.3.rs-801102/v1
License: This work is licensed under a Creative Commons Attribution 4.0 International License.
Read Full License
Page 1/16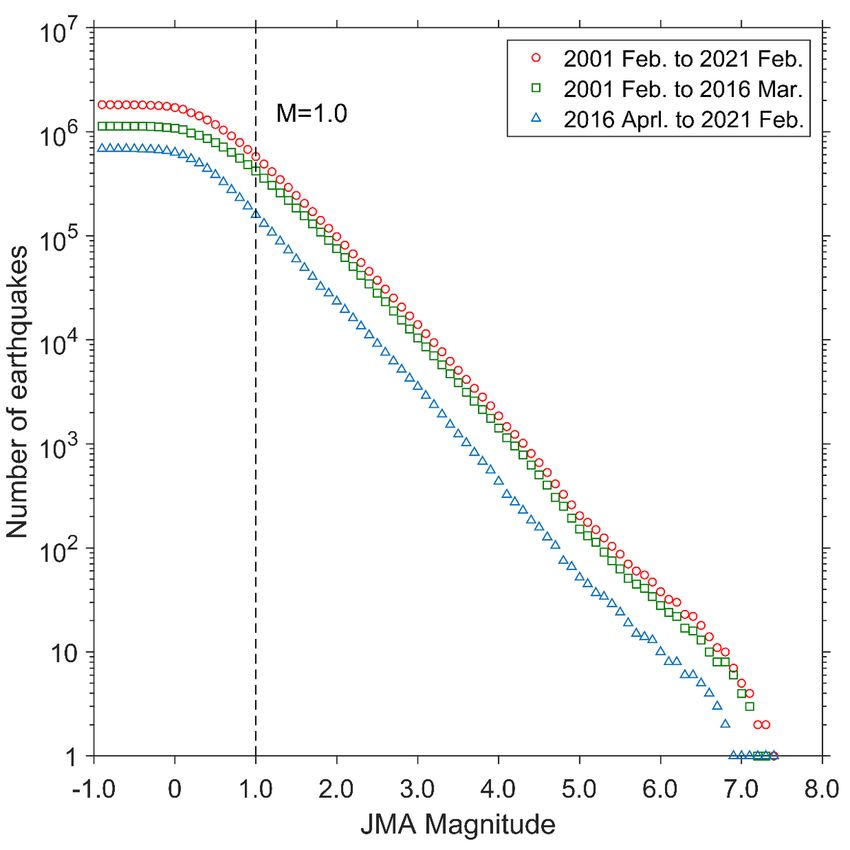
Abstract
We use the Japan Meteorological Agency (JMA) earthquake catalogue from 2001 to 2021 to investigate
the spatiotemporal distribution of foreshocks for shallow mainshocks (Mj3.0–7.2) that are located
onshore of Japan. We find clear peaks for the earlier small earthquakes within 10 days and 3 km prior to
the mainshocks, which are considered as our definition of foreshocks. After removing the aftershocks,
earthquake swarms and possible earthquakes triggered by the 2011 Mw9.0 Tohoku-oki earthquake, we
find that for the 2,066 independent earthquakes, 783 (37.9%) have one or more foreshocks. There is a
decreasing trend of foreshock occurrence with mainshock depth. Also, normal faulting earthquakes have
higher foreshock occurrence than reverse faulting earthquakes. We calculate the rates of foreshock
occurrence as a function of the magnitudes of foreshocks and mainshocks, and we have found no clear
trend between the magnitudes of foreshocks and mainshocks.

Key Points
  1. We analysis the foreshocks of shallow onshore earthquakes in Japan from 2001 to 2021, which are
     recorded by Japan Meteorological Agency (JMA) earthquake catalogue.
  2. Basically, about 37.9% shallow onshore earthquakes have foreshocks, and this is consistent with the
    reports of foreshocks in other regions (e.g., Italy and California).
  3. The foreshocks occurrence may depend on the type of mainshock focal mechanism, but they are
     random in magnitudes.
  4. A rupture-controlled model or cascade model can interpret the foreshocks occurrence of onshore
    shallow earthquakes in Japan.

Introduction
An earthquake (mainshock) may be preceded closely in time and space by one or more smaller
earthquakes which are known as foreshocks (Mogi, 1963). There have been numerous studies of
foreshocks for various regions, and a wide range of reported rates of foreshock occurrence from about
10% to 70% in the western US (Jones, 1985; Abercrombie and Mori, 1996; Chen and Shearer, 2015;
Trugman and Ross, 2019; van den Ende and Ampuero, 2019; Moutote et al., 2021), Japan (Yoshida, 1990;
Maeda, 1996) and Italy (Console et al., 1993). There were also some well recorded larger earthquakes
without foreshocks. For example, the 2004 M6.0 Parkfield earthquake did not have foreshocks while the
1934 and 1966 Parkfield earthquakes had clear foreshocks (Bakun and McEvily, 1979). In order to help
clarify the rates of foreshock occurrence, we summarize the characteristics for a relatively large dataset
of over 2000 mainshocks with magnitudes from Mj3.0 to 7.2 that have been recorded onshore of Japan
over the last 20 years. In contrast, previous regional studies of foreshocks examined only about 50 to 100
mainshocks.

Data

                                                   Page 2/16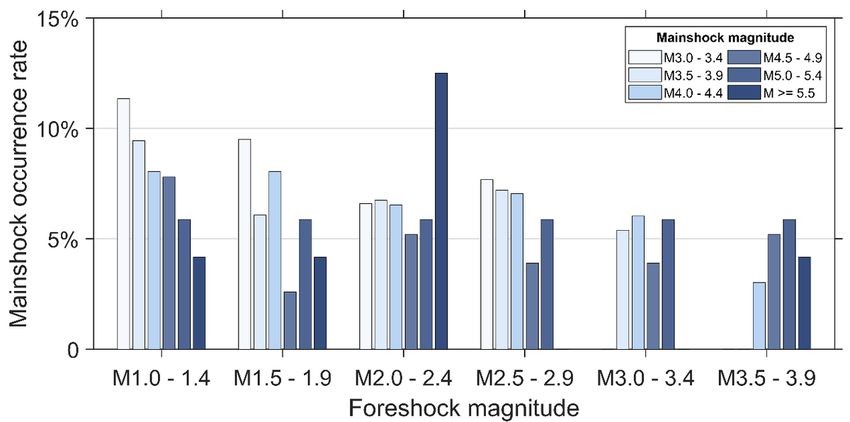
Japan is one of the most seismically active regions of the world, and benefits from having some of the
best observation networks. After the 1995 Mj7.3 Hyogoken-nanbu (Kobe) earthquake, the National
Research Institute for Earthquake Science and Disaster Prevention (NIED) installed the High Sensitivity
Seismograph Network Japan (Hi-net), which currently is composed of about 800 borehole seismic
stations spaced uniformly across Japan at intervals of 20 to 30 km (Okada et al., 2004; Obara et al.,
2005). These stations provide high signal to noise (SNR) recording of the earthquakes and contribute to
the Japan Meteorological Agency (JMA) earthquake catalogue with a very good level of completeness.

We use hypocentral information from the JMA earthquake catalogue from January 1, 2001 to February
28, 2021. We only consider the shallow (depth = 1.0 is chosen for this study.

Catalogue Declustering

In order to evaluate the foreshocks under normal ambient stress conditions, we attempt to remove
aftershocks, earthquake swarms and possible triggered earthquakes from the 2011 Tohoku-oki
earthquake. For the aftershocks, we decluster the earthquake catalogue based on the aftershock time-
space windows from Gardner and Knopoff (1974), which are commonly used for declustered earthquake
catalogues. Figure 2 shows the yearly number of earthquakes before (blue) and after (red) the aftershock
removal. Earthquake swarms are sequences during which sometimes hundreds of earthquakes occur in a
short time, and have patterns different from typical foreshock-mainshock sequences. Figure 3 is an
example of an earthquake swarm on December 18, 2009. For this earthquake, about 277 earlier
earthquakes occurred within about 4 km and 1 day prior to the mainshock. In this study, we define
earthquake swarms as sequences that have more than 150 earlier earthquakes that occur within 30 days
and 30 km before the subsequent mainshock(s), which is over 10 times higher than the earthquake level
prior to most of the independent earthquakes. We exclude 29 mainshocks associated with swarms from
our earthquake catalogue. This number is about 1% of all the identified independent earthquakes and it
does not significantly affect the statistics.

The 2011 Mw9.0 Tohoku-oki earthquake presented a special problem since there was increased
seismicity following the mainshock in eastern Japan, and even farther distances throughout much of the
country (Miyazawa, 2011). These earthquakes are normally not classified as aftershocks, but were
considered to be the triggered earthquakes related to the widespread effects of the great Tohoku-oki
earthquake. The triggered earthquakes should be removed because inferred foreshocks (identified by the
time-space window) may not be directly related to the subsequent nearby mainshocks, but instead

                                                  Page 3/16
caused by the larger scale regional stress changes from the Tohoku-oki earthquake. For minimizing the
effects of these possible triggered earthquakes, we remove 822 earthquakes (Mj3.0 to 7.0) for 5 years
from March 2011 to March 2016 across the entire country. Earthquakes which are considered to be
aftershocks are still occurring in the offshore Tohoku region 10 years after the mainshock (e.g., the 2021
Mj7.3 Fukushima earthquake). However, the levels of seismicity onshore appear to return to normal levels
before the Tohoku-oki earthquake in about 5 years (Fig. 2).
After the aftershocks, earthquake swarms and possible triggered earthquakes following the Tohoku-oki
earthquake are removed, we have 2066 independent earthquakes (Mj3.0 – 7.2) for the analysis of
foreshock occurrence. The earthquakes are distributed relatively evenly across the entire country (Fig. 4).
Focal mechanisms are available for 593 independent earthquakes, with 86 normal (rake 225° – 315°),
235 strike-slip (rake 315° – 45° and 135° – 225°) and 272 reverse (rake 45° – 135°) earthquakes. This
dataset of mainshocks can be the representative of the onshore Japan seismicity during the period for
2001 to 2021 under normal ambient regional stress conditions.
Definition of foreshocks
To define the foreshocks in this study, we investigate the time and space distribution of every pair of
earthquakes when a larger earthquake follows a smaller earthquake. We use times of 0 to 30 days and
distances of 0 to 30 km as the time-space window to search for earlier earthquakes. Figure 5 shows the
time and space distribution of the earlier earthquakes for a total of 31,382 earthquake pairs. There are
several obvious peaks within a few days and few kilometers of epicentral distance prior to the
mainshocks. We use epicentral distance instead of hypocentral distance, since the location uncertainties
are larger in the vertical compared to the horizontal. The red bars show values that are greater than the
average background value, which is calculated for times longer than 15 days and distance greater than
10 km. Therefore, the definition of foreshocks used in this study are earthquakes smaller in magnitude
than the mainshock that occur within 10 days prior to the mainshock at epicentral distances closer than 3
km. The other earthquakes at longer time and farther distance (white bars) are considered to be the
random background seismicity. Figure 5 is similar to a figure presented by Jones (1985), which shows
that foreshocks in California mostly occur at times of less than 5 days and distances of less than 10 km.
There may be some ‘foreshocks’ (small earlier earthquakes that are physically related to the mainshock)
at longer time and farther distance than our definition. For example, studies in southern California include
earthquakes up to several months before the mainshock as foreshocks (Trugman and Ross, 2019, Van
den Ende and Ampuero, 2020, Moutote et al, 2021). However, in this study we cannot distinguish such
possible foreshocks from the background seismicity.
Results
After searching for the foreshocks in our earthquake catalogue for the 2,066 independent earthquakes (Mj
3.0–7.2), we find 783 (37.9%) earthquakes have one or more foreshocks (Mj > = 1.0), as defined by our
criteria of 10 days and 3 km. The value is very similar to the rate of 37% reported by Yoshida (1990) for
Page 4/16110 shallow mainshocks in Japan M > = 5.0 during 1961 to 1988. Characteristics of the foreshock
occurrence are summarized in Fig. 6. We look at the foreshock occurrence as a function of depth in Fig.
6a, which shows the percentage of earthquakes with foreshocks as a function of mainshock depth. We
observe a clear decrease of foreshock occurrence with depth. Figure 6b plots the relations between
foreshock occurrence and mainshock focal mechanism by using the rake angle. The mainshock focal
mechanisms are from the Broadband Seismograph Network (F-net) and usually available for earthquakes
of Mj > = 3.5. Since the fault plane is not known for most of the smaller earthquakes, the rake values on
the two nodal planes are averaged. This is not a simple average of the rake angles, but an average of the
angle difference from pure reverse or pure normal faulting. Using this method, the difference between the
rake angles of the two nodal planes is usually small. We can see that there is a decreasing trend of the
percentage of earthquakes with foreshocks from the normal, through strike-slip to reverse faulting.
Figure 6c shows the foreshock occurrence as a function of mainshock magnitude. It has been reported
that foreshocks also follow b-values statistics (Console, 1993, Reasenberg and Jones, 1989, Maeda,
1993), so counting a different size range of foreshocks before different size mainshocks may contribute
to a bias. Therefore, two curves are shown in the plot. The blue curve shows the occurrence rates using
the data for all magnitude foreshocks. The red curve uses only foreshocks that are within 2 magnitude
units of the mainshock. The second curve should be a more consistent measure of foreshock occurrence
for different size mainshocks. The results in Fig. 6c do not show any clear relation between foreshock
and mainshock magnitudes.
Related to Fig. 6c, we calculate the rates of foreshock occurrence by counting the number of times a
foreshock of given size is followed by a mainshock (as compared to the number of times that an
earthquake of the same size is not followed by a mainshock) using our defined time-space window of 10
days and 3 km. For each foreshock sequence we use only the largest foreshock because smaller
foreshocks are often considered to be the possible ‘aftershocks’ of the largest foreshock. The results are
shown in Table 1 and Fig. 7 as a function of both foreshock and mainshock magnitudes. For example,
looking at the first row in Table 1, for the Mj1.0 to 1.4 foreshocks about 11.35% of the events are followed
by Mj3.0 to 3.4 mainshocks, and 9.44% are followed by Mj3.5 to 3.9 mainshocks. Looking at the values
plotted in Fig. 7, there are no clear trends as a function of foreshock or mainshock magnitude. For
example, for all values of foreshock magnitude from Mj1.0 to 3.9 foreshocks, there is approximately the
same rate of the occurrence (about 6%) of Mj5.0 to 5.4 mainshocks. This implies that the size of the
foreshock is not related to the size of the subsequent mainshock.
Page 5/16Table 1
Occurrence rates for different magnitudes of mainshocks as a function of foreshock magnitude.
Mainshock magnitude
3.0–3.4 3.5–3.9 4.0–4.4 4.5–4.9 5.0–5.4 >= 5.5
Foreshock magnitude 1.0–1.4 11.35% 9.44% 8.04% 7.79% 5.88% 4.17%
1.5–1.9 9.51% 6.07% 8.04% 2.60% 5.88% 4.17%
2.0–2.4 6.60% 6.74% 6.53% 5.19% 5.88% 12.5%
2.5–2.9 7.67% 7.19% 7.04% 3.90% 5.88% 0
3.0–3.4 - 5.39% 6.03% 3.90% 5.88% 0
3.5–3.9 - - 3.02% 5.19% 5.88% 4.17%
Discussion
The results of the foreshock occurrence as a function of depth and focal mechanism are quite similar to
the trends in the western United States using a smaller data set (Abercrombie and Mori, 1996), despite
having a difference in tectonic settings. The western US is dominated by normal and strike-slip faulting
while reverse faulting is more common in most regions of Japan. Both regions show higher foreshock
occurrence for shallow depth compared to greater depths, and higher foreshock occurrence for normal
faulting compared to reverse faulting. Abercrombie and Mori (1996) suggested that these trends in depth
and focal mechanism may be the result of variations in normal stress with depth and in mechanism from
normal to reverse faulting, which indicates that higher normal stress may inhibit foreshock occurrence.
The results for the depth dependence of foreshock occurrence are quite robust. Using slightly different
definitions for the foreshock time-space window or different subsets of the catalogue does not
significantly change the trend or percentages (Fig. S1). Since normal faulting earthquakes are relatively
few in Japan, the dependence on focal mechanism is not as clear. There were a number of triggered
earthquakes following the Tohoku-oki earthquake with normal fault mechanisms. Thus, deleting or
including these earthquakes during the 5 to 10 years following the mainshock causes some differences
in the results. Figure S1 shows the foreshock occurrence as a function of mechanism for various
combinations of parameters. There are some differences in the percentages, but there remains an overall
consistent trend of foreshock occurrence decreasing for normal to reverse earthquakes.
Two end member models are often used to explain the foreshocks and how they can be related to the
mainshocks. A rupture-controlled or ‘cascade model’ interprets foreshocks as a part of a series of
triggered earthquakes that result in the mainshock (e.g., Helmstetter and Sornette 2003). The process is
rather random with no clear scaling of the size and location of the triggering foreshocks. At the other end
of the spectrum, the nucleation-controlled model interprets the foreshocks as a part of an initiation
process across the area. This may include possible slow slip or other precursory mechanisms (e.g.,
Page 6/16Dodge et al., 1996, Kato and Ben-Zion, 2021). Various models infer that the size of the initiation process
scales with the size of the mainshock. In our results, there does not seem to be a scaling between the
magnitudes of the foreshocks and mainshocks, which would be more consistent with the rupture-
controlled model. The independence of the foreshock magnitude compared to the mainshock magnitude
was also reported in Greece by Papazachos (1975) and the western US (Abercrombie and Mori, 1996).
A useful application of foreshock statistics is for evaluating hazard levels for subsequent large
earthquakes (Reasenberg and Jones (1989), Maeda 1996). Reasenberg and Jones (1989) assume a b-
value distribution for the foreshock-mainshock sequences and calculate probabilities for larger
earthquakes following small earthquakes that may be potential foreshocks. We also calculated
occurrence rates, which can be interpreted as probabilities for given magnitudes of foreshocks and
mainshocks (Fig. 7 and Table 1). Using the ‘generic model’ of Reasenberg and Jones (1989), which is
considered to appropriate for many regions, they show that the probability of a larger earthquake
following a smaller earthquake is always from 2 to 10%. These values are generally consistent with our
results in Fig. 7 which show occurrence rates of 2 to 12%. Other statistical models such as the Epidemic
Type Aftershock Sequence (ETAS) which uses background seismicity rates to calculate probabilities of
larger earthquakes also give values that are 1 to 10% (average is 3.7%) for different regions in Japan
(Ogata and Katsura, 2012).
Conclusions
We use a dataset of 2066 shallow independent earthquakes (Mj3.0–7.2) for onshore Japan, with
aftershocks, earthquake swarms and possible triggered earthquakes removed, to study the occurrence of
foreshocks down to Mj1.0. Slightly over one third (37.9%) of the mainshocks have one or more
foreshocks. We confirm a trend of decreasing foreshock occurrence with mainshock depth. Also, normal
faulting earthquakes are more likely to have foreshocks compared to reverse earthquakes. There is not a
clear relation between the magnitudes of the foreshocks and mainshocks. The observed rates of
foreshocks and mainshocks in this study, provide good statistics for seismic hazard evaluations and
calculating probabilities of earthquake occurrence following possible foreshocks.
Declarations
Availability of data and materials:
All the data are available online by Japan Meteorological Agency (JMA) and National Research Institute
for Earth Science and Disaster Prevention (NIED) (hinet.bosai.go.jp, fnet.bosai.go.jp).
Competing interests: Not applicable.
Funding: Not applicable.
Authors’ Contributions:
Page 7/16Hong Peng writes the code based on mathematical equations to analysis the data, gets the main results,
and writes the original manuscript.
James Mori provides the concept and methods for this research, and he edits the text of the paper before
submission.
Acknowledgments:
We thank the Japan Meteorological Agency (JMA) and National Research Institute for Earth Science and
Disaster Prevention (NIED) for providing the seismic data.
References
1. Abercrombie R, Mori J (1996) Occurrence patterns of foreshocks to large earthquakes in the western
United States. Nature 381:303–307. https://doi.org/10.1038/381303a0
2. Bakun WH, McEvily TV (1979) Earthquakes near Parkfield, California: Comparing the 1934 and 1966
Sequences. Science 205:1375–1377. DOI:10.1126/science.205.4413.1375
3. Chen X, Shearer PM (2015) Analysis of foreshock sequences in California and implications for
earthquake triggering. Pure appl Geophys 177:133–152
4. Console R, Murru M, Alessandrini B (1993) Foreshock statistics and their possible relationship to
earthquake prediction in the Italian region. Bull Seismol Soc Am 83(4):1248–1263
5. Dodge DA, Beroza GC, Ellsworth WL (1996) Detailed observations of California foreshock sequences:
Implications for the earthquake initiation process. J Geophys Res 101:22371–22392.
https://doi.org/10.1029/96JB02269
6. Gardner JK, Knopoff L (1974) Is the sequence of earthquakes in Southern California, with
aftershocks removed. Poissonian? Bull Seismol Soc Am 64(5):1363–1367
7. Helmstetter A, Sornette D (2003) Foreshocks explained by cascades of triggered seismicity. J
Geophys Res: Solid Earth 108(B10). https://doi.org/10.1029/2003JB002409
8. Jones LM (1985) Foreshocks and time-dependent earthquake hazard assessment in Southern
California. Bull Seismol Soc Am 75(6):1669–1679
9. Kato A, Ben-Zion Y (2021) The generation of large earthquakes. Nature Reviews Earth Environment
2:26–39
10. Maeda K (1996) The use of foreshocks in probabilistic prediction along the Japan and Kuril
trenches. Bull Seismol Soc Am 86(1A):242–254
11. Miyazawa M (2011) Propagation of an earthquake triggering front from the 2011 Tohoku-Oki
earthquake. Geophys Res Lett 38(23). https://doi.org/10.1029/2011gl049795
12. Mogi K (1963) Some Discussions on Aftershocks, Foreshocks and Earthquake Swarms: The Fracture
of a Semi-Infinite Body Caused by Inner Stress Origin and Its Relation to the Earthquake Phenomena
(3rd Paper). Bulletin of the Earthquake Research Institute 41: 615–658
Page 8/1613. Moutote L, Marsan D, Lengliné O, Duputel Z (2021) Rare Occurrences of Non-cascading Foreshock
Activity in Southern California. Geophys Res Lett 48(7) e2020GL091757.
https://doi.org/10.1029/2020GL091757
14. Obara K, Kasahara K, Hori S, Okada Y (2005) A densely distributed high-sensitivity seismograph
network in Japan: Hi-net by National Research Institute for Earth Science and Disaster Prevention.
Rev Sci Instrum 76:021301. DOI:10.1063/1.1854197
15. Ogata Y, Katsura K (2012) Prospective foreshock forecast experiment during the last 17 years.
Geophysical Journal International, Vol. 191. Issue 3. December 2012, 1237–1244
16. Okada Y, Kasahara K, Hori S, Obara K, Sekiguchi S, Fujiwara H, Yamamoto A (2004) Recent progress
of seismic observation networks in Japan -Hi-net, F-net, K-NET and KiK-net–. Earth Planets Space 56:
xv–xxviii. https://doi.org/10.1186/bf033 53076
17. Papazachos BD (1975) Foreshocks and earthquake prediction. Tectonophysics 28:213–226.
https://doi.org/10.1016/0040-1951(75)90038-4
18. Reasenberg PA, Jones LM (1989) Earthquake Hazard After a Mainshock in California. Science
243(4895):1173–1176. doi:10.1126/science.243.4895.1173
19. Trugman DT, Ross ZE (2019) Pervasive foreshock activity across Southern California. Geophys Res
Lett 46(15):8772–8781. https://doi.org/10.1029/2019GL083725
20. Van den Ende MPA, Ampuero JP (2020) On the Statistical Significance of Foreshock Sequences in
Southern California. Geophys Res Lett 47: e2019GL086224. https://doi.org/10.1029/2019GL086224
21. Yoshida A (1990) Characteristics of Foreshock Activities associated with Large Shallow Intraplate
Earthquakes in the Japanese Islands. Papers in Meteorology Geophysics 41:15–32
Figures
Page 9/16Figure 1
Cumulative number of onshore earthquakes in Japan from the JMA earthquake catalogue. The red
circles show the time period from 2001 to 2021, the green squares are for 2001 to 2016 and the blue
triangles are for 2016 to 2021. There was a change in the earthquake detection processing system in
2016. The dash line indicates the level of earthquake completeness at Mj1.0 used in this study.
Page 10/16Figure 2
JMA earthquake catalogue (blue) and declustered earthquake catalogue (red). We use aftershock
identification windows from Gardner and Knopoff (1974). Earthquake swarms and possible triggered
events following the 2011 Tohoku-oki earthquake are also removed. The declustered earthquake
catalogue shows similar level of yearly earthquake occurrences.
Page 11/16Figure 3
Example of earthquake swarms on December 18, 2009. The red star is the mainshock, white dots are
earlier earthquakes within 30 days and 30 km (most of them are within 1 day and 5 km). This earthquake
includes 277 earlier earthquakes, which is 10 times more than the average level for an independent
earthquake.
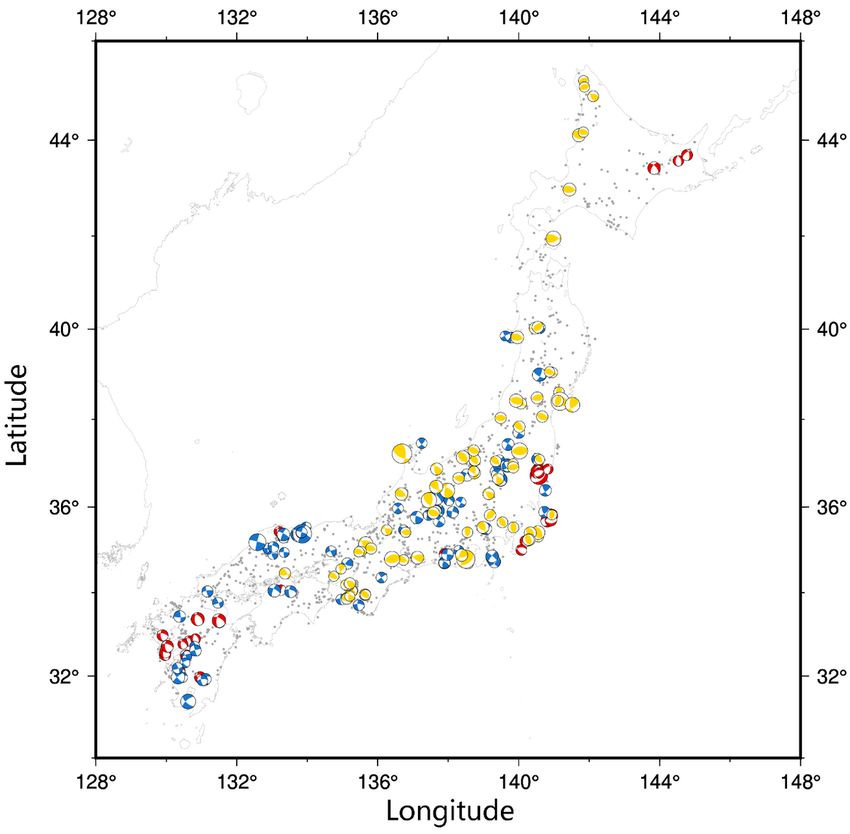
Page 12/16Figure 4
Distribution of mainshocks with focal mechanisms (F-net) used in this study. Red are normal faults, blue
are strike-slip faults and yellow are reverse faults. There are 2,066 independent earthquakes shown by the
focal mechanisms plus the small grey dots.
Page 13/16Figure 5
The time-space distribution of all earlier smaller events prior to the 2066 independent earthquakes. Red
bars (within 10 days and 3 km) are defined to be the foreshocks in this study. White bars are the random
background seismicity level.
Page 14/16Figure 6
Percentages of foreshock occurrence shown as function of (a) depth, (b) rake and (c) magnitude. The
numbers above the points give the total number of events for which the percentage was calculated. In 6c,
the blue line shows the percentage using all the data. The red dashed line shows the percentage using
only foreshocks within a range of 2 magnitude units from the mainshock.
Page 15/16Figure 7
Relations between the magnitudes of foreshocks and mainshocks, shown by the percentage of
mainshock occurrence for each foreshock and mainshock magnitude range.
Supplementary Files
This is a list of supplementary files associated with this preprint. Click to download.
Supplementary.docx
graphicalabstract.png
Page 16/16You can also read