Bell's Beer Bayview Mackinac Race Weather Resources-Part One
←
→
Page content transcription
If your browser does not render page correctly, please read the page content below
Mark Thornton
Mark@LakeErieWX.com
www.LakeErieWX.com
Bell’s Beer Bayview Mackinac Race
Weather Resources-Part One
Introduction
Sailing and weather forecasting go hand-in-hand. Experienced Mack sailors understand that
developing a pre-race weather forecast and monitoring its evolution on the racecourse is an
important strategic and safety aspect of participating in the Bell’s Beer Bayview Mackinac Race.
Misjudging the wind forecast can quickly send you to the back of your fleet, while failing to
properly assess and manage the risk of severe weather can unnecessarily jeopardize the safety
of the crew.
This article is the first of a two-part series and introduces several resources for developing your
pre-race forecast. The second article will discuss the more challenging task of monitoring
weather developments after the starting gun.
The Big Picture
Large-Scale Dynamics
Your Mack forecast should begin with an understanding of the large-scale weather features. Is a
low pressure system expected to cross Lake Huron during the race? If so, when is the warm and
/ or cold front and accompanying wind shift expected to occur? Is the system expected to
produce strong winds, large waves, or thunderstorms? Or, will the Mack be dominated by the
fluky, thermally-driven lake and land breezes associated with a large area of high pressure?
NOAA’s Weather Prediction Center (WPC) (click here) produces a variety of products that focus
on predicting the development and evolution of large-scale weather features. The WPC’s
surface weather forecasts are divided into short-term and long-term periods with the short-
term period covering the first 2 ½ days of the forecast period (in 12-hour intervals) and the long-
term period covering days three through seven at 24-hour intervals. By carefully reviewing the
forecasts in chronological order, you can determine what large-scale weather features will affect
the racecourse, and then use the information to chart the fastest course to the Island.
Graphics published by the WPC contain a variety of unique symbols and meteorological
shorthand to show the overall barometric pressure pattern and the anticipated location of high
pressure systems, low pressure systems (and accompanying frontal boundaries) along with
additional features such as ridges, troughs and squall lines. Sailors who are unfamiliar with this
meteorological shorthand are encouraged to review the legend published by the WPC (click
here).
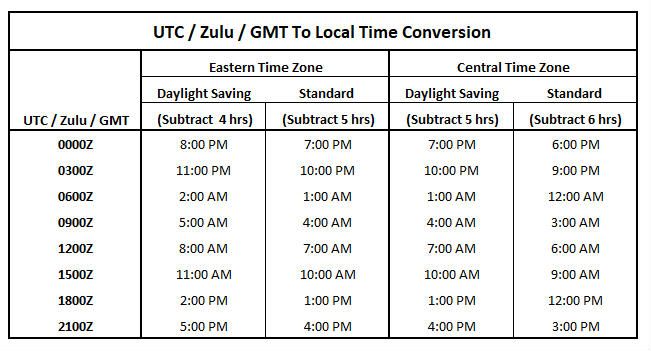
LakeErieWX Marine Weather © 2019WPC products, along with most of the weather forecasting materials available on the Internet or
from application providers, are based on Zulu (Z) or Universal Time Coordinated (UTC) time-
keeping systems. (The two systems are the same.) Converting from Zulu or UTC to Eastern Time
during the summer is straightforward – simply subtract four hours from Zulu/UTC. When
Daylight Saving Time is not in effect, you must subtract five hours from Zulu/UTC to convert to
local time. Below is the legend for the 12-hour surface forecast (above) which provides an
opportunity to review the Zulu/UTC conversion process and other nomenclature used to
describe the graphics.
The first line describes the parameters that are included on the chart. WPC Fronts indicates that
surface weather features and frontal boundaries are shown on the graphic. NDFD Weather
appears on forecasts for the first 2 ½ days and uses color shading to indicate the type of
precipitation and weather that is expected. The legend for the shading is located in the lower-
left corner of the chart. The term Issued in the third line provides the time and date the graphic
was published. In this example, the graphic was published at 1850Z on Thursday, February 22,
2018. The fourth line indicates when the forecast is Valid, which is the date and time for which
the forecast was prepared. The surface forecast shown above displays the surface weather
features as they were expected to be at 0600Z on Friday, February 23, 2018. (A handy time
conversion chart appears below.)
LakeErieWX Marine Weather © 2019Precipitation
The WPC also issues Quantitative Precipitation Forecast Graphics (QPF) (click here) which show
the amount of liquid precipitation anticipated across the country. This product covers the first
three days of the forecast period in 24-hour increments and combines days four through five
and six through seven into two separate 48-hour forecasts. The amount of precipitation that is
expected for a location can be determined by comparing the color shading over your area of
interest with the legend in the lower-left corner of the map.
LakeErieWX Marine Weather © 2019Thunderstorms
Storm Prediction Center
Thunderstorms, and the associated hazards of downburst winds, lightning, and locally higher
wave heights, are a common occurrence across the Great Lakes during the summer. Forecasting
the location, timing and type of severe weather that is expected to develop across the United
States is one of meteorology’s most challenging tasks – a task assigned to the staff of NOAA’s
Storm Prediction Center (SPC) in Norman, Oklahoma.
It is important to understand that the NWS defines a severe thunderstorm as one that is capable
of producing at least 1” diameter hail, or a wind gust of at least 50 knots, or a tornado. Although
frequent lightning is an obvious and extreme hazard to sailors, it is not a factor in meeting the
threshold of a severe thunderstorm. All types of thunderstorms are capable of reaching severe
status.
SPC Convective Outlooks
Each day, the SPC issues Convective Outlooks for days 1, 2, and 3, and a combined Outlook for
days 4 through 8 (click here). The Outlooks contain a graphic that identifies the areas of the
country where organized severe thunderstorm is expected, along with a narrative describing the
details of the risk.
The Convective Outlooks present the risk by category – Slight, Moderate and High – based upon
the statistical probability of severe weather occurring within 25 miles of any given point in the
highlighted area. A description of the risk categories used by the SPC can be found on its FAQ
page (click here)
Because the risk of severe weather affecting a specific location on any given day is very small,
even a Slight risk deserves a sailor’s respect, as it represents a significant increase in the
potential for severe weather. It should be noted that even thunderstorms that fail to meet the
NWS’s severe threshold often present a significant risk to mariners in the form of strong winds
and frequent lightning.
LakeErieWX Marine Weather © 2019In addition to Convective Outlooks, the SPC also publishes Thunderstorm Outlooks (click here)
which identify the regions at risk for both severe and non-severe thunderstorms and the
probability of development. In contrast to the one-day period covered by Convective Outlooks,
each Thunderstorm Outlook covers only a 4-hour period and are only issued for the current day.
Hazardous Weather Outlooks
In contrast to the Convective Outlooks from the SPC, Hazardous Weather Outlooks (HWO) are
issued in text form by each local office of the National Weather Service (NWS) and describe the
risk of severe weather for the general public. HWOs are issued each day and address the overall
probability, geographic coverage, storm type (single cell storms, squall line, etc.), and timing of
severe weather for the current day along with a combined summary of days 2 through 7.
While SPC Convective Outlooks cover the entire United States, Hazardous Weather Outlooks
focus exclusively on the County Warning Area (CWA) assigned to each NWS office. There are
two NWS offices with CWAs that cover a portion of Lake Huron – Detroit, MI and Gaylord, MI. In
order to assess the risk of severe weather where you intend to sail, you must consult the HWO
of the NWS office which has responsibility for that area of the lake. Click here for a map showing
NWS responsibilities for Lake Huron.
MARINE FORECASTS
Text Forecasts
The Detroit NWS office is responsible for issuing the off-shore (beyond 5 nautical miles) marine
forecasts for all of Lake Huron. Several times each day, NWS Detroit publishes a text version of
the marine forecast which begins with a synopsis of the current weather pattern and a forecast
covering the next several days. This synopsis is followed by a forecast of wind and wave
conditions covering a five-day period. Because conditions often vary dramatically across the
expanse of Lake Huron, the text wind and wave forecast focus on pre-determined forecast zones
that allow mariners to quickly obtain the forecast for their area. A chart showing these zones
may be found here.
LakeErieWX Marine Weather © 2019Graphic Forecast Products from the NWS
The NWS offices surrounding the Great Lakes cooperatively maintain an excellent website
devoted to marine weather forecasting (click here). While the home page provides forecasts for
the entire Great Lakes basin, the data for an individual lake can be accessed by clicking the
appropriate hyperlink along the left-hand column of the home page. The graphics, which are
designed for the recreational boating community, are easy to interpret and don’t require a
conversion from Zulu/UTC to local time.
The forecasts extend for 4 ½ days in three-hour increments for the following meteorological
parameters:
• Wave Height: in feet and shown using color-shading and values at selected stations.
• Wave Period: the time interval between each wave presented in seconds using color-
shading and numerical values at selected stations.
• Wind Speed & Direction: in knots, using standard wind barbs, color-shading and
numerical values at selected stations.
• Wind Gust: in knots, using color-shading and values at selected stations.
• Surface Water Temperature: in degrees Fahrenheit, presented using color-shading and
values at selected stations.
Other Graphic Marine Forecast Products
Gridded Binary files (GRIBs) pack a lot of information into a small file size and are a convenient
method of obtaining marine forecasts. Routing software, such as Expedition, integrate
navigation, yacht performance and GRIB weather data into a single race-management interface.
There are many sources of computer model wind and wave forecasting resources on the
Internet. While offering the advantages of higher resolution and shorter time intervals, these
products require conversion from Zulu/UTC to local time and are published without
modification by a meteorologist. Several of these products are available on the BYC Mack
Resource page (click here).
CONCLUSION
A Plan For The Mack
The month preceding the race is the perfect time to begin investigating and getting comfortable
with the resources presented in this article and on the Mac resource webpage (click here). There
is no better way to learn a new skill than practicing. On each Wednesday in the month preceding
the race, I encourage you to prepare a trial forecast for the upcoming weekend. In addition to
analyzing the graphics and making the necessary Zulu/UTC conversions, these practice forecasts
will allow you to experience how high and low pressure systems evolve and how the speed and
direction of the wind changes in response.
The accuracy of weather forecasts diminishes as the forecast period increases. For example, a
forecast valid in 48 hours is typically more accurate than one valid in 7 days. For this reason,
beginning the preparation of your official Mac forecast more than a week before the start isn’t
recommended.
LakeErieWX Marine Weather © 2019I typically start a daily review of the WPC surface forecasts and SPC Convective Outlooks a week
before an event and will often save the graphics in a folder to compare to later forecasts. This
allows me to track the movement of the large-scale weather systems across the country and
gauge the changes in the forecast from day to day. I typically begin a daily analysis of the wind
and wave forecasts on Monday or Tuesday for a weekend event.
The final forecast should be based upon the most current forecast data available and is usually
prepared the morning of the race. If you have been analyzing the forecast for the preceding
week and using the data to steadily home in on your strategy, the creation of your final forecast
shouldn’t be too time-consuming. And hopefully it won’t reveal any surprises.
Looking Ahead
Managing the forecast and keeping tabs on rapidly deteriorating conditions becomes far more
difficult once you are offshore. In part two of this series, we’ll investigate the resources available
after the starting gun has sounded.
About the Author
Mark Thornton began sailing on Lake Erie in 1994 and he currently owns Osprey, a 1985 C&C 35.
His interest in weather forecasting grew from his experiences racing and cruising on the lake. In
addition to sailing and weather forecasting, Mark maintains a website devoted to Great Lakes
meteorology (www.LakeErieWX.com) and enjoys publishing summaries of interesting Great Lake
weather events and teaching basic weather forecasting skills to sailors. He served as race
meteorologist Bell’s Beer Bayview Race to Mackinac since 2014 and is the past president of the
Cleveland chapter of the American Meteorological Society.
Questions regarding this article are encouraged and should be directed to
Mark@LakeErieWX.com.
LakeErieWX Marine Weather © 2019You can also read