Two local food distribution options in Iowa
←
→
Page content transcription
If your browser does not render page correctly, please read the page content below
Assessing fuel efficiency and CO2 emissions of
  two local food distribution options in Iowa

Rich Pirog, Associate Director, Leopold Center for Sustainable Agriculture
   Rebecca Rasmussen, Graduate Student, ISU College of Business

                          Contact: Rich Pirog
                 209 Curtiss Hall, Iowa State University
                       Ames, Iowa 50011-1050
                          rspirog@iastate.edu
                             515.294.1854

                               June 2008

                             On the web at:
       http://www.leopold.iastate.edu/pubs/staff/files/fuel0608.pdf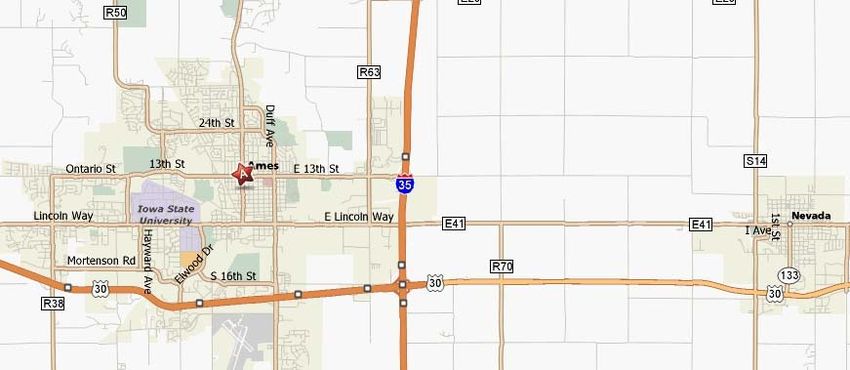
Table of Contents

                                                        Page
Abstract ………………………………………............................... 2

Introduction...………………………………………………………..                                                        3

Methodology ……………..…………………….............................                                      4

Discussion ………………………………………...........................                                         6

Conclusions ...............................................................................   9

Figure 1 ……………………………………………………………..                                                            6

Figure 2 ……………………………………………………………..                                                            6

Figure 3 ……………………………………………………………..                                                            7

Figure 4 ……………………………………………………………..                                                            8

Figure 5 ……………………………………………………………..                                                            8

Figure 6 …………..……………………………………….………..                                                          9

Special thanks go to Mary Adams for editing this paper and to Laura Miller
for web formatting. Cover photo was taken by Jerry DeWitt.

                                                                                                  1
Abstract
The purpose of this study was to determine which transportation option consumed less
fuel and emitted less CO2: farmer delivery or customer pick-up of food products for an
Iowa Community Supported Agriculture (CSA) enterprise.
In order to perform this study, the following information was obtained from an Iowa CSA
farmer: his exact route(s) of delivery (including customers’ addresses), what type of
vehicle he used for deliveries, and what location and time of day he would utilize as a
central pick-up point for customers if he chose not to deliver. With this information, the
farmer’s route mileage was calculated using Mapquest and data from the Bureau of
Transportation Statistics and the U. S. Environmental Protection Agency to determine
fuel usage and vehicle emissions. The fuel consumption and CO2 emissions were
determined for four different vehicle categories: Ford Ranger, Dodge Caravan, Toyota
Prius, and U. S. average fuel economy for passenger vehicles. Mileage, fuel
consumption, and CO2 emissions also were calculated for customer pick-up using the
same method, categories, and references as used for the delivery method.
Assumptions were made concerning the pick-up routes of customers depending upon
their place of employment and details provided by the CSA farmer.
Findings showed that the delivery option using a Toyota Prius resulted in 2.77 times
lower fuel usage and CO2 emissions than the consumer pick-up option using U. S.
average fuel economy for passenger vehicles. However, if all the CSA customers who
used vehicles for pick-up drove a Toyota Prius, farmer distribution would still be more
fuel efficient, but only 1.35 times more than that of customer pick-up.
2Introduction
Demand for local food continues to grow in Iowa and the rest of the United States.
According to market research publisher Packaged Facts, sales of locally grown foods in
the United States were expected to rise from approximately $4 billion in 2002 to $5
billion in 2007. Packaged Facts also estimated that locally grown foods could become a
$7 billion business by 2011. The U.S. Department of Agriculture documented more
than 4,500 farmers markets in 2007, up from 2,800 in 2000. Community Supported
Agriculture (CSA) enterprises were first formed in the United States in 1986; today there
are more than 1,300 operating.1
With the increased interest in and demand for locally produced food, consumers,
investors, the food industry and policymakers are asking more critical questions about
the benefits of local foods. Specifically, what benefits do local foods provide for?
• Health
• Food safety
• Environment
• Economy
• Community
Determining the benefits of local foods across these five areas is beyond the scope of
this paper. Readers interested in these five areas are encouraged to check the Farm
and Food Policy web site for a paper documenting local food benefits.2
Local foods have been documented to have lower food miles3, which are defined as the
distance a food product travels from the farm where it is produced to where it is
purchased and consumed. However, lower food miles do not necessarily translate into
a reduced environmental impact for local versus conventional food sources. When
focusing solely on food transport, mode of transport and fuel efficiency must be
considered. Gauging the environmental impacts of the entire food supply chain must
also include the effects of production, harvest, processing, storage, preparation
(cooking), and waste disposal.
Tomatoes grown in Spain and consumed in Sweden were shown to have lower CO2
emission equivalents than those produced in Denmark, the Netherlands and Sweden,
even though the transportation distances to Sweden were longer for the Spanish
tomatoes.4 The reason is that the Spanish tomatoes were raised on open fields while
the Swedish, Dutch, and Danish tomatoes were raised in greenhouses heated by fossil
fuels.
1
Robin Van En Center. 2008.
2
The case for local and regional food marketing. May 2007. Found on May 26, 2008 at:
http://www.farmandfoodproject.org/
3
Pirog, Richard, and Andrew Benjamin. 2003. Checking the Food Odometer: Comparing food miles for
local versus conventional sales to Iowa Institutions. Ames, IA: Leopold Center for Sustainable Agriculture,
Iowa State University. Found at: http://www.leopold.iastate.edu/pubs/staff/files/food_travel072103.pdf
4
Carlsson-Kanyama, Annika. 1998. “Food Consumption Patterns and their Influence on Climate
Change.” Ambio 27(7):528-34.
3Recent studies have questioned whether local food systems indeed have lower carbon
dioxide equivalents (emissions) than conventional systems.5 6 Research on local,
regional, and national distribution systems for fresh produce in Iowa showed that
regional distribution was more fuel efficient than local.7 Greater efficiency in distribution
systems may be one area where local food enterprises can increase profitability and
reduce both fuel use and CO2 emissions. This paper will address one aspect of
environmental impact of local food systems by determining whether farmer delivery or
customer pick-up for an Iowa Community Supported Agriculture (CSA) enterprise
consumes less fuel and emits less CO2.
Methodology
We examined the distribution patterns of a central Iowa CSA to answer the question: is
it more fuel efficient for the farmer or delivery person to distribute products to individual
homes, or for customers to pick up products at centralized locations? A central Iowa
CSA farmer provided information on his exact route(s) of delivery (including customers’
addresses) in Ames and Nevada, what type of vehicle he used for deliveries, and what
location and time of day he would utilize as a central pick-up point for customers if he
chose not to deliver.
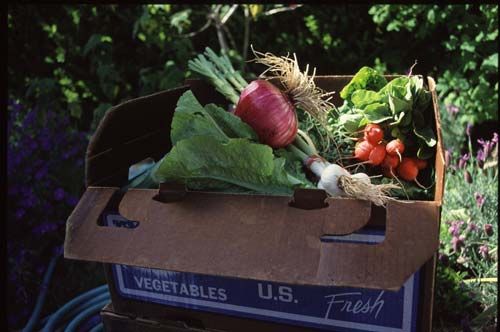
After receiving this information from the farmer, the mileage for his two routes (run on
Monday and Thursday) was determined using the addresses he provided and Mapquest
(http://www.mapquest.com). Generalized distribution routes are shown in Figures 1-2.
The amount (gallons) of fuel consumed for both of his routes was then calculated for
three different vehicle models (Ford Ranger, Dodge Caravan, and Toyota Prius) as well
as for the average fuel economy in the United States. The farmer used a Toyota Prius
to make his deliveries. The Ranger and Caravan were chosen to represent typical
vehicles used by a CSA farmer to transport food products. Fuel economy data was
obtained from http://www.fueleconomy.gov for the three 2007 vehicle models and the
U.S. average for passenger vehicles for 2006 was obtained from
http://www.bts.gov/publications/national_transportation_statistics/html/table_04_23.html
The fuel economy figures used in this study were: Ford Ranger – 21 miles per gallon,
Dodge Caravan – 20 miles per gallon, Toyota Prius – 46 miles per gallon, and average
U.S. fuel economy – 22.4 miles per gallon.
After the mileage for all vehicle four categories was computed, CO2 emissions (pounds)
for each category were calculated using the assumption that 19.4 pounds of CO2 are
5
Van Hauwermeiren, Annelies, H. Coene, G. Engelen, and E. Mathijs. 2007. Energy Lifecycle Inputs in
Food Systems: A Comparison of Local versus Mainstream Cases. Journal of Environmental Policy and
Planning. Volume 9:1; 31-51.
6
Weber, Christopher, and H. Scott Matthews. 2008. Food-miles and the relative climate impacts of food
choices in the United States. Environ Sci. Technol. Manuscript accepted March 14, 2008.
7
Pirog, Richard, et al. 2001. Food, Fuel, and Freeways: An Iowa perspective on how far food travels, fuel
usage, and greenhouse gas emissions. Ames, IA: Leopold Center for Sustainable Agriculture, Iowa State
University.
4emitted for each gallon of gasoline burned
(http://www.epa.gov/otaq/climate/420f05001.htm).
Using the same calculations as for the farmer’s delivery routes, the mileages and CO2
emissions were determined for customer pick-up. The central pick-up points provided
by the farmer were two locations in Ames, Iowa. Customers would be able to pick up
their orders between 5:00 and 6:00 p.m.
In order to determine how many miles the customers would travel to pick up their
orders, a few assumptions were made. First, a significant number of customers are
Iowa State University employees and are therefore assumed to be picking up their
orders on their commute home from work. Other customers were known to either walk
or bicycle to work and would pick up their CSA share on foot or on bicycles. The farmer
also provided information about customers who pick up at his farm. The remaining
customers were assumed to be traveling to the pick-up points from their home
addresses.
Mileage data for customer pick-up points was obtained using Mapquest
(http://www.mapquest.com). Customers traveling by foot or bicycle were assumed to
generate no mileage and therefore had no fuel use or emissions.
If the customer was an Iowa State University (ISU) employee, mileage for that customer
was calculated from the ISU address to the pick-up point address and then to the home
address as well as just from the ISU address to the home address. The latter mileage
was subtracted from the pick-up mileage to obtain the extra mileage traveled during
pick-up commutes. For those customers not traveling from ISU, a roundtrip mileage
figure was calculated from their home address to the pick-up point back to their home
address. The roundtrip mileage amounts were added to the “extra mileage” data to
obtain total miles traveled by customers for CSA pick-up. The same method,
categories, and references were used to calculate fuel consumption and CO2 emissions
for customer pick up as was used for the farmer’s delivery.
We assumed that in the home delivery scenario, the transport vehicle would be left
idling and that each stop would take one minute. In the case of the Toyota Prius, the
gas engine shuts off when the car stops and remains in park mode, and there is no fuel
use or CO2 emission. Information on fuel usage for small light trucks and vans while
idling is available at this site: (http://www.transportation.anl.gov/pdfs/TA/373.pdf).
We found that the fuel usage while idling is listed as 0.262 gallons/hour. Per minute, the
usage would be 0.262/60 = 0.0044 gallons. So, given that there are 46 stops for the
Monday and Thursday routes, total fuel use (while idling) for the Ford Ranger and
Dodge Caravan would be 0.202 gallons per week, which is added to the total fuel use
for each vehicle type.
5Figure 1. Generalized map of Monday CSA Route – Ames and Nevada, IA
Figure 2. Map of Thursday CSA Route – Ames, IA
Discussion
When comparing weekly farmer distribution using his vehicle (Toyota Prius) versus
customer pick up where U.S average fuel efficiency was used, farmer distribution
resulted in use of approximately 2.77 times less fuel and CO2 emissions than customer
pick up (Figure 3). If all the CSA customers who used vehicles for pick-up drove a
Toyota Prius, farmer distribution would still be more fuel efficient, but only 1.35 times
more than that of customer pick-up (Figure 4). In Figure 5 we compare distribution by
6the farmer using a Ford Ranger light truck versus U.S. average fuel economy for
customer pick-up. Distribution is only 1.20 times more efficient than pick-up if the
farmer were to use a Ford Ranger. In Figure 6 we compare distribution by the farmer
using a Dodge Caravan versus U.S. average fuel economy for customer pick up.
Distribution is only 1.15 times more efficient than pick-up if the farmer were to use a
Dodge Caravan.
Comparison of Gasoline Consumption and CO 2 Emissions between
CSA Delivery and CSA Pickup ‐ Monday and Thursday
100.0 5.0
90.0 4.5
80.0 4.0
Gasoline Consumption (Gallons)
70.0 3.5
CO 2 Emissions (lbs)
60.0 3.0 CO2 Emissions
50.0 2.5 Gasoline Consumption
40.0 2.0
30.0 1.5
20.0 1.0
10.0 0.5
0.0 0.0
Pickup Delivery Pickup Delivery
CSA Pickup Data based upon average fuel economy while
CSA Delivery Data based upon Toyota Prius fuel economy
Figure 3. Comparison of Gasoline Consumption and CO2 Emissions for Average Fuel Economy
for CSA Pickup and Toyota Prius Fuel Economy for CSA Delivery.
7Comparison of Gasoline Consumption and CO 2 Emissions between
CSA Delivery and CSA Pickup ‐ Monday and Thursday
50.0 2.5
45.0
40.0 2.0
35.0
Gasoline Consumption (Gallons)
CO 2 Emissions (lbs)
30.0 1.5
CO2 Emissions
25.0 Gasoline Consumption
20.0 1.0
15.0
10.0 0.5
5.0
0.0 0.0
Pickup Delivery Pickup Delivery
Both CSA Pickup Data and CSA Delivery Data
are based upon Toyota Prius fuel economy
Figure 4. Comparison of Gasoline Consumption and CO2 Emissions for Toyota Prius Fuel
Economy for both CSA Pickup and CSA Delivery.
Comparison of Gasoline Consumption and CO 2 Emissions between
CSA Delivery and CSA Pickup ‐ Monday and Thursday
100.0 5.0
90.0 4.5
80.0 4.0
Gasoline Consumption (Gallons)
70.0 3.5
CO 2 Emissions (lbs)
60.0 3.0
CO2 Emissions
50.0 2.5 Gasoline Consumption
40.0 2.0
30.0 1.5
20.0 1.0
10.0 0.5
0.0 0.0
Pickup Delivery Pickup Delivery
CSA Pickup Data based upon average fuel economy while
CSA Delivery Data based upon Ford Ranger fuel economy
Figure 5. Comparison of Gasoline Consumption and CO2 Emissions for Average Fuel Economy
for CSA Pickup and Ford Ranger Fuel Economy for CSA Delivery.
8Comparison of Gasoline Consumption and CO 2 Emissions between
CSA Delivery and CSA Pickup ‐ Monday and Thursday
100.0 5.0
90.0 4.5
80.0 4.0
70.0 3.5
Gasoline Consumption (Gallons)
CO 2 Emissions (lbs)
60.0 3.0
CO2 Emissions
50.0 2.5 Gasoline Consumption
40.0 2.0
30.0 1.5
20.0 1.0
10.0 0.5
0.0 0.0
Pickup Delivery Pickup Delivery
CSA Pickup Data based upon average fuel economy while
CSA Delivery Data based upon Dodge Caravan fuel economy
Figure 6. Comparison of Gasoline Consumption and CO2 Emissions for Average Fuel Economy
for CSA Pickup and Dodge Caravan Fuel Economy for CSA Delivery.
Conclusions
Results from this project inform the current discussion on improving the environmental
performance of local food systems. CSAs represent a unique partnership between farmers and
consumers (shareholders). With rising fuel and food prices and growing concern about climate
change and energy used to supply our food, consumers and CSA farmers have an opportunity
to reexamine the way their food is transported from the farm and received at its ultimate
distribution point. Increased efficiencies for delivery routes, optimized placement of pick-up
centers to minimize travel, combining and/or minimizing car trips to pick up or buy food, and use
of more fuel efficient vehicles or non-fossil fuel powered transportation (such as bicycles and
electric vehicles) are all options that farmers and their customers should consider to reduce the
environmental impact of this local food system.
These same options also are relevant to other food distribution systems such as farmers
markets, farm to school/college, and sales to local restaurants. Combining or minimizing car trips
to shop for food may be a powerful option that could be facilitated by cooperation across market
venues. For example, having farmers markets in the parking lots of food retail stores could
decrease consumer fuel use and CO2 emissions as well as increase overall sales for both the
direct market farmers and the food retailer.8
8
In 2006 national natural foods retailer Whole Foods began holding farmers markets in parking lots of
several of its stores.
9Total energy use in the food system is the sum of production, processing, storage, distribution,
and household/consumer energy. The role of consumers and the household in food system
energy usage is extremely critical and should not be overlooked. The consumer/household
preparation portion of total food system energy use is estimated at 31.7 percent.9
Farmer food delivery may reduce fuel use and CO2 emissions compared to customer pick-up in
a CSA enterprise, depending largely on the modes and fuel efficiencies of transportation used by
the farmer and his/her customers. Fuel use and CO2 emissions are important considerations
when examining the sustainability of a food system, but it is important that all aspects of food
chain sustainability be considered. For example, farmer food delivery (compared to customer
pick-up) may increase net profitability for the farmer. But delivery likely will decrease interaction
among CSA members and their farmer partners. The CSA farmer who participated in this study
offers several opportunities for shareholders to get together and experience the farm and the
benefits of CSA membership. Even so, the challenge to balance profit, environmental impact,
and social/community benefits in local food systems remains critical as new issues emerge that
affect our perceptions of sustainability. The advantage for local food systems lies in the strong
relationship between farmers and customers, which allows increased adaptability and flexibility
to change the system as emerging economic, environmental, and social/community issues are
encountered.
9
U.S. Food System Factsheets. University of Michigan. 2007. CSS01-06E07. Found at:
http://css.snre.umich.edu/css_doc/CSS01-06.pdf
10You can also read