Trends in Social Housing Supports: Housing Assistance Payment (HAP) - Public Policy.ie
←
→
Page content transcription
If your browser does not render page correctly, please read the page content below
Trends in Social Housing Supports: Housing Assistance
Payment (HAP)

Valesca Lima, UCD Geary Institute

Introduction

The Housing Assistance Payment (HAP) is a type of rental support provided by local authorities.
Under this scheme, local authorities make a monthly payment to landlords, while HAP tenants
pay weekly contributions towards the rent to the Local Authority based on the household
income (HAP, 2021). The HAP amount a family receives depends on household income and
composition, rental costs and dwelling characteristics including location. An applicant is
immediately eligible for HAP if the household is eligible for social housing. Considered as social
housing support, once a household has secured accommodation with HAP, they are removed
from the social housing waiting list, since their social housing need is deemed to be met.

The Rebuilding Ireland Action Plan, launched in 2016, places a heavy reliance on HAP as a key
component of social housing provision. In practice, the plan envisions that HAP will replace the
long-term use of ‘Rent Supplement’, a subsidy for people living in the private rental sector. Rent
Supplement is therefore being returned to its original function - to meet the short-term need
for housing support, for example, as a result of unemployment (Threshold and SVP, 2019).
Rebuilding Ireland focuses on the private rental market as the primary source for 85% of new
social housing tenancies, offering a leading role to the private sector in providing homes when
and where markets dictate - albeit regulated by planning restrictions (NERI, 2017).

However, the shortage of available suitable private rented accommodation, escalating rents, the
lack of social housing, and insecurity of tenure has raised concerns about HAP as a viable social
housing alternative (see NERI, 2017; Threshold and SVP, 2019; Hearne and Murphy, 2017; Lima,
2020; Norris and Hayden, 2018). People on HAP are already particularly vulnerable and
disadvantaged and the task of trying to source HAP accommodation in a tight and competitive
private rental market can often result in additional stress on these families (Citizen Information
Services, 2017). In what follows, this paper briefly presents the profile of HAP households in
Ireland, an overview of how HAP is implemented, the type and location of HAP properties, and
HAP expenditure from 2014 to 2019.

Profile of HAP Users
HAP is provided to a variety of households in Ireland, from single people households to larger
families with children. Data from the CSO (Central Statistics Office, 2020) shows that the majority
of households entering into a HAP tenancy in 2019 were single persons with one child (3,550)

_____________________________________________________________________________________________
UCD Geary Institute for Public Policy, University College Dublin, Belfield, Dublin 4, Ireland. Phone +353 1 716 4615
                          Website: https://www.ucd.ie/geary/ Email: geary@ucd.ie.
and single persons (3,180). Single HAP users accounted for 28% of all users in 2016. By 2018, this
number had increased to 61%. In 2019 (Q2), this group accounted for 23 % of all HAP tenancies.
Altogether, single, single +1, and single +2 households accounted for 59% of all active tenancies
in 2016 (See Table 1) (IGEES, 2019).
Table 1 - Table of Households Entering Into HAP – By Year and Family Type1
Single Couple Couple
Single 2 Single 3+ Couple 2
Year Single 1 Couple 1 3+ Other All
Children Children Children
Child Child Children
2014 140 70 50 30 20 30 50 30 20 420
2015 1,530 1040 630 360 190 370 540 470 220 5,350
2016 3,090 2230 1,430 770 410 780 1,120 970 460 11,250
2017 3,970 3,650 2,240 1,070 680 1,250 1,810 1,460 800 16,930
2018 3,550 3,790 2,090 990 690 1,420 1,740 1,300 1,000 16,550
2019 3,180 3,550 1,850 820 610 1,240 1,360 950 990 14,540
Source: CSO, 2020.
Before entering into HAP tenancies, over 75% of HAP tenants identified as living in private rental
accommodation, according to data obtained from the housing waiting lists from 2016 to 2019 -
see Figure 1 below (CSO, 2020). Of those, 38.3% were recipients of Rent Supplement and 37.4%
were paying rent without government supports. A little over 16% were living with parents,
relatives or friends before entering HAP.
Figure 1 – HAP Tenants Per Tenure Type Before Entering HAP (2014-2019)
Source: CSO, 2020
_____________________________________________________________________________________________
UCD Geary Institute for Public Policy, University College Dublin, Belfield, Dublin 4, Ireland. Phone +353 1 716 4615
Website: https://www.ucd.ie/geary/ Email: geary@ucd.ie.HAP allows recipients to work full time – as opposed to the Rent Supplement scheme which has
income limits. Regarding income, the median household annual earned income - the combined
household gross pay - for households entering HAP was €13,816 in 2018, an increase from 2015
when it was €8,982 (CSO, 2020). As a comparison, the nominal median equivalised disposable
income was €22,872 in 2018 (CSO, 2019). It suggests that people entering into the HAP scheme
- even when the income of all household members is combined – are at nominal risk of the
poverty threshold, which stood at €13,723 (i.e. 60% of the median) in 2018. CSO data also shows
that 19.3% of households who started receiving HAP in 2018 had an income of less than €5,000,
while just over half (53.1%) earned less than €15,000 and 3.7% earned over €40,000 (CSO, 2020).
In other words, 37% of HAP entrants in 2018 were at risk of poverty. Figure 2 illustrates the
income range when it comes to HAP.
In 2018, 20.5% of all working HAP tenants were employed in the wholesale and retail trade
sector (in comparison, 13.4% of all people at work in Ireland are in these sectors), followed by
the accommodation and food sectors with 16.6% and administrative and support services with
14.6%.
Figure 2 – Annual Household Earned Income Percentage Distribution in 2018
Source: CSO (2020).
HAP Implementation
_____________________________________________________________________________________________
UCD Geary Institute for Public Policy, University College Dublin, Belfield, Dublin 4, Ireland. Phone +353 1 716 4615
Website: https://www.ucd.ie/geary/ Email: geary@ucd.ie.HAP was created in 2014 and became nationally operational in 2017. By mid-2019, 62,739
tenancies had been created since the scheme began (AGEES, 2019). Seven local authorities
participated in the initial HAP roll out: Limerick, Cork, Kilkenny, Louth, Waterford, Monaghan
and South Dublin, with an initial 485 tenancies being supported and a €446,000 budget. By 2017,
all 31 local authorities were part of the HAP scheme. In the 2016-2018 period, 47,917 HAP
tenancies were established, accounting for 67% of all social housing tenancies provided during
this period. Figure 3 shows the distribution of tenancies among local authorities. More than half
of those tenancies (24,213) were concentrated in eight counties: Dublin City, Cork City, Cork
County, South County Dublin, Louth, Tipperary, Kildare and Meath (AGEES, 2019). Table 2 shows
an overview of how HAP was implemented up to 2019.
Table 2 – HAP Implementation (2014-2019)
New Tenancies
Social Housing HAP Annual
Year Target (Inc. Rent Supplement RS Transfers
Waiting List Budget
Transfers)
2014 n/a 485 n/a 89,662 446,000
2015 8,400 5,680 2,100 89,662 15,000,000
2016 12,000 12,075 3,661 91,600 47,000,000
2017 15,000 17,916 4,131 85,799 152,700,000
2018 17,000 17,926 3,329 71,858 301,336,000
2019 16,760 17,025 2,799 68,693 422,729,000
Source: DHPLG, 2020.
HAP recipients are removed from the social housing waiting list. Unlike a Local Authority
tenancy, when a HAP tenancy ends, it is the responsibility of the tenants to source new HAP
accommodation. HAP tenants can return to the Local Authority or an AHB (Approved Housing
Body) waiting list if they apply to the Local Authority’s transfer list. In 2019, 3,304 (23%) of
14,478 closed HAP tenancies exited the scheme by transferring to an Local Authority or AHB
managed homes (AGEES, 2019).
HAP tenancy agreements are similar to all private rental tenancies and therefore are subject to
the Residential Tenancies Act. The rent must be within the HAP rent limits for household size
and location. Local authorities have the power to concede a 20% discretionary uplift in HAP
payments. At the end of 2018, 26.6% of the total number of households supported by HAP were
being provided with the discretionary raise (Threshold and SVP, 2019). According to the
Department of Expenditure and Reform (AGEES, 2019), the exchequer expenditure on discretion
increased from €0.25m in 2016 to €3.6m for the first half of 2019.
_____________________________________________________________________________________________
UCD Geary Institute for Public Policy, University College Dublin, Belfield, Dublin 4, Ireland. Phone +353 1 716 4615
Website: https://www.ucd.ie/geary/ Email: geary@ucd.ie.Figure 3 – Cumulative HAP Tenancies Set-up by LA as % of Rebuilding Ireland Output (2016-2018)
Source: DHPLG, 2020 and AGEES, Department of Expenditure and Reform (2019).
HAP Landlords
According to CSO data, over 85% of HAP landlords had one HAP rental property in 2019 and
12.7% had two properties. For just over one in ten (10.2%) of residential landlords with one
property, it is a HAP property. Less than 0.3% of HAP landlords had more than 10 properties.
This data is illustrated in Figure 4. In 2014, 302 individual landlords received a HAP payment. By
2019 this number has increased 32019 (HAP SSC, 2021).
_____________________________________________________________________________________________
UCD Geary Institute for Public Policy, University College Dublin, Belfield, Dublin 4, Ireland. Phone +353 1 716 4615
Website: https://www.ucd.ie/geary/ Email: geary@ucd.ie.Figure 4 – Percentage Of Landlords By Number Of Properties In 2019
Source: CSO, 2020.
Corporate Landlords And HAP
Individual landlords make up the majority of HAP landlords, but the HAP scheme also includes
payments from council funds to private corporate landlords. Corporate landlords in the private
real estate market are in most case international investors, such as REITs (Real Estate Investment
Trusts) and pension funds, which were incorporated into government social housing policies
designed to attend the demand for social housing via the private market. This policy has faced
strong criticism by housing advocates (Hearne, 2021). The institutional private rental market has
been dominated by institutional landlords, which own a significant number of apartments and
homes in urban areas (Byrne, 2021). Ires REIT, for example, owns 24% of the 15,550 residential
units under institutional ownership in Ireland at the end of 2020 (CBRE, 2021). Some of those
units are rented under the HAP scheme.
Table 3 shows the number of individual and corporate landlords under HAP. Consistent with the
expansion of Rebuilding Ireland, the number of landlords accepting HAP has increased over the
years, with 32019 individual HAP landlords registered in 2019. The number of institutional
landlords has also increased, from 52 in in 2014, the beginning of the HAP scheme, to 2297 in
2019. In relation to HAP payments, from 2014 to 2019, corporate landlords received over €261
million from the State. In 2019, €128 million were paid to institutional landlords, the equivalent
of over 40% of the annual HAP budget for that year (see Table 2 above).
_____________________________________________________________________________________________
UCD Geary Institute for Public Policy, University College Dublin, Belfield, Dublin 4, Ireland. Phone +353 1 716 4615
Website: https://www.ucd.ie/geary/ Email: geary@ucd.ie.Table 3 - HAP Payments To Corporate Landlords (2014-2019)
Year 2014 2015 2016 2017 2018 2019
Corporate Landlords
that received a 52 472 937 1494 1968 2297
payment
Amount paid to
Corporate Landlord €77,000 €3M €16M €45M €85M €128M
(M = million)
Source: HAP SSC (2021).
HAP Budget Allocation and Expenditure
The HAP budget allocation from the Exchequer substantially increased over the 2015-2019
period. In 2015, this budget stood at €0.5m. In 2019, it was €422.7m (DHPLG, 2020). This
significant increase is due to the phased rollout of the HAP scheme as planned in the Rebuilding
Ireland plan, and also due to the increased demand for social housing. The AGEES report from
the Department of Expenditure and Reform assessed the level of Exchequer funding of the
scheme regionally, based on landlord payment data from the HAP Shared Services Centre (HAP
SSC), see Figure 5.
Figure 5 – Allocated HAP Budget (2015-2019)
Source: DHPLG, 2020.
HAP expenditure varies per county – see Figure 6 below. The highest expenditure on HAP
payments to landlords was by Dublin City Council €88m (14%), South County Dublin €79m (13%)
and Cork County (9%). The four Dublin LAs accounted for €196m (32%) of total national
expenditure on HAP from 2014 to 2018. €20m was the average expenditure across all 31 local
authorities.
_____________________________________________________________________________________________
UCD Geary Institute for Public Policy, University College Dublin, Belfield, Dublin 4, Ireland. Phone +353 1 716 4615
Website: https://www.ucd.ie/geary/ Email: geary@ucd.ie.Homeless HAP is a scheme that provides discretion to exceed the HAP rent limits for homeless
households, including people in homeless accommodation. Local authorities are authorised to
uplift HAP amounts by up to 20% and, in the Dublin region, this discretion can rise to 50%. From
2015 up to the end of Q4 2018, more than 4,900 households were supported by the Homeless
HAP scheme in the Dublin region; while nationally, over 6,100 households were being supported
under the scheme by the end of 2018 (AGEES, 2019).
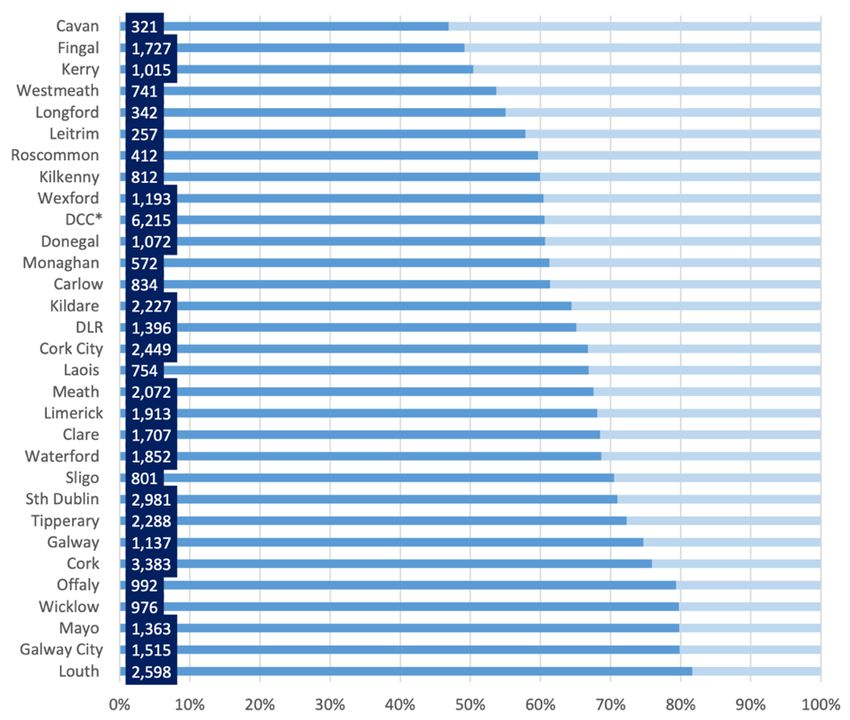
Figure 6 - Cumulative HAP Expenditure on Landlord Payments by LA (2014-2018)
Source: DHPLG/HAP Shared Services Centre/AGEES (2019)
Table 4 shows the average HAP monthly payment in all Local Authorities from 2016 to 2020.
The average HAP monthly payments values reflect the price of rent level across counties. Dublin
City, Dún Laoghaire-Rathdown and Fingal County have the higher average across all years, while
Donegal, Leitrim and Longford have one of the lowest averages. This trend also reflects the year-
on-year rent increases observed across counties over the past years, e.g., high rents in South
Dublin (see Residential Tenancy Boards reports, for instance). Although this average is useful to
understand trends, more comparators and cross-analyses are needed.
Table 4 - Average HAP Monthly Landlord Payment by Local Authority
Local Authority 2016 2017 2018 2019 2020
Carlow County Council €521.00 €542.00 €554.00 €561.00 €572.44
Cavan County Council €0 €430.00 €449.00 €464.00 €472.62
Clare County Council €409.00 €430.00 €459.00 €480.00 €495.95
Cork City Council €647.00 €722.00 €764.00 €802.00 €814.02
Cork County Council €629.00 €689.00 €727.00 €748.00 €756.04
Donegal County Council €363.00 €383.00 €392.00 €398.00 €400.17
Dublin City Council €1,244.00 €1,258.00 €1,290.00 €1,279.00 €1,294.78
_____________________________________________________________________________________________
UCD Geary Institute for Public Policy, University College Dublin, Belfield, Dublin 4, Ireland. Phone +353 1 716 4615
Website: https://www.ucd.ie/geary/ Email: geary@ucd.ie.Dun Laoghaire Rathdown
€1,085.00 €1,286.00 €1,343.00 €1,351.00 €1,371.58
County Council
Fingal County Council €1,333.00 €1,292.00 €1,325.00 €1,355.00 €1,369.04
Galway City Council €762.00 €784.00 €795.00 €817.00 €823.85
Galway County Council €612.00 €652.00 €701.00 €735.00 €761.50
Kerry County Council €477.00 €502.00 €512.00 €527.00 €531.01
Kildare County Council €885.00 €911.00 €919.00 €933.00 €951.21
Kilkenny County Council €527.00 €556.00 €576.00 €595.00 €611.85
Laois County Council €0 €535.00 €573.00 €599.00 €615.30
Leitrim County Council €450.00 €408.00 €414.00 €419.00 €420.01
Limerick City & County
€512.00 €552.00 €579.00 €598.00 €611.50
Council
Longford County Council €400.00 €397.00 €405.00 €415.00 €430.46
Louth County Council €622.00 €764.00 €833.00 €876.00 €896.71
Mayo County Council €468.00 €489.00 €501.00 €512.00 €520.32
Meath County Council €851.00 €904.00 €936.00 €957.00 €971.44
Monaghan County
€427.00 €457.00 €480.00 €514.00 €519.65
Council
Offaly County Council €453.00 €482.00 €508.00 €528.00 €537.04
Roscommon County
€0 €447.00 €454.00 €470.00 €488.11
Council
Sligo County Council €474.00 €488.00 €503.00 €514.00 €519.77
South Dublin County
€1,104.00 €1,147.00 €1,213.00 €1,279.00 €1,308.13
Council
Tipperary County Council €454.00 €471.00 €488.00 €500.00 €503.69
Waterford City & County
€465.00 €489.00 €509.00 €523.00 €535.28
Council
Westmeath County
€0 €540.00 €551.00 €565.00 €575.96
Council
Wexford County Council €0 €502.00 €520.00 €540.00 €549.18
Wicklow County Council €750.00 €975.00 €998.00 €1,012.00 €1,027.74
Avg LL Payment €636.00 €735.00 €801.00 €848.00 €880.37
Source: HAP SSC (2021). Data for 2014 and 2015 are not available.
HAP Exits
HAP tenancy agreements can cease due to either tenant or landlord reasons, and also for
compliance reasons. Data from the DHPLG (Department of Housing, Local Government and
Heritage) demonstrates a level of insecurity attached to HAP as a form of social housing. HAP
landlords are free to end their lease at the end of the contract, to sell the property or to put it
back on the rental market outside the HAP scheme. Even occurring on a modest scale, this can
have major implications for the affected families and the housing system in coping with an
additional source of homelessness (Hearne and Murphy, 2017).
_____________________________________________________________________________________________
UCD Geary Institute for Public Policy, University College Dublin, Belfield, Dublin 4, Ireland. Phone +353 1 716 4615
Website: https://www.ucd.ie/geary/ Email: geary@ucd.ie.Table 5 demonstrates that, in Q2 2019, 3,304 (22%) of 14,478 closed HAP tenancies exited the
scheme by transferring to a Local Authority or Approved Housing Body dwelling. 36% of exits
are tenant-led and 28% are landlord- led. The latter forces tenants to source alternative
accommodation in the private sector and they have to compete with other prospective tenants
who may be seen as more desirable by landlords (Threshold and SVP, 2019).
Table 5 - Self-Reported Reasons by Tenants for Cessation of a HAP Tenancy in Q2 2019
22% Transfers to Local Authority or AHB-owned dwelling.
Compliance-led exits including non-payment of rent, non-tax compliance by a landlord,
14%
anti-social behaviour, property standards and tenant giving notice.1
Landlord-led exits including notice to tenant, landlord selling a property, change in
28%
landlord agent payments, landlord in receivership and rent increase.
Tenant-led exits including voluntary exit, medical and education needs, deceased
36%
tenant, work location, family composition and differential rent increase.
Source: DHPLG, 2020.
HAP has become a central provider of housing support in the private rental sector. The
significant increase in expenditure in the period analysed in this paper signals the high levels of
investment made in this scheme. Several housing advocacy groups have pointed out HAP’s
design flaws, including HAP limits that are insufficient in meeting the needs of low-income
groups (e.g. HAP ‘top-ups’ by tenants) and they have called for better security of tenure for HAP
households.
References
Byrne, M (2021). Institutional investment in the private rental sector in the wake of the Covid-
19 pandemic: a review of international ‘grey literature’ and reflections on the Irish context.
Publicpolicy.ie, UCD Geary Institute. Dublin, Ireland.
CBRE (2021). Multifamily Sector Shakes Off Pandemic in Another Year of Robust Transactional
Activity. Ireland Residential Investment MarketView, Q4 2020. Dublin.
CSO, Central Statistics Office (2019) Survey on Income and Living Conditions (SILC) 2018. Dublin,
Ireland: Central Statistics Office. Available at: https://www.cso.ie/ (Accessed: 8 April 2021).
CSO, Central Statistics Office (2020) Social Housing in Ireland 2019 - Analysis of Housing
Assistance Payment (HAP) Scheme. Dublin, Ireland: Central Statistics Office. Available at:
https://www.cso.ie/ (Accessed: 8 April 2021).
DHPLG, Department of Housing Planning and Local Government (2020). HAP Scheme 2014-2020.
Dublin, Ireland: Department of Housing, Planning and Local Government. Available at:
https://data.gov.ie/dataset/hap-scheme-2014-2020/resource/31117181-ce87-4a1f-aa3e-
01f3ced698b3 (Accessed: 8 July 2020).
_____________________________________________________________________________________________
UCD Geary Institute for Public Policy, University College Dublin, Belfield, Dublin 4, Ireland. Phone +353 1 716 4615
Website: https://www.ucd.ie/geary/ Email: geary@ucd.ie.HAP SSC (2021). HAP Shared Services Centre. Limerick, Ireland. (Data provided via direct
requested from author).
Hearne, R. (2021). The Government does not want you to be able to afford to buy a home. The
Journal, Opinion Section. Available at: https://www.thejournal.ie/readme/ireland-investment-
housing-5428746-May2021/ (Accessed: 9 May 2020).
Hearne, R. and Murphy, M. (2017) Investing in the Right to a Home: Social Housing, HAPs and
HUBS. Maynooth University. Available at: https://www.maynoothuniversity.ie/social-sciences-
institute/news/new-research-report-investing-right-home-social-housing-haps-and-hubs
(Accessed: 17 June 2020).
Housing Assistance Payment (2021) What Is HAP?, Housing Assistance Payment. Available at:
http://hap.ie/whatishap/ (Accessed: 8 April 2021).
IGEES, Irish Government Economic and Evaluation Service (2019) Trends Analysis Housing
Assistance Payment (2014 - 2019). Dublin, Ireland: Department of Expenditure and Reform.
Lima, V. (2020) ‘Innovations in Affordable Housing in Dublin: Lessons from Not-for-Profit
Housing Developers’, in Partnerships for Livable Cities. London: Palgrave Macmillan, pp. 125–
145. Doi: 10.1007/978-3-030-40060-6.
NERI The Nevin Economic Research Institute (2017) Ireland’s Housing Emergency - Time for a
Game Changer. WP 2017/No 41. Dublin, Ireland: NERI - The Nevin Economic Research Institute.
Norris, M. and Hayden, A. (2018) The Future of Council Housing: An Analysis of the financial
sustainability of local authority provided social housing. Ireland: The Community Foundation of
Ireland, p. 101. Available at: https://www.communityfoundation.ie/images/uploads/research-
reports/The_Future_Of_Council_Housing_(Norris_Hayden).pdf.
Threshold and St Vincent de Paul (2019) The Housing Assistance Payment (HAP): making the
right impact? Dublin, Ireland: Threshold.
1
As noted in the AGEES report (2019, p.18), it is not clear why ‘tenant gave notice’ is categorised as a
compliance-based exit rather than a tenant-led exit.
_____________________________________________________________________________________________
UCD Geary Institute for Public Policy, University College Dublin, Belfield, Dublin 4, Ireland. Phone +353 1 716 4615
Website: https://www.ucd.ie/geary/ Email: geary@ucd.ie.You can also read