2ND QUARTER 2021

Distributor: Kinetics Funds Distributor LLC is not an affiliate of Kinetics Mutual Funds, Inc.
←
→
Page content transcription
If your browser does not render page correctly, please read the page content below
2ND QUARTER 2021 Distributor: Kinetics Funds Distributor LLC is not an affiliate of Kinetics Mutual Funds, Inc.
Introduction

   Decades of declining yields fueled gains in interest rate sensitive portfolios, but the trend
   may have ultimately robbed the portfolios of future returns.

                                                                                                                                             Dividend     Global
                                                                                                                                              Income      Bonds

                                                                                                                                                     Income
                                                                                                                                                    Portfolios
                                                                                                                                         MLPs                    REITs

                                                                                                                                                High     LT Corp.
                                                                                                                                                Yield     Bonds

The Alternative Income Fund seeks to generate consistent levels of income and aims to avoid significant
interest rate risks inherent in more traditional income oriented strategies.

There are risks associated with the strategy, including risks related to investments in options, fixed income securities and exchange traded funds. Past performance
is not a guarantee of future results. Barclays U.S. 1-3 Credit Index sourced from Bloomberg.                                                                             2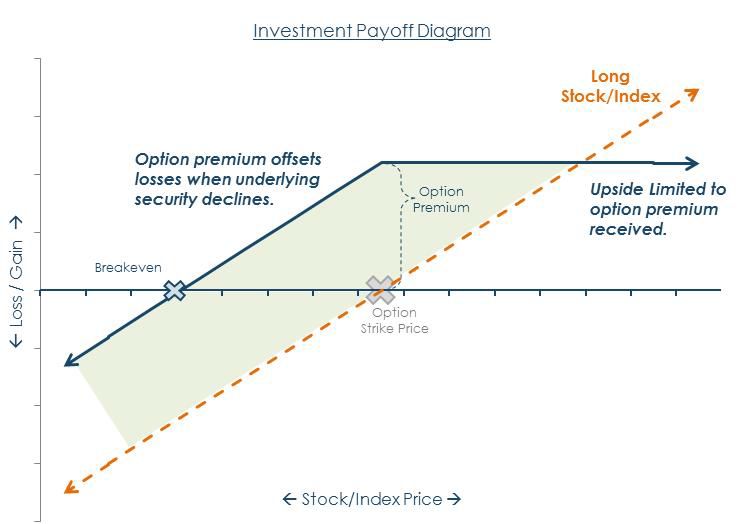
An Investment Solution

The Fund Seeks to Build a Bridge to...

                       Generate
                       Income

           The Alternative Income Fund
             Short-term interest + Option premium decay

        Reduce                                  Reduce
       Bond Risk                               Equity Risk

                                                                                   3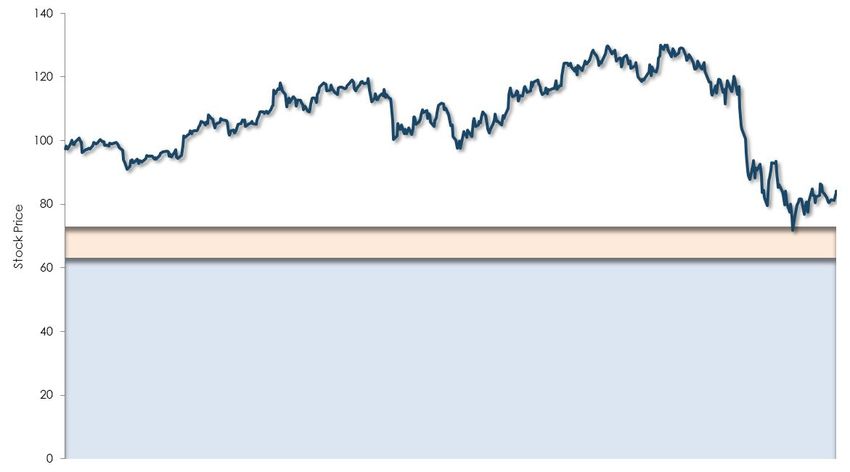
Fund Overview
            The Alternative Income Fund seeks to:                                                                                                           Bloomberg          Bloomberg
                                                                                                          As of
                                                                                                                                         KWINX             Barclays U.S.       Barclays 1-
                                                                                                      June 30, 2021                                         Aggregate         3Y U.S. Credit
                         Provide an alternative source of income that is
                         relatively uncorrelated to traditional income
                                                                                               The Fund’s investment strategy changed as of 12/31/2012.
                         oriented investments.

                                                                                               TOTAL RETURN (%)

                         Avoid the duration risk associated with longer-                       Year-to-Date                                -0.41               -1.60               0.21
                         term bond investments.
                                                                                               One Year                                    -0.04               -0.33               1.31

                                                                                               Three Year
                                                                                               (annualized)
                                                                                                                                            1.76                5.34               3.47
                         Limit equity exposure risk by writing out-of-the-
                                                                                               Five Year
                         money equity options.                                                 (annualized)
                                                                                                                                            1.91                3.03               2.42

                                                                                               Ten Year
                                                                                               (annualized)
                                                                                                                                            2.31                3.39               2.14

                                                                                               Since Inception
                         Opportunistically monetize volatility through the
                                                                                               (annualized)
                                                                                                                                            0.67                4.31               3.03
                         collection of put option premiums.
                                                                                               Since Inception
                                                                                               (cumulative)
                                                                                                                                            9.87               80.45               51.81

The past performance data quoted is as of June 30, 2021. Performance data quoted represents past performance and does not guarantee future results. Investment return and principal value
will vary, and shares may be worth more or less at redemption than at original purchase. Current performance may be lower or higher than the performance data quoted. Visit
www.kineticsfunds.com or call 800-930-3828 for more information, including the most recent month-end performance and expense figures and for a copy of the most recent Prospectus. You
should read the prospectus carefully before you invest. Performance does not reflect the deduction of a sales load or fee, which if included would reduce the performance quoted.

You will be charged a redemption fee equal to 2.00% of the net amount of the redemption if you redeem or exchange your shares 30 days or less after you purchase them. The Gross expense
ratios listed are as of 12/31/2020 as reported in the 4/30/2021 prospectus. The Fund’s adviser voluntarily agreed to waive management fees and reimburse fund expenses so that net annual fund
operating expenses do not exceed certain levels, not including acquired fund fees and expenses (AFFE), through May 1, 2022 and may be discontinued at any time by the Fund’s adviser after May
1, 2022. One-Year, Three-Year, Since Inception and Volatility figures are annualized, except where otherwise noted. The Alternative Income Fund No Load Class inception date is 6/29/2007;
however, the Fund began pursuing a new investment objective through a new investment strategy as of 12/31/2012. Figures include changes in principal value, reinvested dividends and capital
gains distributions. Certain statistics that rely on Fund data prior to January 1, 2013 will reflect the Fund’s prior investment objective and restrictions and may not be indicative of the Fund’s
current positioning or prospective results. See disclosure page for definitions.                                                                                                                4
Fund Class Information

                                                                                                                 Net Expense         Gross
                                            Class             Ticker            CUSIP           12b-1 Fee           Ratio         Expense Ratio

                                        FUND CLASS INFORMATION

                                        No Load             KWINX           494613722                 -            1.01%             2.22%

                                          Adv. A            KWIAX           494613714             0.50%            1.26%             2.47%

                                          Adv. C            KWICX           494613698             1.00%            1.76%             2.97%

                                            Inst.            KWIIX          494613680                 -            0.81%             2.17%

The gross expense ratios listed are as of 12/31/2020 as reported in the 4/30/2021 prospectus. The Fund’s adviser voluntarily agreed to waive management fees and reimburse fund expenses
so that net annual fund operating expenses do not exceed certain levels, not including acquired fund fees and expenses (AFFE), through May 1, 2022 and may be discontinued at any time by
the Fund’s adviser after May 1, 2022. Performance returns include the deduction of management and other operating expenses. Monthly Performance Chart begins with the first full month of
performance.
                                                                                                                                                                                            5
Cumulative Performance Chart (Daily)
                      Over time, the Fund seeks to produce a return pattern that is
                      relatively uncorrelated or potentially negatively correlated with                                          Annualized
                                                                                                                                                    Total
                                                                                                                                   Since                      Volatility
                      traditional bond indexes.                                                                                                    Return
                                                                                                                                January 2013

                                                                                                                                    KWINX          2.49%       1.99%
                                                                                                                                   (Net of Fees)

                                                                                                                                 Barclays U.S.
                                                                                                                                                   2.91%        3.12%
                                                                                                                                  Aggregate

                                                                                                                                 Barclays 1-3Y
                                                                                                                                                   2.08%        1.27%
                                                                                                                                  U.S. Credit

                                                                                                                                 Portfolio Allocation

                                                                                                                                    Cash & Cash
                                                                                                                                                            50.4%
                                                                                                                                     Equivalents

                                                                                                                                 Other Investments          49.6%

                                                                                                                                Notional % Options            0%

                                                                                                                                 Average Maturity           0.78 yrs

                                                                                                                                 Average Duration           0.75 yrs

The chart assumes a hypothetical $100 investment made in KWINX, the Barclays 1-3 Year U.S. Credit Index and the Barclays U.S. Aggregate Index on January 1, 2013. All
return data in the Cumulative Growth Chart is calculated using a daily net asset value (NAV). Index and Fund return data calculations include the reinvestment of income,
capital gains and dividends. The Fund performance includes fees and expenses, whereas returns for the indices do not. The inception date for KWINX is 6/29/2007; however,
the Fund began pursuing a new investment objective and implementing a new investment strategy as of 12/31/2012. Slide 4 contains standardized performance data. This
chart is not intended to imply any future performance.
                                                                                                                                                                       6
Fund Mechanics
Income Portfolio Option Strategy
Alternative Income Opportunistically invest in income Enhance income generation by
generating securities that offer attractive opportunistically implementing a
Fund risk-adjusted returns with an emphasis on diversified option strategy that seeks to
avoiding capital losses. monetize market volatility.
Limit duration risk Capture option premium decay
Diversify exposures Fundamental research
Allocate opportunistically Limit company exposures
Potential Investments KAI
Cash and Equivalents
Investment Grade Bonds
Diversified Income Funds(1)
There are risks associated with PutWrite Strategies and
BuyWrite Strategies. Among other factors, substantial risks,
including but not limited to the complete loss of capital, exist
as stock prices approach zero.
1 Including exchange traded funds and closed end funds subject The illustration above represents the payoff of the option and stock
to limits. strategies upon expiration or exercise. Values can vary over interim
periods.
7
Portfolio Construction

                                                          The Alternative Income Fund
                                                                Short-term interest + Option premium decay

  Diversified          Short           Investment         Short-Term      Generate                 Put Option          OTM1            Long-Term          Diversified
   Portfolio          Duration           Grade              Bonds
                                                                          Income                   Premiums            Options         Expirations         Portfolio

1 OTM refers to out-of-the-money options whose strikes prices are below their underlying stocks’ market prices. While the Fund seeks to generate income, there is

no guarantee that it will be successful in achieving its stated investment objective.                                                                                   8
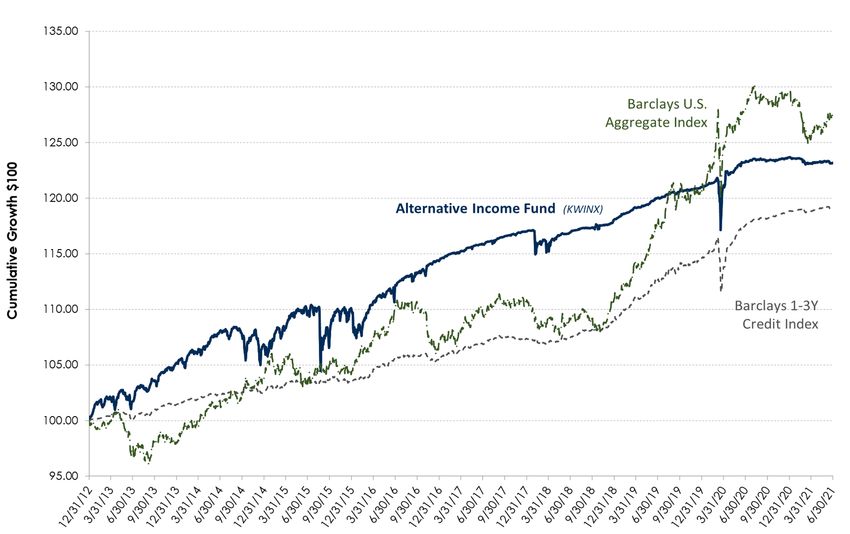
Bond Strategy: Overview

                                                                        High Yield
                        Risk / Liquidity                                                                     AVOID
                         Management1
                                                                                                           Speculative
                                                                                                           Credit Risk
                         Cash Balance
                           5 – 10%

                                                                        Investment Grade Corp.
                                                       Credit Quality
                      Liquid, Short-Term
                          Bond ETFs

                           Short-Term
                        1 – 3 Year Bonds
                                                                                                          Short-term
                          Investment                                                                                                          AVOID
                            Grade                                                                         High quality
                                                                                                                                           Interest Rate/
                                                                                                                                           Duration Risk
                                                                        Government/Agency

                           Company                                                                          Liquid
                           Exposure
                           ~ 1 - 2%

                             Limit
                          Exposure to
                         Financial Cos.

                                                                                                 1 Year       2 Years     3 Years     4 Years     5 Years   6+ Years

                                                                                                                         Years to Maturity
Chart for illustrative purposes only.
1 Details are provided as a general description of the Fund’s investment strategy. While the Fund seeks to avoid the types of risks noted above, there is no

guarantee it will be able to do so. Please refer to the Fund’s prospectus for more details on the Fund’s investment strategy, restrictions and risks.
                                                                                                                                                                       9
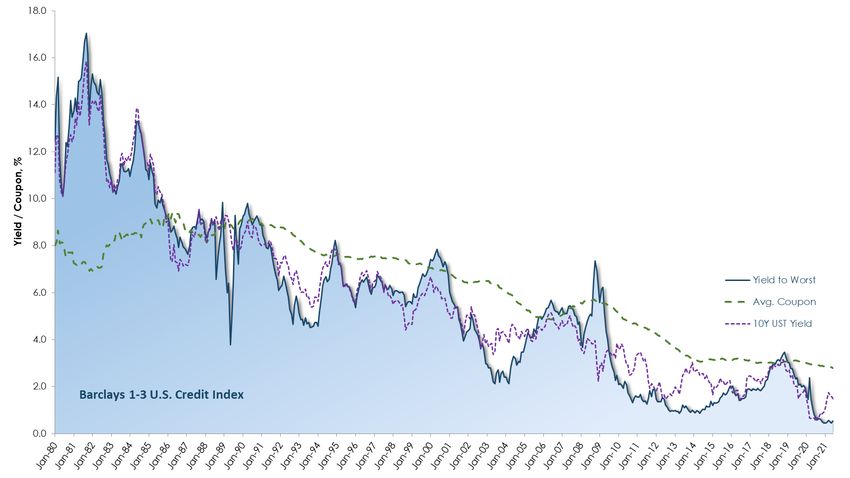
Option Premium Strategy: Overview
                                      Sell out-of-the-money                              Roll put options to realize                         Buy-to-cover options if
                                      put options to generate                            profit when option time                             stock approaches break-
                                      income.                                            values collapses due to                             even price to avoid
                                                                                         stock price appreciation.                           intrinsic losses.

                                                                                                   Buy-to-cover when stock price nears break-even price

                              Example: Option strike price 30% below stock price

                                                          Option Not.         Company                                Multiple
                                         Risk                                                 Out-the-money                          Buy-to-cover
                                                           Exposure           Exposure                              Expiration
                                      Management1                                                Options                              Discipline
                                                           85 – 100%            ~ 1%                                  Dates

The line chart above reflects the performance of a hypothetical stock during a hypothetical period of time. Categories A, B and C above the chart serve to illustrate how the Fund’s
option strategy may be utilized when stock prices fluctuate, such that at purchase date, (A), the Fund may sell out-of-the money put options to generate income. Once the stock
price has risen, (B) the Fund may roll put options in order to realize profit when the option time value collapses from the stock’s appreciation, and upon the stock price decreasing
(C), the Fund may buy-to-cover options if the stock approaches the option strike price, in an effort to avoid intrinsic losses. Of course, the Fund may be unable to accurately time
these events, and there is no guarantee the Fund will be successful in its endeavors. The strategy boxes under the chart above reflect some of the guidelines that the Fund attempts
to adhere to in carrying out its option strategy. In normal times, the Fund will seek to maintain an option notional exposure which is between 85-100% of the Fund’s net asset value
(“NAV”). Each option position is generally equal to approximately 1% of the Fund’s NAV. The Fund will utilize out-of-the money options with multiple differing expiration dates, and it
will attempt to instill a buy-to-cover discipline as stated above. Please refer to the last slide of this presentation for additional risks.                                          10
Appendix
Appendix
11Important Risk Disclosures
You should consider the investment objectives, risks, charges and expenses of the Fund carefully before investing. For a free copy of the fund’s prospectus, which contains this and other information, visit our
website at www.kineticsfunds.com or call 1-800-930-3828. You should read the prospectus carefully before you invest.
In April 2019, Kinetics Asset Management LLC (“KAM”) and Kinetics Advisers, LLC (“KA”) reorganized into Horizon Asset Management LLC (“HAM”), following which HAM was renamed Horizon Kinetics Asset
Management LLC (“HKAM”). KAM, HAM and KA were all wholly-owned subsidiaries of Horizon Kinetics LLC, and HKAM will remain a wholly-owned subsidiary. HKAM is the Fund’s adviser, previously, KAM was the
Fund’s adviser. Neither the portfolio managers of the Fund nor the Fund’s investment objective and investment strategy have changed.
Past performance does not guarantee future results. You will be charged a redemption fee equal to 2.00% of the net amount of the redemption if you redeem or exchange your shares less than 30 days after you
purchase them. As a non-diversified fund, the value of its shares may fluctuate more than shares invested in a broader range of companies.
Unlike other investment companies that directly acquire and manage their own portfolios of securities, the Alternative Income Fund pursues its investment objective by investing all of its investable assets in a
corresponding portfolio series of Kinetics Portfolio Trust. The Barclays U.S. Aggregate Bond Index is composed of the Barclays U.S. Government/Corporate Bond Index, Mortgage-Backed Securities Index, and Asset-
Backed Securities Index, and includes securities that are of investment grade quality or better, have at least one year to maturity, and have an outstanding par value of at least $100 million. The Barclays 1-3 U.S.
Credit Bond Index is composed of investment grade United States credit securities with a maturity between one and three years. Both Barclays indices are trademarks of Barclays Bank PLC. An investor cannot invest
directly in an index.
Annualized Volatility is the standard deviation of periodic returns multiplied by the square root of the number of periods in one year, e.g., the standard deviation of daily returns multiplied by the square root of 250
trading days per year.
This presentation is for informational purposes only, is not a solicitation to purchase shares, does not constitute investment or tax advice and is not a public or private offering or recommendation of any kind. This
document and its content are the property of HKAM, a wholly-owned subsidiary of Horizon Kinetics LLC, and cannot be reproduced or transmitted to any person in any form or by any means in whole or part without
prior written consent from HKAM. Mutual Funds, including Kinetics Alternative Income Fund, are subject to stock market risks and significant fluctuations in value. The Fund may invest in debt securities that are
traded below investment grade (junk) bonds. Generally, non-investment grade debt securities are subject to greater credit risk, price volatility and risk of loss than investment grade securities.
The Fund invests in options and bonds, which carry special risks further discussed in the Fund’s Prospectus. Any premium received from the written options may not be sufficient to offset any losses sustained from
the volatility of the underlying equity securities over time. The successful use of options depends in part on the ability of HKAM to manage future price fluctuations and the degree of correlation between the options
and securities markets. Options contain special risks including the imperfect correlation between the value of the option and the value of the underlying asset. Further, there are specific risks associated with
PutWrite and BuyWrite strategies, which include, among other things, the possibility of the complete loss of capital as stock prices approach zero. By writing put options on equity securities, the Fund may give up
the opportunity to benefit from potential increases in the value of the common stocks above the exercise price of the written put options, but the Fund will continue to bear the risk of declines in the value of its
common stock portfolio.
The Fund may also invest in exchange traded funds (“ETFs”), that seek to track a specified securities index or a basket of securities. As a shareholder in an ETF, the Fund will bear its pro rata portion of an ETFs
expenses, including advisory fees, in addition to its own expenses. The Fund may invest in the equity securities of small and medium size companies. Small and medium-size companies often have narrower markets
and more limited managerial and financial resources than do larger, more established companies. As a result, their performance can be more volatile and they face a greater risk of business failure, which could
increase the volatility of the Fund’s assets. The Fund may invest in foreign securities, which can carry higher returns but involve more risks than those associated with U.S. investments. Additional risks associated
with investments in foreign securities include currency fluctuations, political and economic instability, differences in financial reporting standards and less stringent regulation of securities markets.
The information contained herein should not be construed to be a recommendation to purchase or sell any particular security. It should not be assumed that any of the security transactions or holdings referenced
herein have been or will prove to be profitable or that future investment decisions will be profitable or will equal or exceed the past investment performance of the securities listed. Certain strategies/illustration
discussed in this presentation do not account for transaction costs, which may lower overall performance.
No part of this material may be: a) copied, photocopied, or duplicated in any form, by any means; or b) redistributed without the prior written consent of Horizon Kinetics LLC.
© 2021 Horizon Kinetics LLC ® All Rights Reserved
12You can also read