Full Year 2017 Results Presentation - Nostrum Oil & Gas Plc

Page created by Sherry Fields
 
CONTINUE READING
Full Year 2017 Results Presentation - Nostrum Oil & Gas Plc
Full Year 2017
Results Presentation
Full Year 2017 Results Presentation - Nostrum Oil & Gas Plc
FY 2017 Financial Results

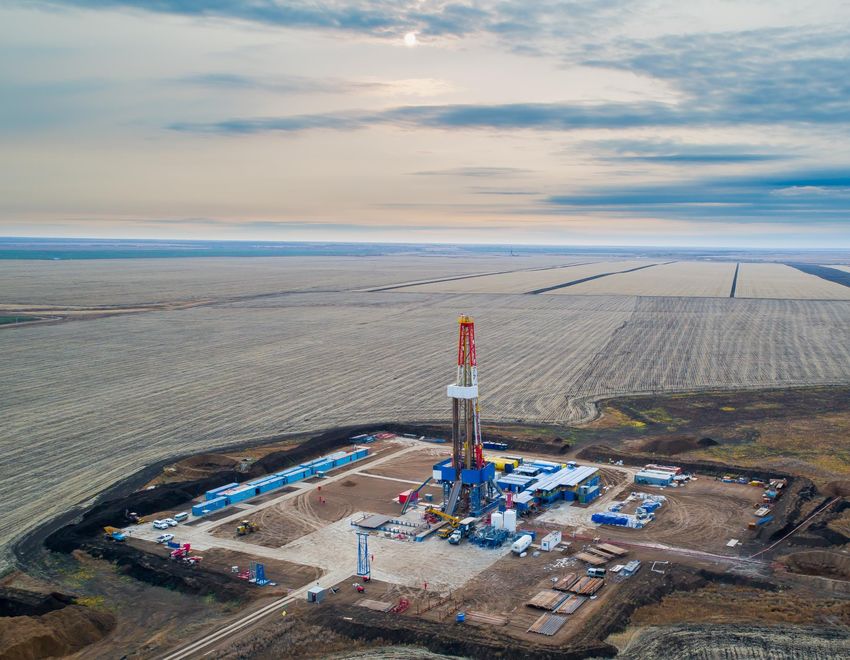
                                                                                      Establishing a solid platform for growth

    1 •             US$231.6 million EBITDA1 generated from 37,844 boepd of sales volumes at a 57.1% margin

    2 •             Cash & cash equivalents2 of US$127.0 million and net debt of US$960.9 million as at 31 December 2017

    3 •             9,000 boepd of 2018 production hedged at a price of US$60/bbl

    4 •             Further reduction in cost base with transportation costs reduced by 9.2% over the year3

    5 •            5% increase in Group 2P reserves to 488 mmboe (FY 2016: 466 mmboe)

    6 •            Successful refinancing of US$960 million of bond debt with no maturities until 2022

                                               Nostrum is well positioned to deliver its next phase of production growth

1 Profit Before Tax + Finance Costs + Foreign Exchange Loss / (Gain) + ESOP + Depreciation – Interest Income + Other Expenses / (Income) + cash received from hedge
2 Cash & cash equivalents including current investments but excluding restricted cash
3 On a per barrel of oil equivalent (boe) basis.

                                                                                                                                                                      2
Full Year 2017 Results Presentation - Nostrum Oil & Gas Plc
Sustainable strategy to grow production

1

                                      • Focus drilling on production wells in H1 2018
         Delivering near term
          production growth
                                      • Bring on a low pressure system in H1 2018 to extend life of older producing wells

2
                                      • Continue appraising the Chinarevskoye Field and converting probable reserves and resources into
     Appraising and developing          proved reserves
        near term projects
                                      • Develop the three additional licenses and bring them into production through our gas plants

3

     Exploration upside through
                                      • Seek to add reserves from surrounding licences that can fill our infrastructure beyond 2021
                M&A

4

          Linking corporate
                                      • Development of a comprehensive CSR roadmap focused on employee security and welfare, investment
     responsibility directly to the
                                        in community building, and environmental protection and reporting.
       growth of the Company

                                                                                                                                          3
Full Year 2017 Results Presentation - Nostrum Oil & Gas Plc
Snapshot of key figures from 2017

     Sales volumes                                                                                    Opex / boe1,2

             50,000                                                                                                      5.0
                                   38,576                              39,046               37,844                                4.4
             40,000                                                                                                                                                4.1
                                                                                                                         4.0                           3.7

                                                                                                       US$ / boe
             30,000
    boepd

             20,000
                                                                                                                         3.0
             10,000

                   -                                                                                                     2.0
                                  FY 2015                             FY 2016               FY 2017                             FY 2015            FY 2016       FY 2017

     Transport costs / boe2                                                                           Gross debt / net debt

                 7.0                  6.6                                                                              10.0x
                                                                                                                               Gross Debt / LTM EBITDA
                                                                                                                        8.0x   Net Debt / LTM EBITDA

                                                                                                      Leverage ratio
                 6.0
                                                                           5.3
                                                                                                                        6.0x
     US$ / boe

                                                                                              4.8                                                 4.9x          4.7x
                 5.0                                                                                                           4.1x                      4.4x          4.1x
                                                                                                                        4.0x          3.4x
                 4.0
                                                                                                                        2.0x

                 3.0                                                                                                       -
                                  FY 2015                             FY 2016               FY 2017                            FY 2015             FY 2016      FY 2017

1   Opex is defined as COGS less depreciation less royalties less government profit share
2   Per barrel equivalent metrics based on sales volume

                                                                                                                                                                              4
Capital discipline

    Balance sheet                                                                         Hedging programme

     • US$127.0 million cash and cash equivalents1 as at 31 December                      • 9,000 boepd of 2018 production hedged at a floor price of
       2017.                                                                                US$60/bbl.

     • Net debt of US$ 960.9 million as at 31 December 2017.                                ➢ US$60/bbl put option was funded through a call spread with
                                                                                              average strike prices of US$64.95/bbl and US$69.95/bbl.
     • Successfully refinanced remaining 2019 debt in February 2018.

     • No debt maturities until 2022.

    Cash flow generation                                                                  Scalable drilling

     • Existing financing, hedging arrangements and cash flow from                        • Drilling capex scalable up or down depending on prevailing oil
       operations ensures GTU III is fully funded under any oil price                       prices.
       scenario.
                                                                                            ➢ US$45 million of drilling capex committed for 2018.
     • Following the completion of GTU3 the business will be able to
       generate free cash flow while growing its production in an oil price                 ➢ US$45 million of discretionary drilling capex for 2018.
       environment above US$50/bbl.

1   Cash & cash equivalents including current investments but excluding restricted cash

                                                                                                                                                             5
2018 Cash Flow Bridge

                                                                                        US$32m      US$64m

                                                  US$151m

                                                                                                                    US$41m

                                                                                                                                   US$90m

            US$127m
                                                                                                                                                  US$115m

     2017 Closing Cash                       2018 Operating                   2018 Cash received   2018 GTU III   2018 Finance   Drilling Capex       2018
                                               Cash Flow                         from hedge        Capex (net)     Costs (net)                    Closing Cash
                                             (@ US$50 / bbl)                   (@ US$50 / bbl)¹

                                                  Fully financed to complete GTU III and fund the 2018 drilling program

¹ Hedge income taxed at non-contractual rate of 20.0% included in Operating Cash Flow

                                                                                                                                                                 6
2018 Ryder Scott Reserves Report

       Chinarevskoye - Proven              Chinarevskoye - Probable    Trident - Probable
                                                                                            • 358mmboe 2P reserves at the Chinarevskoye field

                                                                  488mmboe                    ➢ Proven – 124mmboe
               466mmboe
                                                                                              ➢ Probable – 234mmboe

               87mmboe                                                131mmboe              • 22.9mmboe decrease in proven reserves due to:

                                                                                              ➢ 14mmboe of production during 2017; and

                                                                                              ➢ The loss of two producing wells in the Biyski gas condensate
                                                                                                reservoir
              233mmboe
                                                                                            • 131mmboe of 2P reserves at the Trident fields as at 1 January 2018
                                                                      234mmboe
                                                                                              ➢ + 44mmboe in 2P reserves following the successful appraisal of
                                                                                                the ROS-3 well

                                                                                            • Contingent resources – 235mmboe

                                                                                              ➢ 184.2mmboe at the Chinarevskoye field; and
              147mmboe
                                                                      124mmboe
                                                                                              ➢ 50.7mmboe at the Trident fields

                   2016                                                 2017
                                                                                            • Remaining reserve life of +10 years with GTU III running at full
                                                                                              capacity

                                          Nostrum has a substantial reserve base to feed its processing facilities

Source: Ryder Scott 2018 Reserve Report

                                                                                                                                                                   7
2017 Financial Results
Financial Overview – FY 2017

    US$m                                                                                                                                                                FY 2016    FY 2017
    Revenue                                                                                                                                                               348.0      405.5
    EBITDA1                                                                                                                                                               194.0      231.6
    Profit before tax                                                                                                                                                     (65.5)      26.0
        Current income tax expense                                                                                                                                        (20.5)     (13.9)
        Deferred income tax expense                                                                                                                                         3.0      (36.0)
    Net income                                                                                                                                                            (83.0)     (23.9)
    Earnings per share (USc)2                                                                                                                                             (45.0)     (13.0)
    Capital expenditure3                                                                                                                                                 (200.3)    (191.5)
    Net cash flows from operating activities                                                                                                                              202.1      182.8

    US$m                                                                                                                                                                FY 2016    FY 2017
    Gross debt                                                                                                                                                            959.1    1,087.9
                                                  4
    Cash & cash equivalents                                                                                                                                               101.1      127.0
    Net debt                                                                                                                                                              857.9      960.9
                                              1
    Net debt / LTM EBITDA                                                                                                                                                  4.4x       4.1x

1   Profit Before Tax + Finance Costs + Foreign Exchange Loss / (Gain) + ESOP + Depreciation – Interest Income + Other Expenses / (Income) + cash received from hedge
2   Based on a weighted average no. of shares as at Q4 2017 of 185.1m and Q4 2016 of 184.9m
3   Purchases (net of sales) of property, plant and equipment + purchase of exploration and evaluation assets + acquisitions
4
                                                                                                                                                                                          9
    Cash & cash equivalents including current investments but excluding restricted cash
Balance Sheet Summary

    Highlights                                                                                                      Gross debt / net debt

                                                                                                                                     10.0x
     • US$127.0m cash & equivalents1                                                                                                            Gross Debt / LTM EBITDA
                                                                                                                                      8.0x      Net Debt / LTM EBITDA

                                                                                                                    Leverage ratio
     • Successful refinancing of US$960 million of bond debt with no
       maturities until 20222                                                                                                         6.0x                             4.9x                 4.7x
                                                                                                                                                4.1x                          4.4x                  4.1x
                                                                                                                                      4.0x              3.4x
     • 9,000 boepd hedged at US$60/bbl floor until the end 2018
                                                                                                                                      2.0x

                                                                                                                                         -
                                                                                                                                                    FY 2015             FY 2016             FY 2017

    Net Debt at 31 December 2017 – US$960.9m                                                                        Maturity profile of current debt

    US$m                                                                                                 FY 2017                     1,200           Retired Notes    2022 Notes     2025 Notes
    Total debt, including:                                                                               1,087.9                     1,000

         2012 Notes (7.125% coupon)                                                                        167.7                      800

                                                                                                                       US$m
         2014 Notes (6.375% coupon)                                                                        187.9                      600
         2022 Notes (8.000% coupon)                                                                        731.5                      400
         Finance lease liability                                                                             0.8                      200
    Cash & cash             equivalents1                                                                  (127.0)                        -
    Net Debt                                                                                               960.9                             2018     2019     2020   2021    2022   2023    2024     2025

1 Cash   & cash equivalents including current investments but excluding restricted cash
2   US$725m bond issued during FY 2017 financial year and US$400m issued after the balance sheet date.

                                                                                                                                                                                                             10
Supporting materials
Consolidated Statement of Financial Position

                                                                                                 31 December 2016
                In thousands of US dollars                           Notes   31 December 2017           Restated*

                NON-CURRENT ASSETS
                Exploration and evaluation assets                      6               47,828              44,271
                Goodwill                                               5               32,425              32,425
                Property, plant and equipment                          7            1,941,894           1,808,524
                Restricted cash                                       12                6,663               5,981
                Advances for non-current assets                        8               14,598              28,676
                Total Non-current assets                                            2,043,408           1,919,877
                CURRENT ASSETS
                Inventories                                            9               29,746              28,326
                Trade receivables                                     10               34,520              29,052
                Prepayments and other current assets                  11               27,103              21,171
                Derivative financial instruments                      29                    –               6,658
                Income tax prepayment                                                   3,380               1,062
                Cash and cash equivalents                             12              126,951             101,134
                Total Current assets                                                  221,700             187,403
                TOTAL ASSETS                                                        2,265,108           2,107,280

                SHARE CAPITAL AND RESERVES                            13
                Share capital                                                            3,203               3,203
                Treasury capital                                                       (1,660)             (1,846)
                Retained earnings and reserves                                        668,010             690,455
                Total Share capital and reserves                                      669,553             691,812
                NON-CURRENT LIABILITIES
                Long-term borrowings                                  15            1,056,541             943,534
                Abandonment and site restoration provision            16               23,590              19,635
                Due to Government of Kazakhstan                       17                5,466               5,631
                Deferred tax liability                                28              381,595             345,607
                Total Non-current liabilities                                       1,467,192           1,314,407
                CURRENT LIABILITIES
                Current portion of long-term borrowings               15               31,337              15,518
                Employee share option plan liability                  26                2,086               4,339
                Trade payables                                        18               56,855              43,320
                Advances received                                                       1,279               1,810
                Income tax payable                                                        499               1,124
                Current portion of due to Government of Kazakhstan    17                1,031               1,289
                Other current liabilities                             19               35,276              33,661
                Total Current liabilities                                             128,363             101,061
                TOTAL EQUITY AND LIABILITIES                                        2,265,108           2,107,280

                                                                                                                     12
Consolidated Statement of Comprehensive Income

                                                                                                                 For the year ended 31 December
                                                                                                                                          2016
               In thousands of US dollars                                                         Notes         2017                  Restated*

               Revenue
               Revenue from export sales                                                                     262,767                   244,586
               Revenue from domestic sales                                                                   142,766                   103,397
                                                                                                   20        405,533                   347,983

               Cost of sales                                                                       21       (177,246)                 (182,180)
               Gross profit                                                                                  228,287                   165,803

               General and administrative expenses                                                 22        (33,303)                  (34,758)
               Selling and transportation expenses                                                 23        (66,441)                  (75,681)
               Taxes other than income tax                                                         24        (19,967)                  (20,175)
               Finance costs                                                                       25        (59,752)                  (41,709)

               Employee share options - fair value adjustment                                      26           2,099                       99
               Foreign exchange loss, net                                                                       (688)                     (390)
               Loss on derivative financial instruments                                            29         (6,658)                  (63,244)
               Interest income                                                                                   374                       461
               Other income                                                                                     4,071                     2,191
               Other expenses                                                                      27        (22,055)                     1,864
               Profit/(loss) before income tax                                                                25,967                   (65,539)

               Current income tax expense                                                                    (13,883)                  (20,502)
               Deferred income tax (expense) / benefit                                                       (35,966)                     3,021
               Income tax expense                                                                  28        (49,849)                  (17,481)

               Loss for the year                                                                             (23,882)                  (83,020)

               Other comprehensive income that could be reclassified to the income statement in
               subsequent periods
               Currency translation difference                                                                   825                       (70)
               Other comprehensive income/(loss)                                                                 825                       (70)

               Total comprehensive loss for the year                                                         (23,057)                  (83,090)

               Loss for the year attributable to the shareholders (in thousands of US dollars)               (23,882)                  (83,020)
               Weighted average number of shares                                                          185,068,917               184,866,287

               Basic and diluted earnings per share (in US dollars)                                            (0.13)                    (0.45)

                                                                                                                                                  13
Consolidated Statement of Cash Flows

                                                                                          For the year ended 31 December
                                                                                                                     2016
               In thousands of US dollars                                        Notes       2017                Restated*

               Cash flow from operating activities:
               Profit/(loss) before income tax                                             25,967                 (65,539)
               Adjustments for:
               Depreciation, depletion and amortisation                          21,22    122,986                 131,585
               Finance costs                                                      25       59,752                  40,859
               Employee share option plan fair value adjustment                            (2,099)                    (99)
               Interest income                                                               (374)                   (461)
               Net foreign exchange differences                                            (1,541)                 (1,329)
               Loss on disposal of property, plant and equipment                             1,285                      95
               Proceeds from derivative financial instruments                     29             –                 27,198
               Loss on derivative financial instruments                           29         6,658                 63,244
               Provision for doubtful debts                                                  1,756                       –
               Accrued expenses                                                              3,046                     243
               Operating profit before working capital changes                            217,436                 195,796
               Changes in working capital:
               Change in inventories                                                         1,561                     708
               Change in trade receivables                                                 (5,468)                   2,285
               Change in prepayments and other current assets                              (5,733)                  22,204
               Change in trade payables                                                    (4,555)                   2,028
               Change in advances received                                                   (531)                   1,566
               Change in due to Government of Kazakhstan                                   (1,289)                   (773)
               Change in other current liabilities                                         (1,597)                (12,251)
               Payments under Employee share option plan                                   (1,162)                       –
               Cash generated from operations                                             198,662                 211,563
               Income tax paid                                                            (15,874)                 (9,457)
               Net cash flows from operating activities                                   182,788                 202,106

               Cash flow from investing activities:
               Interest received                                                               374                     461
               Purchase of property, plant and equipment                                 (188,060)               (192,826)
               Exploration and evaluation works                                   6        (3,482)                 (7,475)
               Loans granted                                                               (1,223)                   (496)
               Net cash used in investing activities                                     (192,391)               (200,336)

               Cash flow from financing activities:
               Finance costs paid                                                         (57,013)                (65,400)
               Issue of notes                                                              725,000                       –
               Repayment of notes                                                        (606,808)                       –
               Fees and premium paid for early repayment and on arrangement of
               notes                                                                      (27,084)                       –
               Treasury shares sold                                                          1,853                     352
               Payment of finance lease liabilities                                          (676)                   (669)
               Transfer to restricted cash                                                   (683)                   (606)
               Net cash from/(used in) financing activities                                 34,589                (66,323)

               Effects of exchange rate changes on cash and cash equivalents                  831                     127

               Net increase/(decrease) in cash and cash equivalents                        25,817                 (64,426)
               Cash and cash equivalents at the beginning of the year             12      101,134                 165,560
               Cash and cash equivalents at the end of the year                   12      126,951                 101,134

                                                                                                                             14
Disclaimer

THIS PRESENTATION IS NOT AN OFFER OR SOLICITATION OF AN OFFER TO BUY OR SELL SECURITIES. IT IS SOLELY FOR USE AT AN INVESTOR PRESENTATION AND IS PROVIDED AS
INFORMATION ONLY. THIS PRESENTATION DOES NOT CONTAIN ALL OF THE INFORMATION THAT IS MATERIAL TO AN INVESTOR. BY ATTENDING THE PRESENTATION OR BY READING
THE PRESENTATION SLIDES YOU ACKNOWLEDGE AND AGREE TO THE FOLLOWING:

This document and its contents are confidential and proprietary to Nostrum Oil & Gas PLC. (the “Company”) and may not be reproduced, redistributed, published or passed on (or the contents otherwise
divulged) to any other person, directly or indirectly, in whole or in part, for any purpose. If this presentation has been received in error then it must be returned immediately to the Company. This
presentation is not directed to, or intended for distribution to or use by, any person or entity that is a citizen or resident of, or located in, any locality, state, country or other jurisdiction where such
distribution or use would be contrary to law or regulation or which would require any registration or licensing within such jurisdiction. This presentation does not constitute or form part of, and should not
be construed as, an offer, invitation, recommendation to purchase, sell or subscribe for any securities of the Company in any jurisdiction or solicitation of any offer to purchase, sell or subscribe for any
securities of the Company in any jurisdiction and neither the issue of the information nor anything contained herein shall form the basis of or be relied upon in connection with any contract or commitment
whatsoever, or act as any inducement to enter into, any investment activity.

This presentation has been prepared by the Company, and no other party accepts any responsibility whatsoever, or makes any representation or warranty, express or implied, for the contents of this
presentation, including its accuracy, completeness or verification or for any other statement made or purported to be made in connection with the Company and nothing in this document or at this
presentation shall be relied upon as a promise or representation in this respect, whether as to the past or the future.
This presentation contains forward-looking statements. All statements other than statements of historical fact included in this presentation are forward-looking statements. Forward-looking statements
give the Company’s current expectations and projections relating to its financial condition, results of operations, plans, objectives, future performance and business. These statements may include,
without limitation, any statements preceded by, followed by or including words such as “target,” “believe,” “expect,” “aim,” “intend,” “may,” “anticipate,” “estimate,” “plan,” “project,” “will,” “can have,” “likely,”
“should,” “would,” “could” and other words and terms of similar meaning or the negative thereof. Such forward-looking statements involve known and unknown risks, uncertainties and other important
factors beyond the Company’s control that could cause the Company’s actual results, performance or achievements to be materially different from the expected results, performance or achievements
expressed or implied by such forward-looking statements. Such forward-looking statements are based on numerous assumptions regarding the Company’s present and future business strategies and the
environment in which it will operate in the future. Forward-looking statements are not guarantees of future performance and actual results, performance, achievements, industry or economic results may
differ materially from those described in, or suggested by, this presentation.

No representation, warranty or undertaking, express or implied, is made as to, and no reliance should be placed on, the fairness, accuracy, completeness or correctness of this presentation or the
opinions contained therein. This presentation has not been independently verified and will not be updated. The information and opinions contained in this document are provided as at the date of this
presentation and are subject to change without notice. The Company does not intend to, nor does it have any duty or obligation to supplement, amend, update or revise any of the forward-looking
statements contained in this presentation.
Market data used in this presentation not attributed to a specific source are estimates of the Company and has not been independently verified.
The Company does not accept any liability for any loss howsoever arising, directly or indirectly, from this presentation or its contents.

                                                                                                                                                                                                                       14
You can also read