Highlights MARCH 2021 - Bank of ...
←
→
Page content transcription
If your browser does not render page correctly, please read the page content below
Highlights MARCH 2021
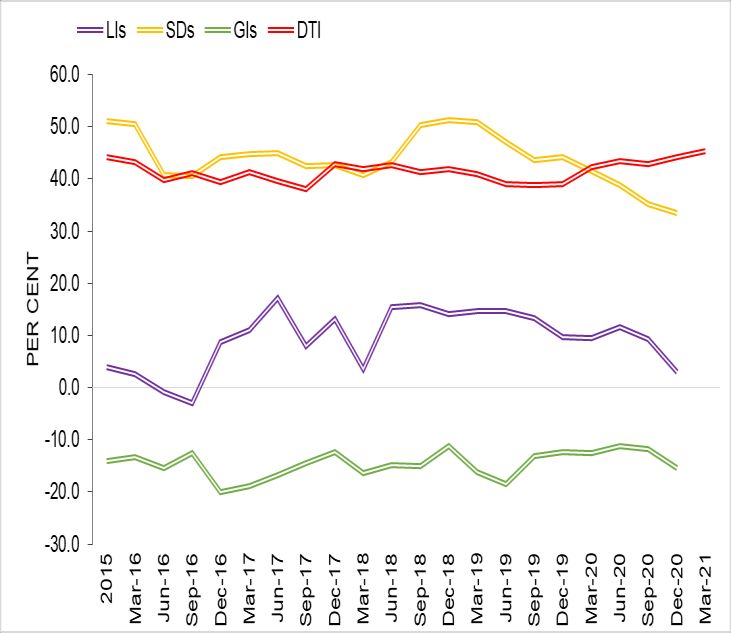
Table of Contents
Overview ……………………………………………………………………………………………………………………………………………………………………….1

Objective 1 - Mitigate and prevent excessive credit growth and leverage ……………………………………………………………………..1

Objective 2- Mitigate and prevent excessive maturity mismatches and market illiquidity ……………………………………………..2

Objective 3 - Limit direct and indirect exposure concentrations and misaligned incentives ……………………………………………3

Objective 4 - Limit the impact of interconnectness and systemic importance…………………………………………………………………7

Objective 5 - Strengthen the resilience of the financial system……………………………………………………………………………………….8

Outlook ………………………………………………………………………………………………………………………………………………………………………….8

 Preface
 Bank of Jamaica frequently conducts assessments of the resilience and strength of the
 financial system. These financial system stability assessments inform the Bank’s
 macroprudential policy. This report provides highlights of those assessments for the
 reporting quarter. The document is organized into five objective assessment areas, the
 analysis of which utilizes leading and coincident indicators relevant to the specific type
 of vulnerability. The aim of the report is to:

 • Convey Bank of Jamaica’s financial system stability assessment.
 • Make clear the link between the Bank’s assessment and any policy action taken.
 • Provide information on matters related to financial system stability.
Overview Objective 1 - Mitigate and prevent
Macro-financial conditions, as indicated by composite excessive credit growth and leverage
indicators of financial and macroeconomic
developments, remained stable during the March 1.0 The pace of credit growth continued to
2021 quarter. Financial institutions also continued to decelerate over the review quarter. Annual growth
be well-capitalized and largely remained resilient to of total credit, including corporate bond issues, was
simulated financial shocks. 8.0 per cent at end-March 2021, which was slower
 than the annual growth of 9.5 per cent at end-
The risks associated with financial cycles during the December 2020 (see Chart 1.0). In particular, private
review quarter did not increase materially during the sector credit increased by 7.3 per cent for the year-
review quarter. Indicators of household and corporate ended March 2021, slower than the 10.4 per cent
debt sustainability were also generally unchanged growth recorded at December 2020. 1 This growth in
over the review quarter. credit resulted in the provision of additional
 financing of $22.0 billion to the private sector during
The results for the financial sector occurred in the the review quarter.
context of the stable macroeconomic environment
and the recovery of the Jamaican economy. There has
also been a significant decline in the stock of loan
moratoria provided by banks. Continued weakness in
the debt profile of some borrowers, particularly in the Chart 1.0 Annual Growth in Credit
tourism sector, during the March 2021 quarter
however led deposit-taking institutions to maintain
payment accommodations.

Going forward, the Jamaican economy is projected to
improve further in the context of a strong recovery in
the global economy and with appropriate fiscal and
monetary policies to mitigate the impact of the
COVID-19 pandemic. This outlook will allow deposit-
taking institutions to release loan-loss reserves set
aside during the pandemic as the debt repayment
capacity of borrowers improve. Further, as the
Jamaican economy recovers and as capital markets
 Source: Bank of Jamaica
regain momentum, financial entities should begin to
report increased profits.

The supervisors of the financial system will continue
their enhanced monitoring of early warning indicators
to ensure that the system remains sound.

1
 Private Sector Credit is measured as DTIs’ loans and advances to the private sector
excluding credit to overseas residents and other financial institutions. Total DTI
credit includes private sector credit plus credit issued to the public sector plus DTIs’
holdings of corporate securities. .
 1

1.1 For the first time in more than eight quarters,
Chart 1.1 DTI Credit plus Corporate Bond Issues
 the credit-to-GDP gap indicator (which is a measure
via Exempt Distribution
 of leverage for the economy) remained relatively
 unchanged at 8.1 per cent at end-March 2021, when
 compared to end-December 2020 (see Chart 1.2).2
 This outturn reflected an estimated decline of 0.1 per
 cent in nominal GDP and an increase of 1.0 per cent
 in total credit for the March 2021 quarter, relative to
 the previous quarter. Although the indicator
 remained above the BOJ’s threshold of 2.5 per cent,
Source: Bank of Jamaica and Financial Services Commission
 it appears to be settling below the Bank of
 International Settlements’ (BIS) signal threshold of
Chart 1.2 Evolution of Credit-to-GDP Gap 10.0 per cent.
Indicators
 1.2 The leverage ratio for DTIs, which shows the
 extent that financial institutions use equity to fund
 asset expansion, increased by approximately 1.0 per
 cent for the March 2021 quarter, relative to a decline
 of 1.9 per cent the prior quarter (see Chart 1.3).3 The
 increase in the leverage ratio reflected a faster pace
 of growth in total financial assets relative to the
 growth in equity. 4

Source: Bank of Jamaica
 Objective 2- Mitigate and prevent excessive
 maturity mismatches and market illiquidity
Chart 1.3 Leverage – DTIs, SDs, LIs & GIs
 2.0. The maturity transformation ratio for the DTI
 sub-sector (which captures the maturity mismatch
 between assets and liabilities) continued to increase
 for the March 2021 quarter (see Chart 2.0).5 This
 increase mainly reflected a faster pace of growth in
 long-term assets, relative to long-term liabilities.

Source: Bank of Jamaica and Financial Services Commission

2 The credit-to-GDP gap indicator measures the deviation of credit-to-GDP 4
 Leverage risk metric declined for Securities dealers, General and Life insurance
relative to its long-term trend. It signals the extent of credit risk accumulation. companies by 5.8 per cent, 27.8 per cent and 2.53 per cent, respectively for the
Total credit used to calculate the credit-to-GDP gap is comprised of private December 2020 quarter. Data on these subsectors for the March 2021 quarter
sector credit plus corporate securities held by DTIs plus public sector credit. were not available at the time of this Report.
Nominal GDP is annualised by calculating a 4 quarter moving sum. 5
 Maturity Transformation (Long term) = (long term assets - long term liabilities -
3
 Leverage is calculated as (total financial assets/equity). nonredeemable equity) / total financial assets.
 2
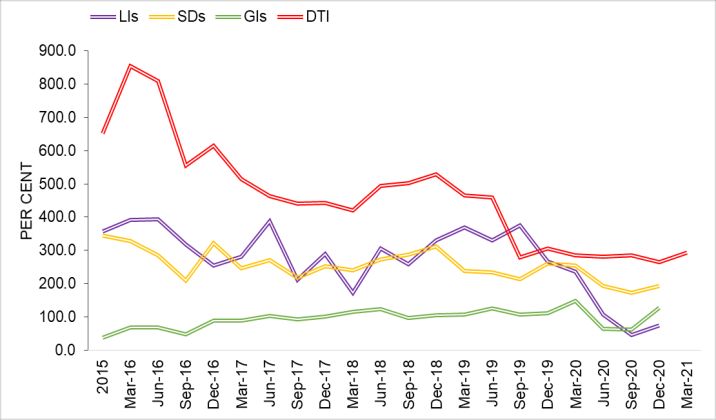
2.1. The liquidity transformation risk metric for Chart 2.1 Liquidity Transformation – DTIs, SDs,
DTIs as at March 2021 (which measures the extent and LIs & GIs
of coverage of short-term liabilities with liquid
assets) also increased relative to the previous
quarter. 6 This increase was due to a decline of 7.8
per cent in liquid assets and an increase of 1.6 per
cent in short-term liabilities (see Chart 2.1).

2.2. Data for securities dealers and insurance
companies is only available for the December 2020
quarter. It shows that there were improvements in
the long-term maturity transformation risk metrics
for both sub-sectors during the quarter.
 Source: Bank of Jamaica

2.3 In relation to liquidity transformation risk
metrics for securities dealers, life insurance and
 Objective 3 - Limit direct and indirect
general insurance companies, the indicators
 exposure concentrations & misaligned
increased in the December 2020 quarter (see Chart
 incentives
2.1). These increases were primarily driven by greater
than proportional increases in short-term liabilities
 3.0. DTI loans to the main economic sectors
relative to liquid assets.7
 increased for the March 2021 quarter. Personal
 loans, which continued to account for the largest
Chart 2.0 Maturity Transformation (Long term)
 share of the DTIs’ loan portfolio, grew by 1.4 per
for DTIs, SDs, Lis & GIs
 cent for the review quarter (or 5.1 per cent for the
 year ended March 2021) (Chart 3.1). In this context
 of this low growth, DTIs’ exposure to households, as
 measured by household debt as a share of total
 assets, declined by 0.4 percentage points for the
 review quarter.8

Source: Bank of Jamaica and Financial Services Commission

6 7
 Liquidity Transformation = short term liabilities [≤ 30 days] / liquid assets. Liquid Liquid assets for securities dealers, general and life insurance companies declined
assets include high quality liquid assets, such as cash and equivalents, short-term by 6.1 per cent, 57.7 per cent, and 8.2 per cent, respectively. Meanwhile, short-term
investments and government securities with a 0% risk-weight. liabilities grew by 4.5 per cent and 46.1 per cent, respectively. The general insurance
 sector reflected a decline in short-term liabilities of 11.9 per cent for the review
 period.
 8
 Increase in assets were primarily due to a increase in investment holdings.
 3
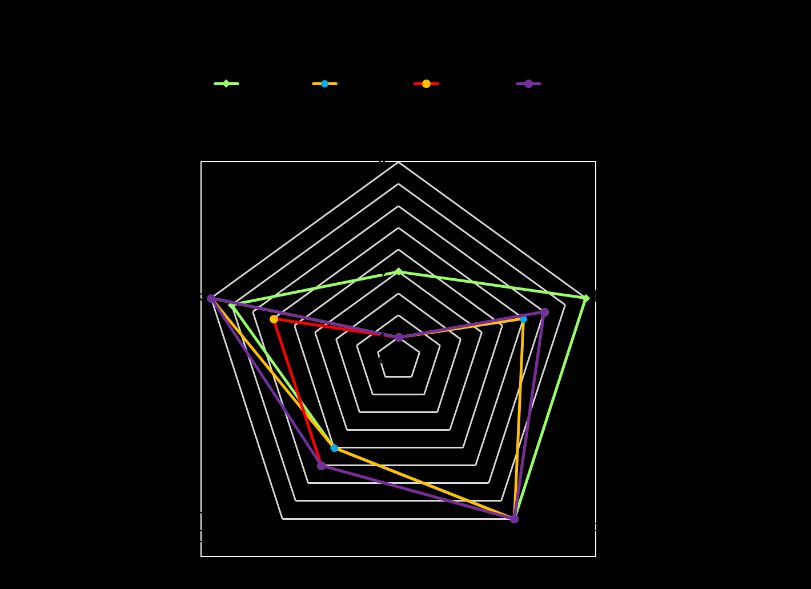
Chart 3.0 DTI Exposure to Public, Household and 3.2. repos.10 As it relates to NFCs, the sector’s
NFC Debt ratio of debt to operating surplus increased for the
 DTIs' Exposure to HH debt/DTIs' Total Assets
 DTIs' Exposure to NFC debt/DTIs' T otal Assets
 March 2021 quarter, which was primarily due to an
 increase in lending to the corporate sector by the
 DTIs' Exposure to Public Sector debt/DTIs' Total Assets

 30.0

 25.0 financial system. However, NFCs’ net financial
 20.0
 position to GDP increased relative to the previous
 PER CENT

 15.0

 10.0 quarter (see Chart 3.2 & Chart 3.3). This increase was
 5.0
 mainly due to an increase in financial assets for the
 review quarter.
 0.0
 Jun-20

 Sep-20
 Dec-19

 Mar-20

 Dec-20

 Mar-21
Source: Bank of Jamaica 3.3. The low interest rate environment continued
 to offer greater debt repayment capacity for
 households and NFC sectors as indicated by the
Chart 3.1 Loan Concentration- Selected continued reduction in the debt service ratio for the
Industries review period.11 Specifically, the debt service ratio
 DISTRIBUTION PERSONAL PROFESSIONAL declined by 0.2 percentage point as at March 2021.
 TOURISM PUBLIC OTHER

 Furthermore, given the continued recovery of the
 economy, there was a significant decline in the stock
 1200

 of loan moratoria provided by banks, particularly in
 1000
J$ Millions

 the agriculture and manufacturing sectors as well as
 800

 600
 for households.
 400

 200

 Chart 3.2 Household and NFC Debt Ratios12
 0
 Jun-18

 Jun-20
 Jun-12

 Jun-13

 Jun-14

 Jun-15

 Jun-16

 Jun-17

 Jun-19
 Dec-12

 Dec-14

 Dec-16

 Dec-18

 Dec-20
 Dec-11

 Dec-13

 Dec-15

 Dec-17

 Dec-19
 Sep-12

 Sep-13

 Sep-14

 Sep-15

 Sep-16

 Sep-17

 Sep-18

 Sep-19

 Sep-20
 Mar-12

 Mar-13

 Mar-14

 Mar-15

 Mar-16

 Mar-17

 Mar-18

 Mar-19

 Mar-20

 Mar-21

Source: Bank of Jamaica

3.1. Debt sustainability measures for households’
and non-financial corporates (NFC) continued to
show mixed results over the review period. In
particular, household debt to disposable income
increased marginally to 102.5 per cent at end March
2021, relative to 100.0 per cent at end- December
2020 (see Chart 3.2).9 In contrast, households’ net
financial position relative to GDP increased for the
quarter. This was due to growth in deposits and retail
 Source: Bank of Jamaica and Financial Services Commission

9 , ,
 Disposable income is calculated as follows; gross personal income minus taxes. the HH and the NFC is computed as follows: , = − , ∗ where
 (1−(1+ , ) ) ,
10 Net financial position to GDP is equal to (household financial assets minus
 , denotes the total stock of debt, , denotes aggregate income available for
household financial liabilities)/ nominal GDP.
 debt service payments, . denotes average interest rate on the existing stock of
 debt and , the average remaining maturity across the stock of debt.
12
 Household debt is measured as household loans extended by DTIs and NHT
loans. Household disposable income is measured as compensation of employees
(Domestic and R.O.W. (net)) minus (PAYE and Other contributions). The DSR for
 4
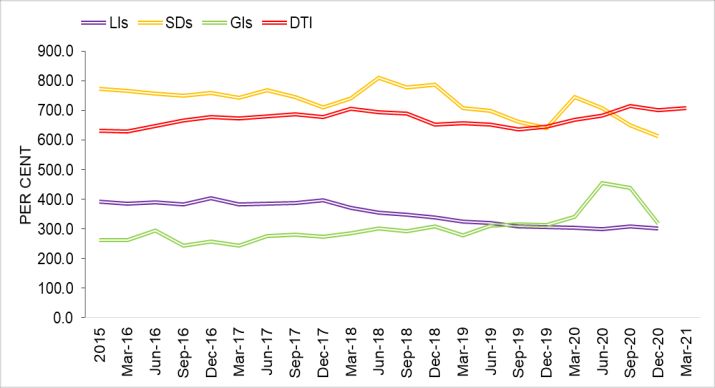
Chart 3.3 Household and NFC Net Financial 3.7. Securities dealers’ net open long position to
Positions13 capital showed an improvement in FX risk exposure
 for the December 2020 quarter. The long NOP for
 the sector fell to 7.8 per cent for the quarter from to
 46.9 per cent at end-September 2020. This reduction
 was mainly attributable to a reversal of significant
 holdings by one entity.

 Chart 3.4 Dollarization ratios for DTIs and
 securities dealers14,15

Source: Bank of Jamaica

3.4. DTIs’ foreign currency investment holdings
as a proportion of total investments increased from
30.4 per cent at end-2020 to approximately 32.0 per
cent as at end-March 2021. The ratio of DTIs’ foreign
currency deposits to total deposits remained
relatively unchanged at 38.5 per cent as at end-
March 2021, when compared with the previous
quarter (see Chart 3.4).
 Chart 3.5 Net Open Position to Capital
3.5. DTIs’ net open short position to capital (NOP)
was 23.9 per cent at end-March 2021 which was
broadly unchanged relative to a short position of
26.0 per cent at end-2020. The NOP fluctuated
within the prescribed range of +15%/-25% per cent
established by the Bank of Jamaica (see Chart 3.5).

3.6. The data for securities dealers is only
available for the December 2020 quarter. It shows
that the sector’s foreign currency investment
 Source: Bank of Jamaica
holdings as a share of total investments also
remained relatively unchanged at 55.9 per cent at
end-2020 compared with the ratio at end-
September 2020.

13
 (i) Net financial position = financial assets minus financial liabilities; (ii) financial
 15
assets for NFCs include: deposits and repo liabilities; (iii) financial liabilities for DTI data excludes information on foreign currency loans for the buildings
NFSCs include: NFC loans and non-exempt distributions; (iv) financial assets for societies sector.
households include: pension holdings, deposits, retail repos, life assurance and
annuity contracts and policyholder funds on deposit; (v) financial liabilities for
households include: consumer loans and mortgage loans.
 5
Objective 4 -Limit the impact of
interconnectedness, systemic importance Chart 4.1 Network of gross credit exposures
4.1. Total SIFI groups’ assets as a share of total between DTIs and securities dealers including
 foreign institutions
assets decreased marginally to 61.4 per cent at end-
December 2020 from 63.1 per cent at the end of the
previous quarter. Commercial banks and securities
dealers continued to be the central players in the
network (see Chart 4.0). The network metrics
continued to indicate that the network remained
dense and reciprocated.

4.2. Network analysis that focused on DTIs’ and
securities dealers’ funding relationships with other
financial institutions showed that there was a slight
increase in the value of exposures in December 2020
relative to September 2020 see (Chart 4.1).
 Source: Bank of Jamaica
Furthermore, there was a significant increase in the
degree of interconnectedness in the system during
December 2020.
 Objective 5 -Strengthen the resilience of
 the financial system
4.3. At end-December 2020, the contribution of
foreign institutions to the domestic funding network
 5.0 The financial system maintained the ability to
(domestic DTIs and securities dealers) increased by
 absorb shocks as capital positions across system
approximately 11.0 per cent to $156.9 billion. This
 remained well above prudential minimum
uptick could be attributed to a slow return to
 requirements. The capital adequacy ratio for DTIs
normalcy of external financial markets after the initial
 remained unchanged at 14.3 per cent at end-March
pressure on global financial systems due to the
 2021, relative to end-2020 (see Table 5). The average
pandemic.
 CAR for core securities dealers as at December 2020
 was 22.3 per cent. For the same period, the general
Chart 4.0 Network of gross credit exposures
 insurance industry had a weighted average
between financial sectors
 Minimum Capital Test ratio of 334.9 per cent, which
 exceeded the 250.0 per cent regulatory minimum.
 The life insurance industry had a weighted average
 Minimum Continuing Capital Surplus Requirement
 of 233.4 per cent at end-2020, which was also above
 the regulatory benchmark of 150.0 per cent.

 5.1 However, there was a decline in financial
 institutions’ earnings and profitability during the
 March 2021 quarter due to the contraction in the
 economy in the context of the COVID-19 pandemic.
Source: Bank of Jamaica
 DTIs and securities dealers return on assets (ROA) for

 6
the March 2021 quarter decreased to 0.4 per cent Chart 5.0 Evolution of risk exposure indicators
and 0.6 per cent, respectively, relative to 0.6 per cent
and 0.7 per cent for the December 2020 quarter.

Table 5.0 Select Financial Soundness Indicators
 Dec-19 Mar-20 Jun-20 Sep-20 Dec-20 Mar-21
Asset to GDP (%)
DTI 85.74 87.38 92.89 100.62 102.88 106.09
SDs 28.74 27.89 30.82 33.48 35.20 35.90
LIs 16.29 16.54 17.70 18.07 18.63 n/a
GIs 4.02 4.13 4.82 4.75 4.67 n/a

Capital Adequacy (%)
DTI (CAR) 14.34 14.19 14.16 14.23 14.31 14.33
SDs (CAR) 21.40 18.60 21.17 22.37 22.31 n/a
LIs (MCSSR) 208.04 225.59 225.59 225.59 225.59 n/a
GIs (MCT) 283.16 250.83 223.09 223.09 223.09 n/a

ROA (%)
DTI 0.61 0.26 0.20 0.27 0.56 0.36
SDs 0.52 (0.11) 0.23 0.91 0.74 0.63
LIs 2.38 1.51 3.06 4.74 3.43 n/a Risk exposure indicators:
GIs 0.68 0.00 0.48 0.63 0.65 n/a • Credit Risk - NPLs/Loans (DTIs); NPLs (net)/ Capital
 • Interest Rate Risk - Cumulative maturity gap < 30 days, < 90 days, < 360 days/Assets,
 DVBP/Capital
Liquidity (%) • Foreign Exchange Risk - NOP/Capital, FX liabilities/Total liabilities
 • Liquidity Risk – Liquid assets/total assets, liquid assets to short-term liabilities
DTIs (liquid assets to short term liabilities) 27.60 29.31 28.72 28.14 30.54 28.56
SDs (liquid assets to total assets) 16.81 16.77 16.20 15.59 14.63 n/a
LIs (liquid assets to total liabilities) 27.04 28.53 25.75 23.17 20.85 n/a
GIs (liquid assets to total liabilities) 67.46 66.08 66.07 64.68 63.86 n/a

Source: Bank of Jamaica and Financial Services Commission

5.2 The cobweb of financial exposures for DTIs
showed mixed results for the March 2021 quarter
(see Chart 5.0). DTI’s vulnerability to liquidity risk
increased marginally16, but their exposure to
household credit, exchange rate, interest rate and
non-financial corporate credit risks remained
unchanged, relative to the December 2020 quarter.

 Risk exposure indicators:
 • Credit Risk - NPLs/Loans (DTIs); NPLs (net)/ Capital
 • Interest Rate Risk - Cumulative maturity gap < 30 days, < 90 days, < 360 days/Assets,
 DVBP/Capital
 • Foreign Exchange Risk - NOP/Capital, FX liabilities/Total liabilities
 • Liquidity Risk – Liquid assets/total assets, liquid assets to short-term liabilities

16
 Liquid assets declined (on a quarter-on-quarter basis - Dececember 2020 to
March 2021) by 8%, while total assets increased by 3% and short term liabilities
declined by 2%.

 7
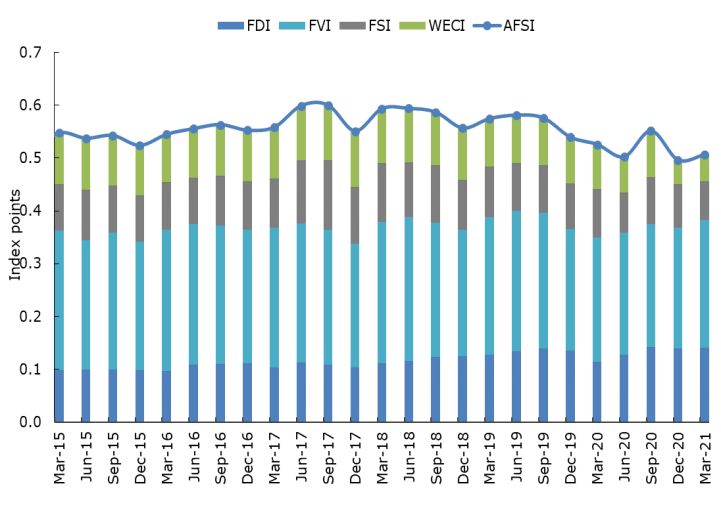
5.5 Stress test results for the DTI sector showed
5.3 The data for securities dealers and insurance
 that the institutions were generally robust to
companies is only available up to the December
 hypothetical shocks for the March 2021 quarter. In
2020 quarter. In relation to credit and liquidity risks
 relation to the performance of securities dealers and
there was an increase in securities dealers’ non-
 insurance companies, the stress test results showed
performing loans (net of provisions) to capital ratio
 that this sector at end December 2020, with the
while their liquid assets fell.17 However, in the
 exception of hypothetical interest rate shocks, were
context of the aforementioned decline in their long
 also general robust to hypothetical shocks.
NOP, securities dealers’ exposure to foreign
exchange risk decreased for the review quarter. The
 5.7 Breakpoint analysis of the stress test scenarios
sector’s exposure to interest rate risk remained
 showed that it would take an increase in interest
unchanged.
 rates of 1 200 bps/ 200 bps & 300 bps/ 30 bps on
 domestic and foreign interest rate sensitive assets
Chart 5.1 Aggregate Financial Stability Index18 and liabilities, respectively, for the first DTI to breach
 the 10.0 per cent prudential minimum at end-March
 2021. In relation to liquidity risk, it would take a 40.0
 per cent and 30.0 per cent reduction in deposits and
 repo liabilities, respectively, for the first DTI and
 securities dealer to breach the statutory minimum.
 The credit risk assessment at end-March 2021
 showed that an increase in non-performing loans of
 163.0 per cent would be necessary for the first DTI to
 breach the statutory benchmark.

 Outlook

 6.0 Economic recovery over the near term and
Source: Bank of Jamaica
 the continued resilience of the domestic financial
5.4 As measured by the Aggregate Financial system depends on the course of the COVID-19
Stability Index (AFSI), macro-financial conditions pandemic and the measures that will be deployed to
improved during the March 2021 quarter. The AFSI address it.
increased to 0.51 at end-March 2021 from 0.50 at
end-December 2020 (see Chart 5.1). This 6.1 The improved outlook for the domestic
improvement was mainly attributable to the economy for 2021 should allow banks to release
strengthening of the Financial Development, loan-loss reserves that was set aside at the onset of
Financial Vulnerability and the World Economic the pandemic. Additionally, if the capital markets
Climate sub-indices. The outturn in the Financial continue to regain momentum, financial entities will
Development sub-index was due to increased begin to record increased profits over the near-term.
market capitalization to GDP.

17 18
 This decline in securities dealers’ liquid assets was due to The Aggregate Financial Stability Index is computed as a weighted average of
reduction in these insitutions’ primary dealer account held at normalized balance sheet and macroeconomic partial indicators, capturing
 financial development (FDI), financial vulnerability (FVI), and financial soundness
the BOJ. (FSI).
 8
You can also read