Troubleshooting Common Web Application Performance Problems
←
→
Page content transcription
If your browser does not render page correctly, please read the page content below
Troubleshooting Common Web Appli cation Performance Problems

GUIDE

Troubleshooting Common Web Application
Performance Problems


Abstract


Traditional methods of troubleshooting web application performance involve looking at each tier of the
web application stack individually, including the network, web servers, databases, and storage devices.
Analyzing wire data is a far simpler and more effective way to troubleshoot. This troubleshooting guide
shows how to leverage wire data analytics to troubleshoot common web application performance issues—
including overloaded servers, changed APIs, crashed equipment, and network bandwidth constraints—
using the free ExtraHop Discovery Edition.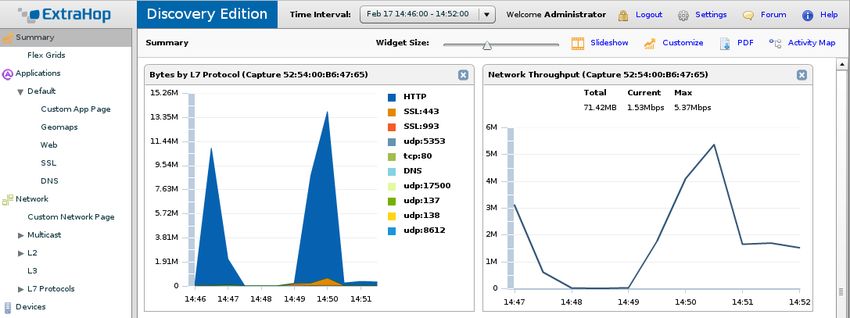
Troubleshooting Common Web Appli cation Performance Problems

Introduction
Troubleshooting poor web application performance can be frustrating. It’s bad enough when the
site, application, or service is down completely. But in many ways, it’s even worse when users
simply tell you that things are running slowly.

There are many things that can go wrong with modern web applications. Is the problem a
changed VLAN tag, an overloaded web server or database, authentication failure, or something
wrong with the client device? Normally, you’d have to access the log data for each potential
point of failure to answer those questions. But you likely have other things to do besides waste
time hunting a ghost in the machine.

With a platform for wire data analytics, you can quickly narrow down the root cause of web
application performance issues. Wire data contains all L2 through L7 communications between
devices and provides the definitive record of web application activity.

This troubleshooting guide provides step-by-step instructions for identifying the root cause of
four common web application performance problems:
    • Network issues
    • Crashed or overloaded servers
    • Misconfigurations or application errors
    • Bandwidth constraints

You can identify these issues and more by analyzing wire data with the ExtraHop platform. The
ExtraHop Discovery Edition is a free virtual appliance available for download from
www.extrahop.com/discovery. There is no limit on how long you can use the Discovery Edition.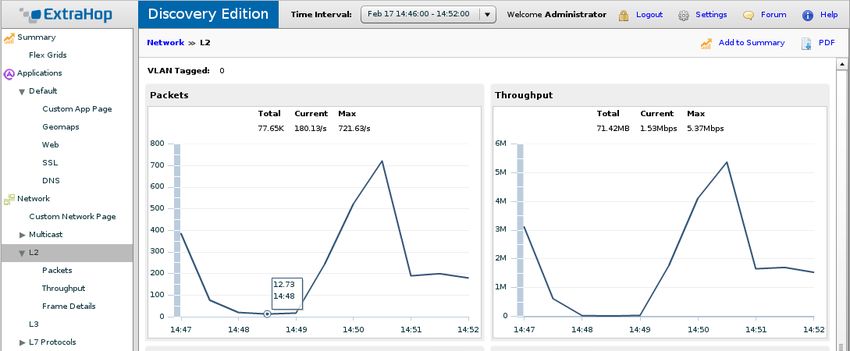
Troubleshooting Common Web Appli cation Performance Problems

                     Problem #1 – Network Connectivity and VLAN Issues
                     “The network is slow” is an all-too-common lament. Despite its frequent vilification, the network
                     is worth the time to investigate. A quick look at the ExtraHop Discovery Edition will show
                     anomalous network activity caused by unplugged cables, rebooted network switches, or
                     modified VLAN tags, for instance. The steps below demonstrate how you can identify a low-level
                     network issue.

                     Example Scenario
                     Looking at the Summary page, we can see what appears to be two minutes (14:47 to 14:49) of
                     almost no activity on the network.

* Layer 2 is the
data link layer of
the OSI model,
representing
Ethernet and
802.11 wireless
traffic over a
LAN or WAN.          Selecting Network and then L2 in the tree control, we can verify that both the number of packets
                     per second and throughput dropped to near zero (12.73 packets/second and 12Kbps,
                     respectively) during that time period. Most likely, this trickle of traffic is localized broadcast traffic.
Troubleshooting Common Web Appli cation Performance Problems
Layer 2 traffic was virtually nil for two minutes, indicating a network equipment problem.
Synopsis: A network switch rebooted, preventing users from connecting to the web server.
Looking at Layer 2 activity helped to quickly identify this issue.
Problem #2 – Crashed or Overloaded Servers
You might use some sort of basic server monitoring already, but there can still be delays
between the time a server crashes and when the IT team is notified. More commonly, a web or
database server responds to requests slowly because of heavy load. By observing the
communications between servers, you can detect crashed or overloaded servers.
Suppose the database server is shared among several other applications in addition to your web
Tip: When a application, and a development team member pushes out an ill-advised bit of code that soaks up
database is the database server CPU resources. Now your web application is responding slowly, but how
shared among can you find the root cause?
multiple
applications, you Example Scenario
need to be able When trying to identify a crashed or overloaded server, the best place to start is the Summary
to see which page, which displays a high-level overview of activity at various tiers of your web application
queries are stack, including network, web, database, storage, authentication, and domain name services.
associated with
different
applications.
The same
principle applies
to other shared
services.
From the Summary page, you want to look for abnormalities in activity. Make sure to use the
Time Interval options to make variances more apparent. In this scenario, we have noticed a
suspicious dip in traffic. Narrowing the time interval, we can see that the volume of HTTP traffic
suddenly disappears for a period of several minutes. To investigate, we click HTTP on the Bytes
by L7 Protocol chart.Troubleshooting Common Web Appli cation Performance Problems
Tip: When
examining wire
data, look at
anomalous
activity for each
protocol, and
then drill down
to see which
devices are
involved.
Here, we see a list of all devices communicating using the HTTP protocol. The first two devices
in the list stand out because their volume of HTTP traffic is significantly higher than the others,
and also because their inbound and outbound traffic counts are inversely correlated. One client
is requesting 70GB of HTTP data. There is definitely something suspicious going on here.Troubleshooting Common Web Appli cation Performance Problems Clicking the first device—the one requesting 70 GB of HTTP data—pulls up metrics specific to that device. Click the Protocol Breakdown tab and hover over the chart to see the exact traffic measurements for each L7 protocol at specified times. We can see that even when HTTP traffic dropped off, this device was still online and communicating, receiving over 7MB of HTTP traffic. Because this device has been functioning during the time period under investigation, we close this window and look at the other device that is sending 70GB of HTTP data during this time period. Note: The ExtraHop Discovery Edition shows summary metrics for specific devices, but with the full edition of the ExtraHop platform, you can drill down to see transaction details for specific devices such as error counts, methods used, users, and files accessed.
Troubleshooting Common Web Appli cation Performance Problems

Clicking the Protocol Breakdown tab for the second device tells a different story.

During the same time period, this second device stopped communicating not only over HTTP but
all other protocols as well. This indicates that the device lost network connectivity, rebooted, or
crashed. In any case, by viewing L2-L7 communications for all systems, we were able to quickly
isolate the problem server with just a few clicks.

Summary: A server lost connectivity, rebooted, or crashed for several minutes. Visibility into
application-layer (Layer 7) traffic for each device helps to identify the server experiencing
problems, as well as the devices it is communicating with.

Problem #3 – Misconfigurations and Application Errors
As discussed earlier, many issues can affect web application performance, from errors in the
application code and inability to access resources, to authentication failures and
misconfigurations. Some of these problems affect all users, so you find out about them very
quickly. But some problems are intermittent or affect only certain segments of users. To catch
these intermittent issues and make sure that all your users have a great experience, it is
important to monitor HTTP errors.
Troubleshooting Common Web Appli cation Performance Problems

                     HTTP errors help IT teams find out when something odd is happening with the web application.
Tip: Monitoring      Wikipedia contains an exhaustive list of HTTP status codes, but these are the ones that users
HTTP errors on       complain about most and that indicate an error:
the wire is a good       • 3xx – Redirection: The server did not handle the request normally and the request was
way to detect               redirected to another server.
intermittent             • 4xx – Client error: The client request was not accepted because it was not authorized
problems or                 (HTTP status code 401), the client was forbidden access even with authorization (HTTP
issues that affect          status code 403), or the requested resource was not found (HTTP status code 404).
only a subsection        • 5xx – Server error: The server could not fulfill a valid request.
of users.
                     Example Scenario
                     Investigating HTTP errors is easy using the ExtraHop platform. Go to the Summary page, and
                     click HTTP Server in the Server Activity Group list. The resulting page provides an aggregate
                     analysis of all HTTP server activity, including the transaction counts for different HTTP status
                     codes. The full edition of the ExtraHop platform enables you to dig deeper than aggregate
                     analysis and see HTTP transaction metrics for each device, but the Discovery Edition provides
                     sufficiently deep analysis for this scenario.

                     To get a quick sense of where HTTP errors are coming from, we click the Errors button at the
                     top of the screen. Doing so provides a ranked list of uniform resource identifiers (URIs),
                     including URLs, that are returning error messages to users.

                     We can see that the top two URIs generating errors are from the main application server. During
                     the time period selected, these two URIs generated more than 300 HTTP errors.
Troubleshooting Common Web Appli cation Performance Problems
Returning to the HTTP Server page, we can see that the count for HTTP 501 codes is
suspiciously high. Clicking the link, we can see a ranked list of web servers returning HTTP 501
errors.
Just two servers are generating all of the HTTP 501 errors. From their device names, we
Tip: Examine recognize two of the servers as our main application servers.
HTTP errors
regularly to As it turns out, HTTP 501s errors are defined as “Not Implemented” and returned when a
catch issues that request uses a method that is not understood by the server or that the application has not
users might implemented. For example, the user receives a HTTP 501 error if the client uses the PUT
tolerate and method to access a URI but our application has implemented only the GET method. In this case,
never bother to we had recently made an API change at the application tier, and likely some of the components
report. Oil the at the web tier are trying to access this API using an old version.
wheel before it
squeaks! Synopsis: Some components of the web application did not update to the latest API. By
periodically examining HTTP errors in your environment, you can catch issues that might
inconvenience some users even before they call the service desk. Without this visibility, you
would not know about these problems until someone was frustrated enough to log a ticket.
Problem #4 – A Device Soaking Up Bandwidth
One reason that the network gets blamed so frequently for performance issues is because it is a
shared resource. The bandwidth consumption of one activity leaves less bandwidth for other
users and applications, and it is hard to police how well users and applications are behaving on
the network just by looking at ports, bytes, and packets.Troubleshooting Common Web Appli cation Performance Problems
IT teams need a real-time view of all L2 through L7 communications to answer important
questions:
• Are people downloading large files from your site?
• Is there an ill-timed backup running?
• Is a logging script behaving badly?
• Is a search engine crawling the site?
The ExtraHop platform can answer these questions by revealing not just which users and
applications are using the network, but also how efficiently they are using it.
Example Scenario
In an earlier scenario that involved network connectivity and VLAN issues, we investigated a
network outage caused by a switch rebooting. Before and after the reboot, there was a spike in
HTTP traffic. It would be interesting to see what caused that spike in HTTP traffic.
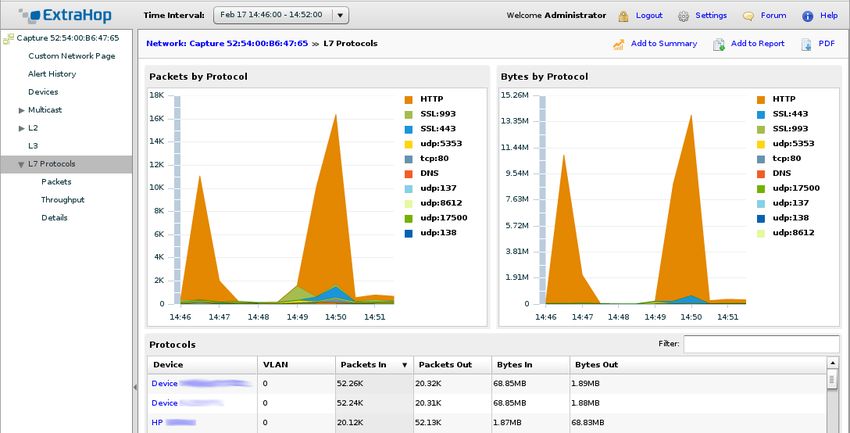
On the Summary page, click the Bytes by L7 Protocol chart. We can see that HTTP traffic
spikes up to 13Mbps, which is worrisome considering that we have only a 15Mbps link with our
ISP. If this traffic passes over this ISP link, it negatively affects our locally hosted web
application. The devices listed below represent the top talkers during the time period selected.Troubleshooting Common Web Appli cation Performance Problems If we click the second device in the list, we see incoming and outgoing traffic for this device alone. Most of the traffic is HTTP. Clicking HTTP in the chart narrows the list of servers below to only those that are communicating with this particular device using the HTTP protocol. This view reveals that this particular user is browsing multiple content-heavy web sites. We can also see that all this traffic goes through our HP networking switch, which is our main uplink switch to our ISP. Given this information, we can look into obtaining a dedicated link just for our web application or educating our users on our Internet usage policy. Synopsis: A particular user was consuming too much bandwidth, leaving less bandwidth available for our locally hosted web application. Application-layer (Layer 7) visibility is required to understand how well users and applications are using (or abusing) network bandwidth. With the full edition of the ExtraHop platform, you can dig deeper into the client device to see which web services the user is accessing. There is also a free add-on module available from the ExtraHop customer forum (http://forum.extrahop.com) that provides a dashboard to monitor public cloud applications such as Dropbox, Google Drive, Salesforce.com, Gmail, YouTube, Pandora, and more.
Troubleshooting Common Web Appli cation Performance Problems

                               Conclusion
                               Examining wire data is the most efficient way to troubleshoot web application performance
                               issues. The ExtraHop wire data analytics platform enables you to easily identify and investigate
                               anomalous activity at the network, web, database, or storage tiers in order to find the root cause
                               of performance problems. This method saves you time and effort when troubleshooting issues,
                               and also minimizes inconvenience for end users.

                               You can solve the problem scenarios described in this troubleshooting guide using the ExtraHop
                               Discovery Edition, a free virtual appliance. Deployment is easy, requiring just four steps:
                                   1. Fill out the form at www.extrahop.com/discovery.
                                   2. Receive your product key, and download the .ova file.
                                   3. Install the virtual appliance on a machine with a bare-metal hypervisor, your desktop, or
                                      in AWS.
                                   4. Direct traffic to the appliance using a port mirror or ExtraHop’s software tap.

                               You can upgrade the ExtraHop Discovery Edition to the full version at any time, which adds a
                               minimum of 30-day lookback, device-level transaction metrics, customizable alerts, and up to a
                               sustained 20Gbps throughput.

                              ExtraHop is the global leader in real-time wire data analytics. The ExtraHop Operational Intelligence platform analyzes
                              all L2-L7 communications, including full bidirectional transactional payloads. This innovative approach provides the
                              correlated, cross-tier visibility essential for application performance, availability, and security in today's complex and
                              dynamic IT environments. The winner of numerous awards from Interop and others, the ExtraHop platform scales up
                              to 20 Gbps, deploys without agents, and delivers tangible value in less than 15 minutes.

                              ExtraHop Networks, Inc.
                              520 Pike Street, Suite 1700
                              Seattle, WA 98101 USA
                              www.extrahop.com

© 2014 ExtraHop Networks, Inc. All rights reserved.
You can also read