SWEDISH MATCH RESULTS PRESENTATION Q1 2019

Page created by Fernando Rodriguez
 
CONTINUE READING
SWEDISH MATCH RESULTS PRESENTATION Q1 2019
SWEDISH MATCH RESULTS PRESENTATION
                           Q1 2019
SWEDISH MATCH RESULTS PRESENTATION Q1 2019
DISCLAIMER

The information contained in this presentation has not been independently verified and is subject to change without notice and neither Swedish
Match, nor an affiliate thereof or any other party is under any obligation to update or keep current the information contained herein. Accordingly,
no representation or warranty, express or implied, is made or given by or on behalf of Swedish Match or any other party (or any of their
respective members, directors, officers, employees or any other person) as to the accuracy, completeness or fairness of the information or
opinions contained in this presentation, and any reliance you place on such information or opinions will be at your sole risk. Neither Swedish
Match nor any other party (or any of their respective members, directors, officers, employees or any other person) accepts any liability
whatsoever for any loss howsoever arising from any use of this presentation or its contents or otherwise arising directly or indirectly in
connection therewith.

By attending a meeting where this presentation is presented, or by reading the presentation, you acknowledge that you will be solely
responsible for your own assessment of the potential investment, the market and market position of Swedish Match and that you will conduct
your own analysis and be solely responsible for forming your own view of the potential future performance of Swedish Match and its business.
This presentation may contain certain forward-looking statements that reflect Swedish Match’s current views or expectations with respect to
future events and financial and operational performance. Although Swedish Match believes that these statements are based on reasonable
assumptions and expectations, Swedish Match cannot give any assurances that such statements will materialize. Because these forward-
looking statements involve known and unknown risks and uncertainties, the outcome could differ materially from those set out in the forward-
looking statement. The forward-looking statements speak only as at the date of the presentation and Swedish Match undertakes no obligation
to update such forward-looking statements.

This presentation contains market data and industry forecasts, including information related to the sizes of the markets in which Swedish Match
and its subsidiaries participates. The information has been extracted from a number of sources. Although Swedish Match regards these sources
as reliable, the information contained in them has not been independently verified and therefore no assurance can be given that this information
is accurate and complete. In addition to the above, certain data in the presentation is also derived from estimates made by Swedish Match. The
information and opinions contained in this presentation are provided as at the date of this presentation and are subject to change without notice.

                                                                                                                                                      2
SWEDISH MATCH RESULTS PRESENTATION Q1 2019
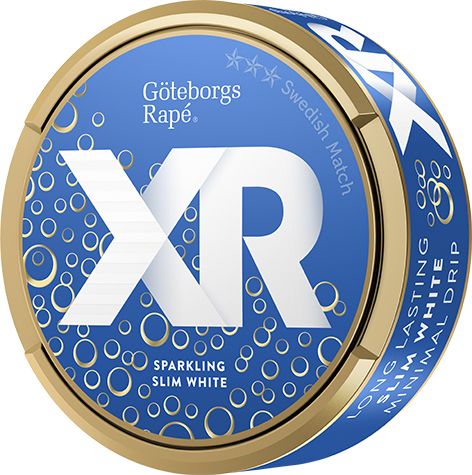
Q1 – HEADLINE BULLETS

o In local currencies, sales increased by 3 percent for the
  first quarter. Reported sales increased by 11 percent to
  3,258 MSEK (2,941).
o In local currencies, operating profit from product
  segments1) increased by 7 percent for the first quarter.
  Reported operating profit from product segments
  increased by 15 percent to 1,238 MSEK (1,079).
o Operating profit amounted to 1,190 MSEK (1,047) for the
  first quarter.
o Profit after tax amounted to 880 MSEK (766) for the first
  quarter.
o Earnings per share increased by 19 percent to 5.17 SEK
  (4.36) for the first quarter.

 1) Operating profit for Swedish Match product segments, which excludes Other operations.

                                                                                            3
SWEDISH MATCH RESULTS PRESENTATION Q1 2019
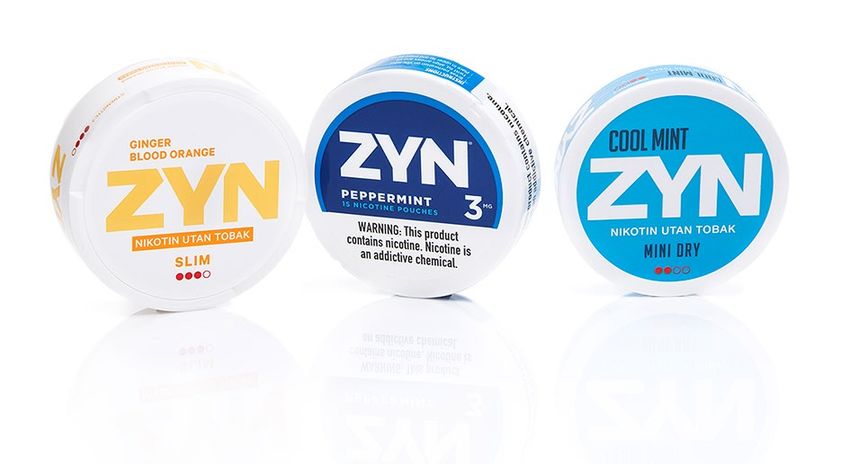
FIRST QUARTER IN SUMMARY

Sales and profit growth driven by ZYN. Good financial result despite headwinds
  -   Sales comparison adversely impacted by new retailer merchandising program in the US. Adjusted for this, sales from
      products segments would have increased by 4 percent in local currencies.
o Snus and moist snuff product segment sales up 5% in local currencies, operating profit up
  -   Sales growth driven by ZYN in the US. US manufacturing for ZYN up and running, national rollout beginning from April.
  -   Scandinavian sales increased on higher pricing, with shipment volumes down, hampered by calendar effects (Easter).
  -   Operating profit up 9%. Higher operating profit in local currencies in Scandinavia and in the US driven by snus/ZYN.
  -   Moist snuff sales/volumes lower on promotional phasing.
o OTP sales flat. Operating profit up in local currencies, driven by cigars
  -   Cigar volumes down 2% due to volume declines on rolled leaf cigars (supply constraints). Pricing positive.
  -   US chewing tobacco own brands shipments down 8% following very strong Q4. Continued mix shift toward value.
  -   Chewing tobacco volumes outside the US up due to the Oliver Twist acquisition.
o Lights segment sales and operating profit up versus a weak Q1 2018
  -   Higher volumes for both matches and lighters.
  -   Pressure on raw material input costs, most notably nylon for lighters.
  -   Prior year included 12 MSEK in restructuring costs (Brazil).

                                                                                                                              4
SWEDISH MATCH RESULTS PRESENTATION Q1 2019
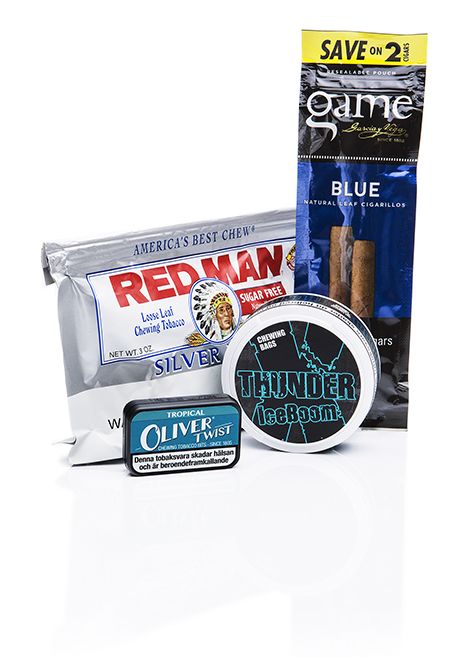
SNUS AND MOIST SNUFF: Q1 COMMENTARY

Higher sales in the US, largely from rapid growth of ZYN, as well as in Scandinavia
o Higher sales and operating profit in both Scandinavia and the US in local currencies
  -   Sales and operating profit in Scandinavia up, primarily from higher pricing
      -   Strong category growth but continued market share declines.
      -   Positive contribution from Gotlandssnus acquisition while organic underlying volumes flat adjusted for calendar effects.
      -   Higher average pricing on stronger NOK and price increases.
  -   Continued strong growth for snus and nicotine pouches outside Scandinavia
      -   ZYN volume growth in the US from faster velocity as well as higher store count (avg. 14,600 stores in quarter).
      -   Volumes up slightly for snus in the US, despite reduced marketing support.
      -   ZYN now also available in Denmark, Czech Republic, and online in the UK and Switzerland.
  -   US moist snuff sales and operating profit lower on a local currency basis
      -   Total category volumes lower. SM volumes also down, in large part due to promotional phasing.
      -   Higher volumes for pouches and tubs more than offset by declines for traditional loose.
  -   Operating profit and margin were adversely affected by a changed segment
      allocation methodology for shared operating expenses of our US business

                                 Q1-2019   Q1-2018   chg   April 2018-March 2019   Full year 2018   chg
Sales, MSEK                        1,515     1,386     9                   6,257            6,127     2
Operating profit, MSEK               676       623     9                   2,844            2,791     2
Operating margin, %                 44.6      45.0                          45.2             45.6

                                                                                                                                     5
SWEDISH MATCH RESULTS PRESENTATION Q1 2019
SCANDINAVIA – UNDERLYING VOLUMES AND SWEDISH MATCH PRICE/MIX EFFECT

 Total Scandinavian snus by quarter versus same quarter prior year

                                                   Industry volume growth*        SM organic volume growth*       SM price/mix effect**

                                                                                                                      +7.3%

                                                                                                      +6.0%                               +6.1%
                                                                                                                                                          +5.5%
                                                                                      +5.1%
                                               +4.1%                +4.3%                                                   +4.1%
                           +3.9%                                                                          +3.8%
                                                                          +3.1%           +3.0%
       +2.8%                                                                                                  +2.8%
                                                                                                                                +2.1%             +2.3%           +2.1%
                                                        +1.9%                                 +1.8%
                                    +1.3%          +1.2%                      +1.5%
                               +0.8%                                                                                                         +0.9%
                                                                                                                                                             +0.3%

           -0.3%
                -1.1%
            Q1-17                Q2-17               Q3-17                Q4-17          Q1-18           Q2-18            Q3-18              Q4-18           Q1-19

                                           2017                                                                   2018                                        2019

* Based on Nielsen and Swedish Match estimates (adjusted for hoarding).
** Adjusted for currency effects.

                                                                                                                                                                          6
SWEDISH MATCH RESULTS PRESENTATION Q1 2019
SWEDEN – CATEGORY DEVELOPMENT AND MARKET SHARE DYNAMICS

Volume and retail value year-on-year growth                                Market share dynamics (volume shares)
(Nielsen)
                               Volume       Retail value
                                                                                                                                  -4.4%
8%

                                                                                                                           89.8% 87.1%
7%                                                                        90.0%                                                      85.4%
                                                                                                                                                    -3.6%
                                                                          80.0%
6%
                                                                          70.0%          +0.3%                                                 64.4% 62.0%
                                                                                                                                                         60.8%
5%                                                                        60.0%
                                                                                       46.6%                  -2.4%
                                                                          50.0%    46.6%    46.9%
4%
                                                                                                               33.3%
                                                                          40.0%                        35.5%
                                                                                                                   33.0%
3%
                                                                          30.0%

2%

                                                                          0.0%
1%                                                                                    Value price          Swedish          Swedish Match Swedish Match
                                                                                     segment SoM          Match value       premium share market share
0%                                                                                                        price share
        2014          2015           2016        2017      2018   2019*
                                                                                                        Q1 2018         Q4 2018           Q1 2019
*12 months rolling ending March 31, 2019.
Source: Nielsen, DVH+SVH.                                                  Source: Nielsen, DVH+SVH excl. tobacconists (including nicotine free).

                                                                                                                                                                 7
SWEDISH MATCH RESULTS PRESENTATION Q1 2019
NORWAY – ALL WHITE GROWTH AND NEW AND IMPROVED DYNAMICS

 All-white and loose segment volume share of                             Market share dynamics (volume shares)
 total market (Nielsen)

                                 All-White SoM        LS SoM                          -0.3%
 15%
                                                               13,4%   100.0%       91.0%
                                                                                91.5%    91.2%
                                                                       90.0%                                              +0.5%
 12%                                                                                                                                        -1.9%

                                                                                                                        51.1%     52.2% 50.5%
                                                                                                                   51.2%     51.7%          50.3%
  9%                                                                   50.0%
                                                               7,1%
                                                                       40.0%
                                                                                                         +3.3%
  6%                                                                   30.0%
                                                                                                         18.1%
                                                                       20.0%                                   17.1%
                                                                                                     13.8%
                                                                       10.0%
  3%
                                                                        0.0%
                                                                                    Swedish      Swedish                  Swedish     Swedish Match
                                                                                  Match loose  Match nicotine           Match portion  market share
  0%                                                                             segment share pouch share             (ex. NP) share

                                                                                                     Q1 2018     Q4 2018          Q1 2019

Source: Nielsen, 4-week data, DVH+KBS (excluding Esso).                  Source: Nielsen, DVH+KBS.

                                                                                                                                                      8
SWEDISH MATCH RESULTS PRESENTATION Q1 2019
RECENT NEW PRODUCT ACTIVITY

Norway and Sweden
o G.4 Blush Slim All White (February)
o Onico Pure White Slim (March)
  - pouches with neither nicotine nor tobacco

Sweden
o ZYN Slim nicotine pouches:
  Apple Mint and Ginger Blood Orange (February)
o XR Göteborgs Rapé Sparkling Slim White
  (April) – celebrating Göteborg Rapé’s
  100 year anniversary
Limited editions:
o Small Batch #8 (February)
o Henrik Jacobssons Vinbär Special (April)
o Small Batch #9 (April)

Outside Scandinavia
o ZYN Slim & ZYN Dry/Mini nicotine
  pouches, Czech Republic (late 2018) and
  Denmark (early 2019)

                                                  9
SWEDISH MATCH RESULTS PRESENTATION Q1 2019
US – MOIST SNUFF
Value growth outpacing volume growth
                                    Volume growth                                                                   Value growth
                                  Market      Swedish Match                                                   Market    Swedish Match

    5%                                                                                          5%

    0%                                                                                          0%

   -5%                                                                                          -5%
                Q1              Q2               Q3               Q4            Q1                     Q1     Q2          Q3           Q4             Q1
               2018            2018             2018             2018          2019                   2018   2018        2018         2018           2019

Swedish Match’s pouch volumes have outperformed the category
                    Market                                               Swedish Match                                         YTD to Mar 2019,
                   Million cans                                            Million cans                                     y-o-y growth rates (%)
                                                                                                                                        Volume
                  CAGR 10.1%                                              CAGR 14.4%
                                                                                                                                             10.7%
               214 237 243 257                                                        15   17   18
           190                                                            12   13
   144 169                                                          10
                                                             8
                                                                                                                                   1.8%

  2012 2013 2014 2015 2016 2017 2018                      2012 2013 2014 2015 2016 2017 2018                                       Market Swedish
                                                                                                                                           Match
Source: Industry estimates, Swedish Match direct sales, and CMPP.

                                                                                                                                                            10
SNUS AND NICOTINE POUCH VOLUMES OUTSIDE SCANDINAVIA

 Swedish Match’s shipments of snus and nicotine                                                ZYN: Increase in quarterly average velocity and
 pouches outside of Scandinavia by rolling four quarters*                                      increased number of stores**

 Million cans                                                                                                    Cans per store per week, CSW*                    Store count ~14,600
                                      Snus (ex. V2)        ZYN
                                                                                                                                                                              stores**
 26
 24
 22
 20
 18
 16
 14
 12
 10
  8
  6
  4
  2
  0                                                                                                Q4       Q1       Q2       Q3       Q4       Q1       Q2       Q3       Q4       Q1
                                                                                                  2016     2017     2017     2017     2017     2018     2018     2018     2018     2019

                                                                                              **Cans per store per week are based on distributor to retail shipments for stores installed through
* Excludes V2 snus. Shipments refer to the US and other all other non-Scandinavian markets.   Dec. 30, 2018. Q1 average store count: ~14,600. End of quarter store count ~15,000 stores.

                                                                                                                                                                                           11
Q1 US MOIST SNUFF CATEGORY GROWTH Y-O-Y

 Total moist snuff market                                                                Moist snuff pouches

                       0.7%                                                                         4.2%
                                                        0.2%

                                                                                                               2.5%
                                                                        -0.7%                                         1.8%    1.8%
                                       -0.9%

      -4.3%                                                                                -2.5%
      West            South           Central           East          Total US             West    South   Central    East   Total US

Source: CMPP 13w ending March 17 based on Swedish Match regional designation by state.

                                                                                                                                        12
OTHER TOBACCO PRODUCTS (OTP): Q1 COMMENTARY

Strong financial performance for cigars, despite volume constraints for rolled leaf varieties
o Sales flat, operating profit up in local currencies
   -   Cigar sales flat despite volume declines. Benefited from rolled leaf price increase in 2018
       -   Cigar volumes down 2% largely attributable to shortage of cigar leaf for rolled leaf cigars.
       -   Rolled leaf volumes down more than 20% vs. prior year on production constraints/leaf shortage.
       -   Operating profit benefited from higher average pricing.
   -   Soft quarter for US chewing tobacco following a strong Q4
       -   Volumes (excl. contract manufacturing) down 8% compared to the prior year.
       -   Volumes for traditional premium varieties declined, but grew for value brands.
       -   Price increases partially offset by mix shift toward value brands.
   -   Chewing tobacco outside the US: Sales up, profits down
       -   Positive contribution to sales from the acquisition of Oliver Twist.
       -   Sales and operating profit burdened by temporary factors relating to establishment
           of DK sales force.
   -   Operating profit and margin were positively affected by a changed segment
       allocation methodology for shared operating expenses of our US business
                                  Q1-2019   Q1-2018   chg   April 2018-March 2019   Full year 2018   chg
 Sales, MSEK                        1,344     1,190    13                   5,394            5,240     3
 Operating profit, MSEK               518       425    22                   2,050            1,956     5
 Operating margin, %                 38.6      35.7                          40.2             37.3

                                                                                                            13
US – CIGARS

 Year on year volume growth                                       Breakdown of Swedish Match’s cigar volumes by
                                                                  segment compared to the addressed market
                                   Q1 2019                                                                  Q1 2019
                              Market   Swedish Match
    10%
                                                                             Swedish Match                                         Category

     5%
                                                                                                                                              25%
                                                                           42%                    46%
     0%                                                                                                                                        14%
                                                                                                                             61%

                                                                                     12%
    -5%

                                                                               Natural leaf (ex. rolled leaf)         Natural rolled leaf     HTL
   -10%
            Total cigar category       Total HTL       Total NL

                                                                   Source: Swedish Match estimates of distributor shipments to retail using
Source: CMPP.                                                      CMPP data. Excluding segment for pipe cigars and ‘other’.

                                                                                                                                                     14
US – CHEWING TOBACCO
Shipment volume and price/mix percentage change year on year, Swedish Match brands*
                                                                                   Volume         Price/mix
 15%
                        7%                       5%                       6%                        5%
  5%                                                                                                                        2%                      2%                       3%

  -5%
                                                                                                                                            -4%                       -4%
               -5%                                                -6%
                                        -5%                                                 -9%                    -5%
-15%
                  2013                      2014                     2015                      2016                    2017                    2018                     2019**

Chewing tobacco category (Swedish Match estimates) and Swedish Match volume change year-on-year (%)
                   Total category                                                  Premium segment                                                   Price brands
               2019 Q1                 FY 2018                                   2019 Q1                 FY 2018                               2019 Q1                  FY 2018
  0%                                                                0%                                                           20%

                                                                                                                                 15%
 -2%                                                               -5%
                                                                                                                                 10%

                                                                                                                                   5%
 -4%                                                              -10%
                                                                                                                                   0%
                Market           Swedish Match                                     Market           Swedish Match                                 Market             Swedish Match
 -6%                                                              -15%                                                            -5%

*On reported basis. Excludes Co-Pack volumes. **12 months rolling ending March 31, 2019.   Source: CMPP. Price brands = Price Large Segment + Price Small Segment.

                                                                                                                                                                                     15
LIGHTS: Q1 COMMENTARY

Sales up on higher volumes. Prior year included 12 MSEK in restructuring charges
o Sales up 10%, with sales growth driven by lighters and complementary products
  -   Sales for matches flat on 2% higher volumes.
  -   Lighter volumes up 8% and favorable market mix.
  -   Favorable currency effects.
o Operating profit up slightly when adjusting for prior year restructuring
  -   For lighters, higher raw material costs (nylon) substantially offset benefit of stronger sales.
  -   For matches, currency effects more than compensated for an otherwise weaker price/mix.
  -   Operating profit for complementary products flat.

                               Q1-2019   Q1-2018   chg   April 2018-March 2019   Full year 2018   chg
Sales, MSEK                        314       285    10                   1,275            1,246     2
Operating profit, MSEK              43        31    40                     201              189     7
Operating margin, %               13.8      10.9                          18.1             15.2

                                                                                                        16
REGULATORY EVENTS

o Statement from FDA on flavored cigars
  On March 13, 2019, the FDA released a draft guidance document which includes the intent to move forward with a
  proposed rule to ban all flavors in cigars. It is further stated in this draft guidance document that flavored cigars
  should no longer be subject to the extended compliance date (August 2021) for substantial equivalence (SE)
  authorization – regardless of the location in which the products are sold. The original deferral of the compliance
  date acknowledged that the FDA had not provided sufficient guidance on SE filing requirements. Under the revised
  compliance policy, the draft guidance states that 30 days after the guidance is finalized, any flavored cigars (other
  than tobacco-flavored) that were on the market on August 8, 2016, and that meet the definition of a new tobacco
  product, would be subject to enforcement absent SE preauthorization. The draft guidance would make it
  impractical for manufacturers to comply with the accelerated SE authorization timeline and was subject to a
  comment period. The form of the final guidance as well as its implementation timeline remain uncertain.
o Modified risk applications to the FDA
  On February 1, the FDA posted the final amendment for the modified risk tobacco product (MRTP) applications for
  eight snus smokeless tobacco products submitted by Swedish Match USA, Inc.
  On April 12, the FDA announced that any public comments on these applications must be submitted by May 13,
  2019. The timing on any final decision by the FDA on MRTP has not been communicated.

                                                                                                                      17
FINANCE NET AND EPS
                                             XX                                                                                    XX
                        Development of the finance net                                               Maturity profile of interest bearing liabilities
                                          By quarter                                                                Debt as of March 31, 2019
 MSEK                  Net finance cost                Net interest expense                 MSEK                             Fixed      Float
      0                                                                                     3 000
    -20
                                                                                            2 000
    -40
    -60
                                                                                            1 000
    -80
   -100                                                                                        0
          Q2 2017 Q3 2017 Q4 2017 Q1 2018 Q2 2018 Q3 2018 Q4 2018 Q1 2019                           2019   2020    2021     2022     2023       2024    2025    2026   2028

                                      EPS bridge                                                                          Net debt/EBITA
                              3M 2019 vs 3M 2018 (SEK)

                                                                                             2,5
               EPS 2018                                              4.36
          Operating profit                                           0.64                    2,0

          Financial items                                                   0.02             1,5
                                                                                     +19%
                 Tax rate                                           -0.01                    1,0                  2,2                                     2,1
 Chg in number of shares                                                      0.17
                                                                                             0,5
               EPS 2019                                                       5.17
                                                                                             0,0
                                                                                                              FY 2018                           12M ended March 31, 2019

                                                                                                                                                                              18
OUTLOOK STATEMENT
Swedish Match expects that the trend of increased interest from consumers, industry players and regulators in less
harmful alternatives to cigarettes will continue. By providing products that are recognized as safer alternatives to
cigarettes, our ambition is to create value for both shareholders and society.
For 2019, on a full year basis, Swedish Match expects the Scandinavian snus market to continue to grow and to
remain highly competitive. Swedish Match expects the US snus/nicotine pouch market to grow. In the US moist
snuff market, we expect continued growth for pouches. For US chewing tobacco we expect continued market
declines. In both Scandinavia and markets outside of Scandinavia, we expect segment growth and increased
competitive activity for nicotine pouches (both without tobacco and with small amounts of tobacco).
We will continue to explore growth opportunities for smokeless tobacco and nicotine pouch products outside
Scandinavia. In the US, we will broaden the distribution for ZYN, to make this popular nicotine pouch product
available to consumers nationally. Further for ZYN, selected additional geographies outside the US will be
considered. The decision to further scale up the investment in ZYN production capacity in the US is expected to
result in increased capital expenditures in 2019 compared to 2018.
For the full year, Swedish Match anticipates modest growth in the US cigar market. Swedish Match expects the US
cigar market to remain highly competitive.
The effective corporate tax rate in 2019, excluding associated companies and larger one-time items, is expected to
be in the 22 percent to 23 percent range (21.7).
The Company remains committed to returning cash not needed in operations to shareholders.

                                                                                                                     19
You can also read