Denver Gold Forum 2018 - VALUE THROUGH GOLD
←
→
Page content transcription
If your browser does not render page correctly, please read the page content below
VA L U E T H R O U G H G O L D

Denver Gold Forum 2018
                                        September 25, 2018

                                                          1
Cautionary Statement
  Forward-Looking Information
  This Presentation contains “forward-looking information” and “forward looking statements” within the meaning of applicable Canadian and
  United States securities legislation. Forward-looking information may include, but is not limited to, the anticipated production and
  developments in our operations in future periods, information with respect to our planned exploration and development activities, the
  adequacy of our financial resources, the estimation of mineral reserves and resources including the 2016 Valley of the Kings Mineral Resource
  estimate, realization of mineral reserve and resource estimates and timing of development of our Brucejack Project, costs and timing of future
  exploration, results of future exploration and drilling, production and processing estimates, capital and operating cost estimates, timelines and
  similar statements relating to the economic viability of the Brucejack Mine, timing and receipt of approvals, consents and permits under
  applicable legislation, our executive compensation approach and practice, the composition of our board of directors and committees and
  adequacy of financial resources. Wherever possible, words such as “plans”, “expects”, “projects”, “assumes”, “budget”, “strategy”,
  “scheduled”, “estimates”, “forecasts”, “anticipates”, “believes”, “intends”, “targets” and similar expressions or statements that certain actions,
  events or results “may”, “could”, “would”, “might” or “will” be taken, occur or be achieved, or the negative forms of any of these terms and
  similar expressions, have been used to identify forward-looking statements and information. Statements concerning mineral reserve and
  resource estimates may also be deemed to constitute forward-looking information to the extent that they involve estimates of the
  mineralization that will be encountered if the property is developed. Any statements that express or involve discussions with respect to
  predictions, expectations, beliefs, plans, projections, objectives, assumptions or future events or performance are not statements of historical
  fact and may be forward-looking information. Forward-looking information is subject to a variety of known and unknown risks, uncertainties
  and other factors that could cause actual events or results to differ from those expressed or implied by the forward-looking information,
  including, without limitation, those risks identified in our Annual Information Form dated March 28, 2018 filed on SEDAR at www.sedar.com
  and in the United States on Form 40-F through EDGAR at the SEC’s website at www.sec.gov. Forward-looking information is based on the
  expectations and opinions of our management on the date the statements are made. The assumptions used in the preparation of such
  statements, although considered reasonable at the time of preparation, may prove to be imprecise. We do not assume any obligation to update
  forward-looking information, whether as a result of new information, future events or otherwise, other than as required by applicable law. For
  the reasons set forth above, prospective investors should not place undue reliance on forward-looking information.
  Currency
  Unless otherwise indicated, all dollar values herein are in US $.

                                                                                                                                                       2
Notes to Investors
  National Instrument 43-101
  Technical and scientific information contained herein relating to the Projects is derived from National Instrument 43-101 (“NI 43-101”)
  compliant technical reports (“Reports”), “Measured, Indicated, and Inferred Mineral Resource Update” dated July 21, 2016, “Feasibility Study
  and Technical Report on the Brucejack Project, Stewart, BC” dated June 19, 2014, “Mineral Reserve Update” dated December 15, 2016, “capital
  cost update” dated February 3, 2017, and . We have filed the Reports and Update under our profile at www.sedar.com. Technical and
  scientific information not contained within the Reports for the Projects have been prepared under the supervision of Mr. Ivor W.O. Jones,
  M.S.c., FAusIMM, Cpgeo, Mr. Kenneth C. McNaughton, P.Eng., Ian Chang, P.Eng., Mr. Russell Pennel, B.A.S.c., P.Eng., and Mr. Lyle
  Morgenthaler, B.A.S.c., P.Eng. each of whom is an independent “qualified person” under NI 43-101.
  This presentation uses the terms “measured resources”, “indicated resources” (together “M&I”) and “inferred resources”. Although these
  terms are recognized and required by Canadian regulations (under NI 43-101), the United States Securities and Exchange Commission does
  not recognize them. Mineral resources which are not mineral reserves do not have demonstrated economic viability. The estimate of mineral
  resources may be materially affected by environmental, permitting, legal, title, taxation, socio-political, marketing, or other relevant issues.
  There is no guarantee that all or any part of the mineral resource will be converted into mineral reserves.
  In addition, “inferred resources” have a great amount of uncertainty as to their existence, and economic and legal feasibility. It cannot be
  assumed that all or any part of an inferred mineral resource will ever be upgraded to a higher category. Under Canadian rules, estimates of
  inferred mineral resources may not form the basis of feasibility or pre feasibility studies, or economic studies, except for a Preliminary
  Assessment as defined under NI 43-101. Investors are cautioned not to assume that part or all of an inferred resource exists, or is economically
  or legally mineable.
  Non-IFRS Financial Performance Measures
  The Company has included certain non-IFRS measures in this presentation. The Company believes that these measures, in addition to
  measures prepared in accordance with IFRS, provide investors an improved ability to evaluate the underlying performance of the Company
  and to compare it to information reported by other companies. The non-IFRS measures are intended to provide additional information and
  should not be considered in isolation or as a substitute for measures of performance prepared in accordance with IFRS. These measures do not
  have any standardized meaning prescribed under IFRS, and therefore may not be comparable to other issuers.
  The non-IFRS financial measures included in this presentation include: cash costs per ounce of gold sold, all-in sustaining cost per ounce of
  gold sold, adjusted earnings or loss, adjusted earnings or loss per share, and average realized price per ounce of gold sold. Please refer to the
  Non-IFRS Performance Measures section of the Company’s MD&A filed on SEDAR at www.sedar.com and in the United States on Form 40-F
  through EDGAR at the SEC’s website at www.sec.gov for a detailed discussion and reconciliation of the non-IFRS measures to the most
  directly comparable IFRS measures. The Company believes that in addition to conventional measures prepared in accordance with IFRS, the
  Company and certain investors and analysts use this information to evaluate the Company’s performance. In particular, management uses
  these measures for internal valuation for the period and to assist with planning and forecasting of future operations. The presentation of non-
  IFRS measures is not meant to be a substitute for the information presented in accordance with IFRS.

                                                                                                                                                      3
Established Intermediate Producer
First Year Success
2,700 tpd nameplate capacity
339,500 oz gold produced
97% average gold recoveries
Steady state production
Strong cash generation
~20 year mine life
Expansion on track
4
Low Cost Producer
Positioning Relative to Peers
               1600                           )
                          Pretivm First 12 Months Production vs Peers 2018 Production Guidance(1)

                              TMAC
               1400

                                                                                      Detour
               1200
 AISC2 (US$)

                                       Asanko

                                                                                                                    IAM Gold
               1000               Guyana             Torex
                                                              Leagold
                                                                         Alamos
                                Argonaut                     Eldorado
                                                  Semafo                                                               Yamana
                                                                              Endeavor
                                         Pretivm                                                                             B2 Gold          Randgold
                800                                                       Oceana
                                                                                     Kirkland

                              Alacer

                600

                400
                      0                 200                    400                    600                     800                      1000          1200
                                                       Gold Production (000’s oz)
 (1) Source: Company websites - 2018 guidance for AISC and gold production.
 (2) All-in Sustaining Cost (AISC) is non-IFRS performance measure. For reconciliation to IFRS measures refer to the Company’s MD&A.
 (3) Pretium first year production and AISC as reported from July 1, 2017 to June 30, 2018; see News Release dated Jul 9, 2018.
                                                                                                                                                            5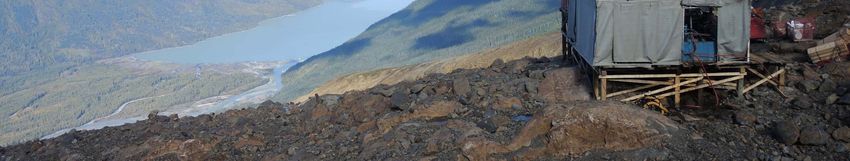
Building a Strong Cash Position

   2018 Summary
                                     Q1 2018
                           111,340 ounces       Q2 2018
                                          gold produced                                                                 H1 2018

   Gold Produced                                       75,689 oz                      111,340 oz                       187,029 oz
                           $146.5 million in revenue
   AISC per oz sold1                                 $1,009 /oz                       $648 /oz                         $783 /oz
                           $648 per ounce sold AISC1
   Revenue                                              $89.4 M                       $146.5 M                         $146.5 M
                           $47 million adjusted earnings1
   Adjusted Earnings                                     $5.8 M                         $47.0 M                        $52.8 M
                           $142.5 million cash at June 30, 2018
   Cash Balance                                         $70.5 M                       $142.5 M                         $142.5 M

    Source: See News Releases dated May 10, 2018 & Aug 9, 2018 and refer to Company’s Financial Statements and MD&A.
    (1) Non-IFRS performance measure. For reconciliation to IFRS measures refer to the Company’s MD&A.                              6
Strong Cash Generation
150% Increase in Cash in First Year of Operations

                                                                                                                                  $142.5 M
                            $140

                            $120
                                                         Q2 2017 – Q2 2018
                            $100
             Millions USD

                             $80

                             $60

                             $40

                             $20

                              $0

                            -$20
                                   Q2 2017                 Q3 2017                 1Q4 2017                  Q1 2018                  Q2 2018

                                                            Cash Balance                 Working Capital

     Source: See News Releases dated Aug 10, 2017, Nov 10, 2017, Mar 8, 2018, May 10, 2018 & Aug 9, 2018 and refer to Company’s Financial Statements and MD&A.
     (1) Working Capital excludes current portion of long-term debt                                                                                              7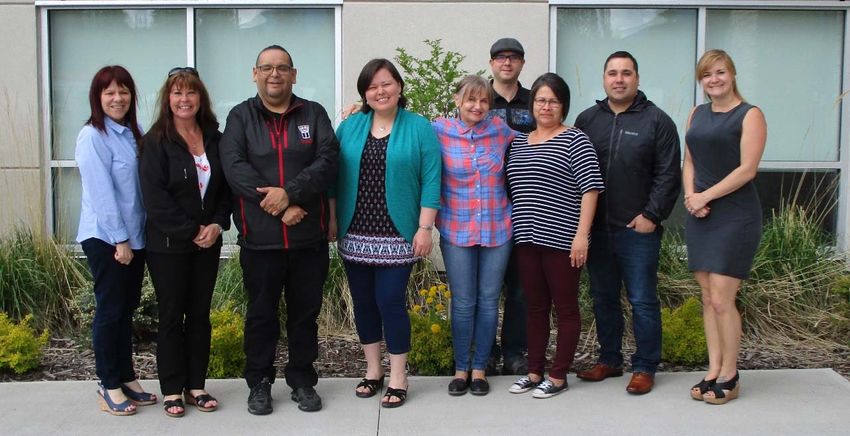
First Year Production Profile

                      Brucejack Monthly Gold Production1
                                                        Q3 2017 – Q2 2018
      45,000                                                                                                                                     18

      40,000                                                                                                                                     16

      35,000                                                                                                                                     14

      30,000                                                                                                                                     12

      25,000                                                                                                                                     10

      20,000                                                                                                                                     8

      15,000                                                                                                                                     6

      10,000                                                                                                                                     4

       5,000                                                                                                                                     2

            0                                                                                                                                    0
                    Jul      Aug        Sep        Oct      Nov        Dec        Jan        Feb       Mar       Apr       May         Jun

                                                           Gold Ounces                    Grade

       (1) See News Release dated Oct 11, 2017, Mar 8, 2018, Apr 11, 2018 & July 9, 2018 and refer to Company’s Financial Statements and MD&A.
                                                                                                                                                      8
Delivered on H1 Guidance;
H2 On Track

          2018 Gold Production                                                                                                AISC
             Guidance (oz)                                                                                           ($ per oz sold)1
450,000
                                                                                                                              H1 2018
400,000                                                    407,000                                                            $783
           FY 2018 Guidance                                                                                             770
                                                           387,000
350,000                                                                                                H2 2018
                                                                                                      Guidance
300,000                                                      H2 2018 Guidance
                                                                                                            710
                                                           200,000-220,000 oz
250,000                                                                                                      700                        900

200,000                                                      H1 2018 Production

150,000
           H1 2018 Guidance                                       187,029 oz

100,000

 50,000

     0

           Source: See News Releases dated May 10, 2018 & Aug 9, 2018 and refer to Company’s Financial Statements and MD&A.
           (1) Non-IFRS performance measure. For reconciliation to IFRS measures refer to the Company’s MD&A.                                 9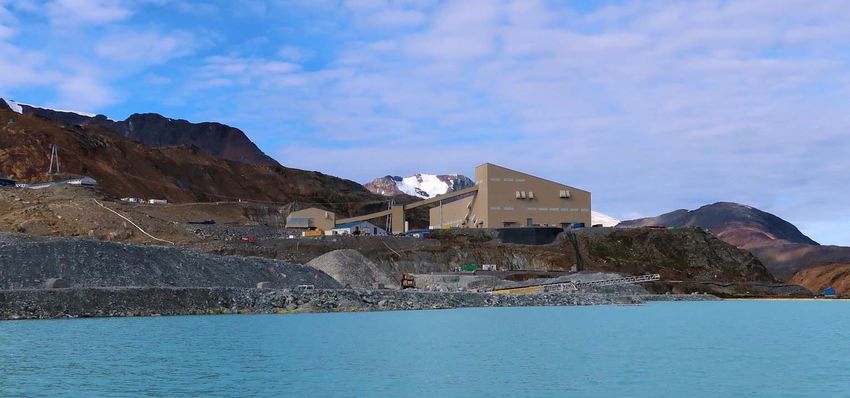
High-Grade Gold:
Ubiquitous but variable

+1410

 +1320

                                                                              Valley of Kings Mineral Reserve Estimate (LOM)1
                                                                                                                  Contained
                                                                               Category Tonnes Gold Silver Gold Silver
                                                                                          (mil)   (g/t)   (g/t) (mil oz) (mil oz)
 +1200
                                                                               Proven      3.3    14.5 12.9       1.6      1.4

                                                                                                                        Grade

                                                                           Valley of Kings                                20 g/t

                                                                                                                          15 g/t
                                                                            Block Model                         N
                                                                                                                          10 g/t
Meters
ASL
                                                                                                                          5 g/t
                                                                                        Meters
    (1) Mineral Reserve Update, see news release dated December 15, 2016                                                          10
High-Grade Gold:
Ubiquitous but variable
First 12 Months of Production –
Valley of Kings Mined Stopes
+1410
+1320
+1200
Mined Stopes
Meters Underground
ASL Development
11Community Engagement
Collaborative training and employment initiatives with local First
Nations and regional community development offices
Promote resource sharing to address common community
challenges and successful approaches
Focus on removing barriers to employment, supporting skills
development and employment preparedness
12High Level of Local Employment
Brucejack Mine Workforce:
Brucejack
Mine
81% British Columbia
50% Northwest British Columbia
25% First Nations (Pretium)
33% First Nations (including contractors)
As of June 2018 13Organic Growth Opportunities
14Mill Throughput Increase to 3,800 tpd
Low Capital Investment of ~US$25M : 40% Increase in Production Rate(1)
One Third of Total Two Thirds of Total
Gold Production Gold Production
96.7% GOLD RECOVERY (LOM)
(1) Increase production rate to 3,800 t/d from 2,700 t/d. Pending permit application approval; see News Release dated Dec 21, 2017. 15Reserve Expansion Potential
East, West and at Depth
Flow Dome
Zone Drilling3 N Mineral Resource1
Mineral Reserve2
Exploration Potential
Open SU‐657
9.0m @21.87 g/t Au
(Inc 0.5m @ 203 g/t Au
SU‐666 Au (g/t)
2.05m @2,100 g/t Au 0.5‐1.0
(Inc 0.5m @ 8,600 g/t Au
1.0‐5.0
2018
Anomalous 5.0‐20.0
Exploration
>20.0
Drill Holes4 Cu and Mo
500 m
(1) Outline of Measured, Indicated, and Inferred Mineral Resource as at 21 July 2016.
(2) Outline of Proven and Probable Mineral Reserve, based on June 19, 2014 Feasibility Study
(3) 2015 Regional Drill program; see News Release dated Oct 8, 2015.
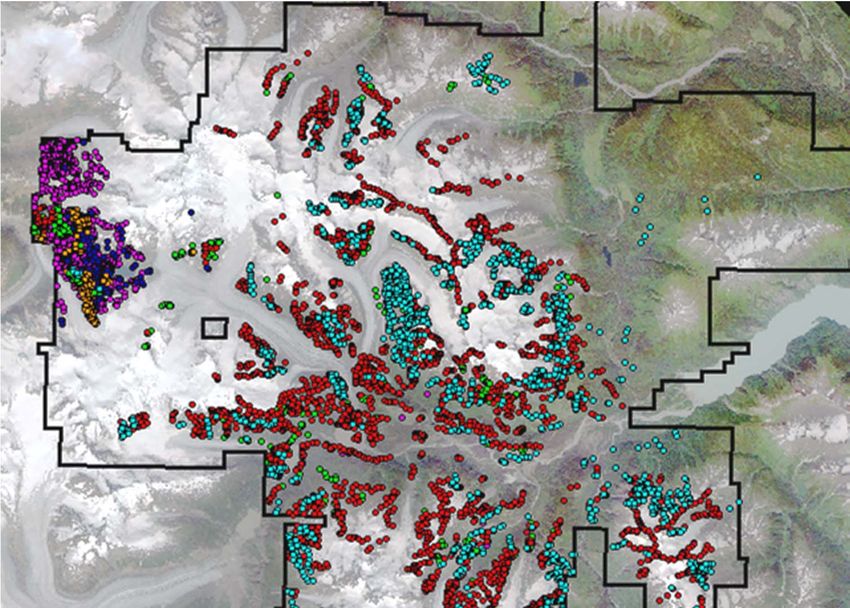
(4) 2018 Underground Exploration Drilling; see News Release dated June 18, 2018. 16Bowser Regional Exploration
Brucejack N
Boulder
Zone
30 km Koopa
Zone
Pretivm
Claim Outline
Surface
Sampling Bluffy
American
2017 Zone
2016
Creek Zone
2015
2014
2011/135km 5 km
Pre 2011
Regional exploration program; see News Release dated Dec 5, 2017 17Construction Financing Structure
Credit Facility1
– $350M at 7.5% interest $423M due Dec 31, 2018
– Extendable to Dec 31, 2019 with payment of 2.5% of
principal and interest
Precious Metals Stream1,2
– 1st repurchase opportunity $237M on Dec 31, 2018
– 2nd repurchase opportunity $272M on Dec 31, 2019
(1) See News Release dated Sept 15, 2015
(2) Capped at 7.067 M oz and 26.279 M oz refined gold and silver, less production to Dec 31, 2019. Based on refined gold and silver that were
estimated to be available for sale in the June 2014 Feasibility Study for the Brucejack Project
182018 Catalysts
Repurchase Stream
Notice given to repurchase precious
metals stream
Cash flow from operations
Refinance Credit Facility
Process underway to refinance in
Q4/18
Deliver on Guidance
On track for H2/18 guidance
19Questions
pretivm.com PVG : TSX/NYSE
20Shareholding & Analyst Coverage
Equity Structure(1) (shares in millions) Top Shareholders(2)` (% S/O)
Issued & Outstanding 183.3 Black Rock Asset Management 14.9
Fully Diluted 194.2 Van Eck Associates 12.6
Market Cap (September 21, 2018) US$1.48 B Letko, Brosseau & Associates 4.7
Rothschild Asset Management 3.7
Wellington Management 3.4
BMO Asset Management 3.2
Analyst Coverage Orion Mine Finance 2.5
BMO Andrew Kaip Sun Valley Gold 2.2
Canaccord Genuity Rahul Paul Vanguard Group 2.2
CIBC David Haughton Pretivm Management 1.9
Citi Alexander Hacking
Cormark Securities Richard Gray
Global Mining Research David Radclyffe
H.C. Wainwright Heiko F. Ihle
Numis Jonathan Guy
RBC Dan Rollins
Roth Capital Partners Joseph Reagor
Scotiabank Ovais Habib
(1) As of Sept 21, 2018; ownership calculated on an undiluted basis.
(2) As of Sept 21, 2018. Source: IPREO, Morningstar Inc. & SEDAR.
21Brucejack Mine
Phone: 604-558-1784 Pretium Resources Inc.
Fax: 604-558-4784 Suite 2300 – 1055 Dunsmuir St.
Toll-free: 1-877-558-1784 Four Bentall Centre
PO Box 49334
invest@pretivm.com Vancouver, BC, Canada V7X 1L4
pretivm.com PVG : TSX/NYSE
22You can also read