Webcast Presentation August 2021 - Watermark Lodging Trust
←
→
Page content transcription
If your browser does not render page correctly, please read the page content below
Webcast Presentation August 2021
Forward Looking Statements
This presentation may contain certain forward-looking statements, including statements with regard to the future performance of
Watermark Lodging Trust, Inc.

These forward-looking statements generally are identified by the words “believe,” “project,” “expect,” “anticipate,” “estimate,”
“intend,” “strategy,” “plan,” “may,” “should,” “will,” “would,” “will be,” “will continue,” “will likely result,” and similar expressions.
These statements are based on the current expectations of our management. Forward-looking statements in this Report include,
among others, statements regarding: the impact of the merger of CWI 1 and CWI 2 and management internalization that occurred
in April 2020, the impact of the July 2020 capital raise, our expectations regarding the impacts on our business of the outbreak of
the novel coronavirus (“COVID-19”) pandemic and the impact of hurricanes and other natural disasters on certain hotels,
including the condition of the properties and cost estimates.

It is important to note that our actual results could be materially different from those projected in such forward-looking statements.
You should exercise caution in relying on forward-looking statements, as they involve known and unknown risks, uncertainties,
and other factors that may materially affect our future results, performance, achievements or transactions. Information on factors
that could impact actual results and cause them to differ from what is anticipated in the forward-looking statements contained
herein is included in in our filings with the Securities and Exchange Commission (“SEC”), including but not limited to those
described in Part I, Item 1A. Risk Factors in our Annual Report on Form 10-K for the year ended December 31, 2020, as filed with
the SEC on March 12, 2021 and subsequent quarterly reports. Moreover, because we operate in a very competitive and rapidly
changing environment, new risks are likely to emerge from time to time. Given these risks and uncertainties, shareholders are
cautioned not to place undue reliance on these forward-looking statements as a prediction of future results, which speak only as
of the date of this presentation, unless noted otherwise. Except as required by federal securities laws and the rules and
regulations of the SEC, we do not undertake to revise or update any forward-looking statements.

                                                                                                                                             2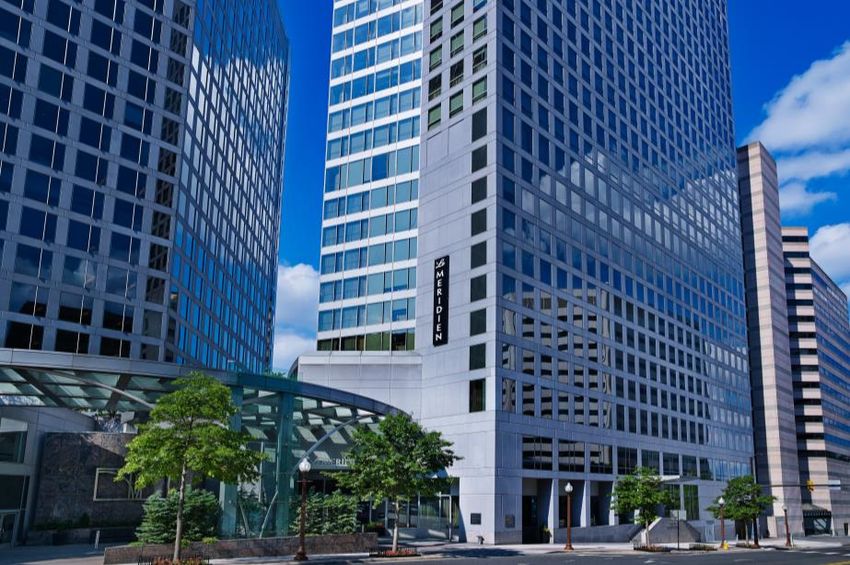
Agenda

• Business Update

• Company Overview

• Financial Performance

• Lodging Industry Outlook

• Looking Forward

• Q&A

                             3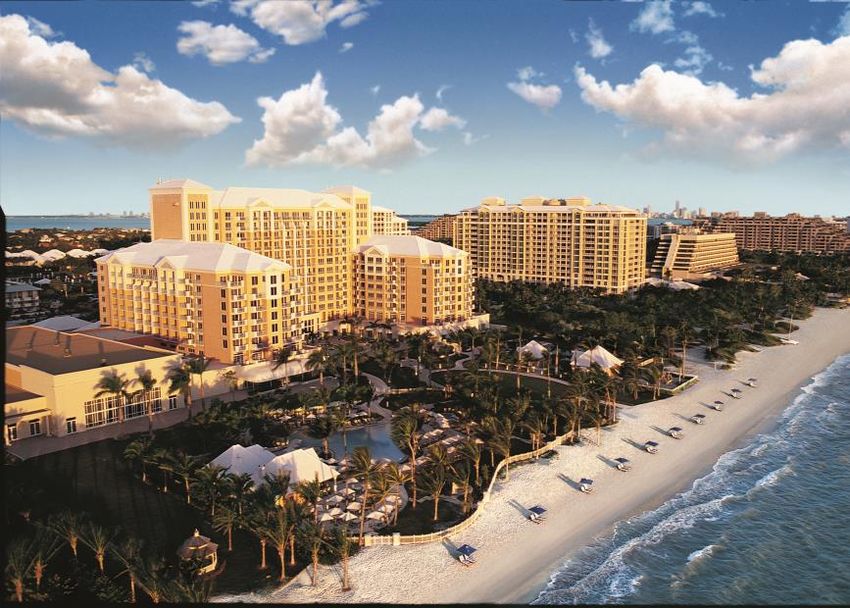
Business Update

                  4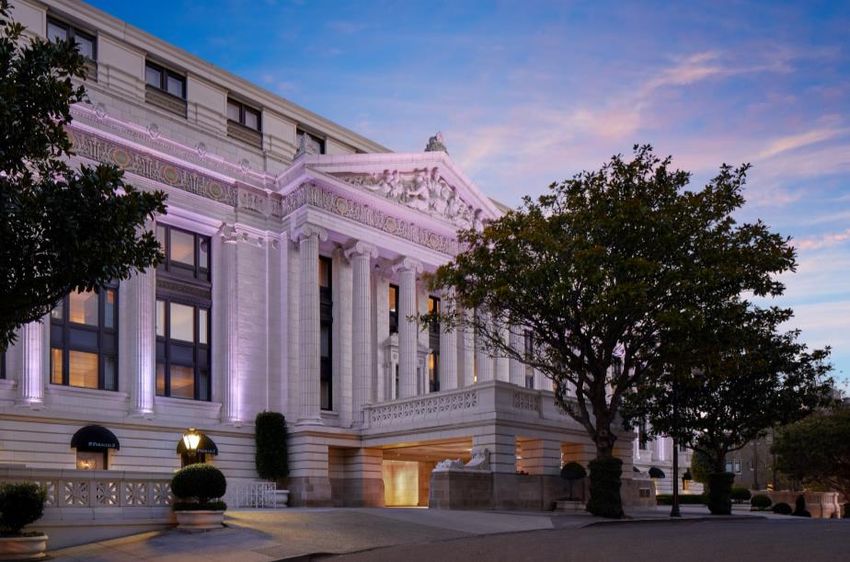
Business Update
WLT continues to make significant progress to protect shareholder value in the lodging
industry’s recovery from the COVID-19 pandemic

                                                                                         Hotel Operating Trends

                         • All hotels are currently open and working to return to normal operations
                         • Acceleration in demand increased portfolio occupancy from 20% in January to almost 60% in June
                         • Profitability improving with over 80% of hotels achieving break-even NOI in June & July
                         • Rise in COVID-19 cases including the delta variant now presenting near-term uncertainty

                                                                                       Asset Transaction Activity

                         • Continued progress toward disposing non-core assets that are not consistent with overall strategy
                              o Closed the sale of Sheraton Austin Hotel at the Capitol for net proceeds of approximately $36 million(1)
                              o Sold Courtyard Pittsburgh Shadyside for net proceeds of approximately $3 million

                         • Purchased joint venture partner’s interest in Hyatt Centric French Quarter New Orleans
                              o Opportunity to eliminate JV structure at an attractive price for hotel at unparalleled location

                                                                                        Managing Debt Portfolio

                         • Completed refinancings or extensions on 6 near-term loan maturities year-to-date
                         • Only 3 loans or 6% of total indebtedness have maturity dates remaining in 2021

                                                                                                                                           5
  (1)   WLT held an 80% interest in the Sheraton Austin Hotel at the Capitol joint venture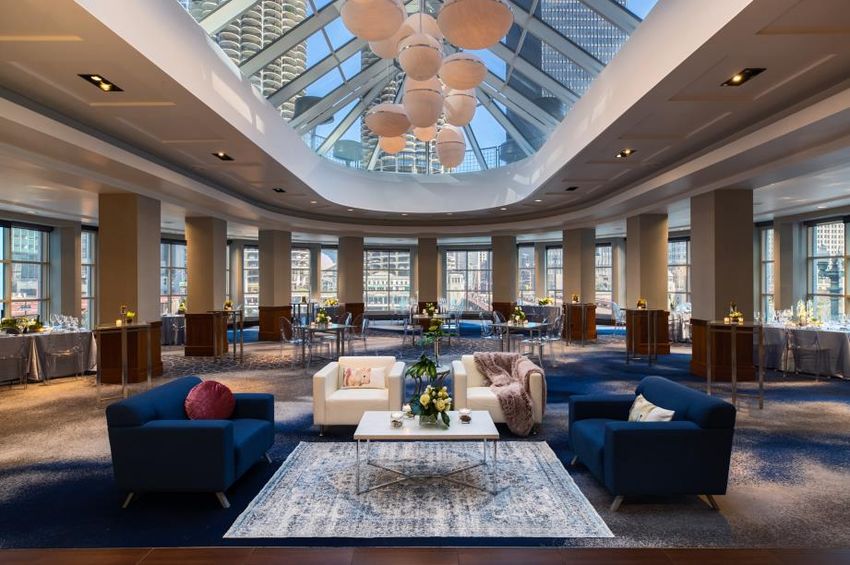
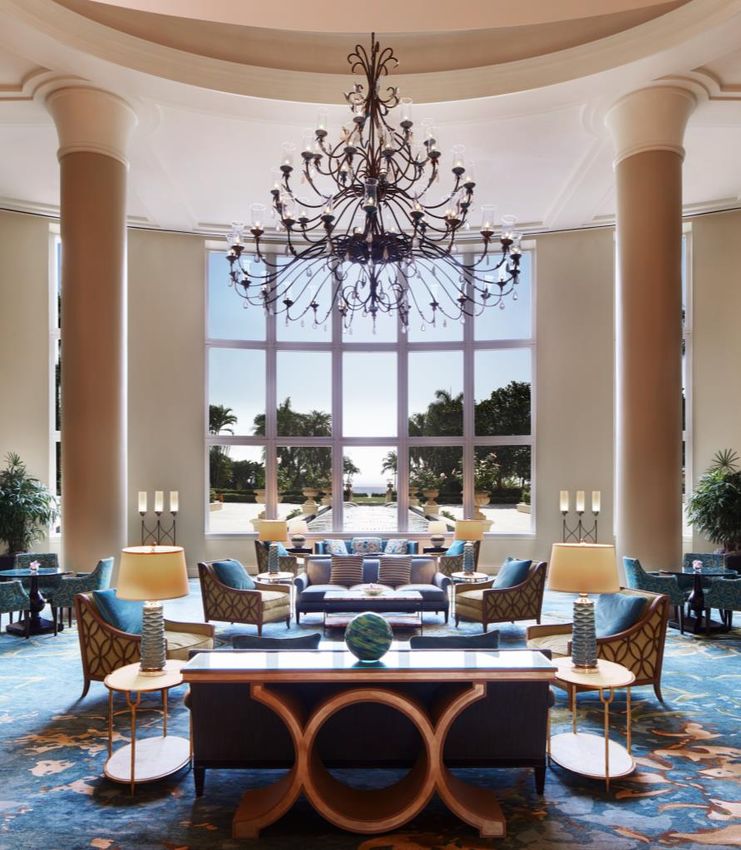
Resorts Leading
   Portfolio Recovery

   • Hawks Cay Resort
   • Sanderling Resort
   • The Ritz-Carlton, Fort Lauderdale
   • The Ritz-Carlton Key Biscayne, Miami
   • The Ritz-Carlton Bacara, Santa Barbara

                                               6

(hotels shown left to right / top to bottom)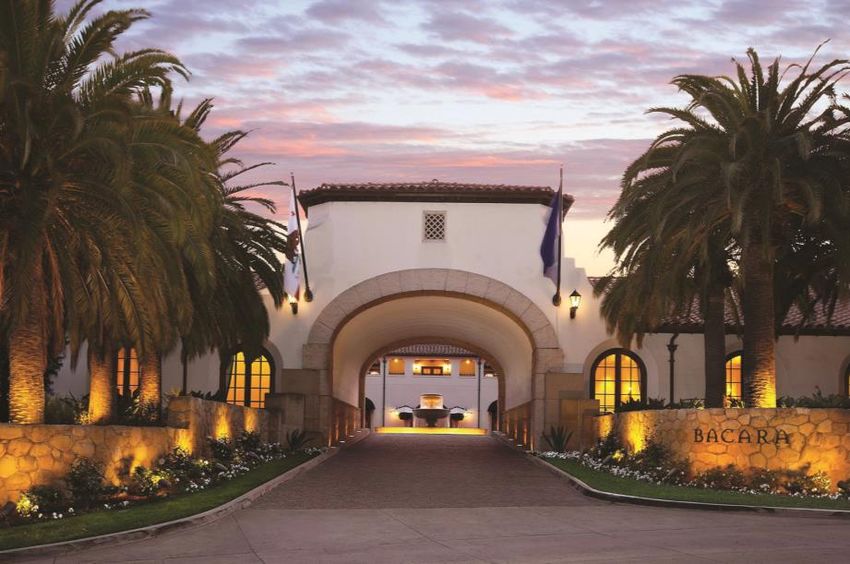
Company Overview

                   7
Premier Non-Traded Internally Managed Lodging REIT
Portfolio of High-Quality Assets in High Barrier to Entry and Growth Markets(1)

                      29                                              $3.6 billion                                                            9,102
                 Properties                                                      Asset Value(2)                                                      Rooms

                                                                                                                                                             77%
                    54%
                                                                                                                                                        Sunbelt Region(3)
        Top 25 Markets(3)

  (1)   Portfolio as of June 30, 2021, adjusted for the sale of Courtyard Pittsburgh Shadyside, which closed in July 2021                                                                8
  (2)   Asset Value based on independent third-party appraised values as of September 30, 2020; includes non-affiliated third-party interests in joint ventures of approximately $160m
  (3)   Percentages based on independent third-party appraised values as of September 30, 2020
Well-Positioned Portfolio With Mix Of Property Types

                          40%                                                         52%                                                           8%

                       Resort                                                   Full-Service                                                Select-Service
  • Primarily in premier drive-to leisure                       • Unparalleled locations in gateway                            • Located primarily in high growth
    markets in Florida and California                             and growth markets                                             urban areas

  • Best performing and most sought-                            • Iconic properties that would be                              • Most efficient and highest margin
    after property type in current                                difficult to replicate today                                   property type
    environment
                                                                • Temporarily impacted by pandemic                             • Not heavily reliant on group
  • All resorts have completed                                    due to reduction in business and                               business
    renovation projects in the last three                         group travel
    years and are in excellent physical                                                                                        • Appeal to a broad customer base
    condition

                                                                                                                                                                                    9
  Note: Portfolio as of June 30, 2021, adjusted for the sale of Courtyard Pittsburgh Shadyside, which closed in July 2021; Percentages based on independent third-party appraised
  values as of September 30, 2020
Established and Trusted Brands

•   Over 90% of hotel portfolio is partnered with
    major brands

•   Brand standards instill consumer confidence in
    product quality including service levels and
    cleanliness

•   Affiliated loyalty programs drive demand and
    customer preference

•   Leveraging robust marketing and advertising
    platforms to capture superior revenue streams

                                                                                                                                                                                     10
    Note: Portfolio as of June 30, 2021, adjusted for the sale of Courtyard Pittsburgh Shadyside, which closed in July 2021; Percentage based on independent third-party appraised
    values as of September 30, 2020
High-Quality Portfolio of Lodging Properties
Collection of best-in-class assets in high-end segments of the U.S. Lodging Industry(1)
Upper- Total WLT
Luxury(2) Upscale(3)
Upscale Portfolio
# of Hotels 9 15 5 29
% of Portfolio(4) 45% 45% 10% 100%
Occupancy
66.7% 77.0% 84.7% 75.0%
2019(5)
RevPAR
$275 $160 $183 $195
2019(5)
(1) Portfolio as of June 30, 2021, adjusted for the sale of Courtyard Pittsburgh Shadyside, which closed in July 2021; Based on STR segmentation grouped primarily according to actual
average room rates
(2) Luxury includes three independent hotels: Hawks Cay Resort, The Equinox Golf Resort & Spa and Sanderling Resort
(3) Upscale includes one Upper Midscale property: Holiday Inn Manhattan 6th Avenue Chelsea
11
(4) Portfolio percentages weighted based on independent third-party appraised values as of September 30, 2020
(5) Portfolio performance based on full year 2019 actualsIndustry Leading Management Team
WLT internalized management and became self-managed in April 2020
• Recognized industry experts with decades of
experience in lodging real estate
– Expertise in every aspect of lodging investment including
acquisitions, financing, asset management and property
operations, capital projects, restructurings and M&A
• Transition to internalized management structure
resulted in a significant cost reduction and
enhanced shareholder alignment
– Elimination of Advisor fees and cash flow participation
– Internally managed companies are historically valued
favorably compared to externally managed companies
12Financial Performance
13WLT Asset Recovery
Hotel performance continues to improve in 2021 with over 80% of hotels achieving
break-even NOI in June & July
Number of WLT Hotels
35
Open Breakeven NOI Breakeven After Debt Service
30
29
29 29 29 29 29 29
28 28 28 28 28 28 28 28
25 26
25
24
20 21
19
15 16 16
14
13 13
12
10 11 11
9
8
7 7
5 6
5 5
4 4 4
3 3 3 3 3
2 2
1 1
0
Apr-20 May-20 Jun-20 Jul-20 Aug-20 Sep-20 Oct-20 Nov-20 Dec-20 Jan-21 Feb-21 Mar-21 Apr-21 May-21 Jun-21 Jul-21
14
Note: Portfolio as of June 30, 2021, adjusted for the sale of Courtyard Pittsburgh Shadyside, which closed in July 2021Second Quarter 2021 Performance Metrics
Comparable Consolidated Hotels(1)
Q2 Q2 Q2
%▲ %▲
2021 2020(1) 2019(1)
Occupancy(2) 52.4% 8.5% +516% 78.2% (33%)
ADR(3) $250.63 $191.98 +31% $262.24 (4%)
RevPAR(4) $131.22 $16.25 +708% $205.18 (36%)
(1) Represent statistical data for Consolidated Hotels we owned as of June 30, 2021 but excluding those hotels that we classified as held for sale. Statistical data prior to our
ownership was included for hotels that were not owned for the entirety of the comparable periods
(2) Occupancy is the percentage of rooms sold divided by rooms available
(3) ADR (Average Daily Rate) is room revenue divided by rooms sold, displayed as the average rental rate for a single room
(4) RevPAR (Revenue per Available Room) is room revenue divided by available rooms
15Second Quarter 2021 Financial Results
Financial results show improvement year-over-year however significantly below 2019
($ in millions) Q2 Q2 Q2
$▲ $▲
2021 2020 2019(1)
Hotel Revenues $163.7 $20.3 +$143.4 $261.1 ($97.4)
Hotel Operating Expenses(2) ($127.2) ($51.6) ($75.6) ($185.4) +$58.2
Hotel Revenues Less Expenses $36.5 ($31.3) +$67.8 $75.7 ($39.2)
MFFO(3) ($2.7) ($47.5) +$44.8 $37.8 ($40.5)
(1) 2019 Hotel revenues and operating expenses and MFFO based on consolidated results in SEC filed reports for CWI 1 and CWI 2 combined
(2) Adjusted for addback of depreciation and amortization of $28.8m, $31.9m and $31.7m in 2Q21,2Q20 and 2Q19, respectively
(3) Modified Funds From Operations 16Balance Sheet and Liquidity
Continued focus on liquidity and improving balance sheet flexibility
Liquidity Profile(1) Mortgage Debt(1)
• Sufficient liquidity to meet our obligations in this current • $2.2 billion of mortgage debt outstanding with weighted average
operating environment interest rate of 4.2%
• Available liquidity of ~$265 million, primarily cash on hand • Refinanced or closed extensions on 6 mortgage loans year-to-
and available Series B preferred equity draws date with near-term maturities
• Additional $115 million of cash held in escrow reserves to • Proactively addressing loans maturing in 2021 and 2022
fund future renovations and other fixed expenses(2)
• Continue evaluation of the turn-over of select hotels to their
• No additional Series B preferred equity draws since closing mortgage lenders
of strategic financing in July 2020
Mortgage Debt Maturity Profile
In millions
Cash Preservation Initiatives $1,400
$1,239
• Significantly reduced hotel and corporate expenses to $1,200
minimize monthly burn rate $1,000
• Suspended common distributions in March 2020 $800
$614
• Suspended redemption program including special $600
circumstance redemptions
$400
$233
$200 $144
$0
2021 2022 2023 2024
(1) As of June 30, 2021 including mortgage debt associated with one unconsolidated hotel, adjusted for the sale of Courtyard Pittsburgh Shadyside, which closed in July 2021 17
(2) Not all of which is available for immediate useLodging Industry Outlook
18U.S. Lodging Industry Recovery Variables
The speed of the lodging industry recovery is dependent on a myriad of factors
International
Travel
Virus Cases Group and
Consumer Business
Including New
Sentiment Demand
Variants
Travel and Social Distancing
Mobility and Capacity
Restrictions Restrictions
Return to Labor
Office Challenges
Vaccinations
19U.S. Lodging Industry Recovery Forecasts
RevPAR recovery is estimated to take over three years
Indexed RevPAR
(2019 = 100%)
110%
2019 RevPAR = 100% 98%
100%
88%
90%
87%
80%
73%
75%
70%
60%
61%
50%
50%
40%
2019 2020 2021 2022 2023 2024
Actual Actual Est. Est. Est. Est.
CBRE STR HVS
Source: CBRE U.S. Hotels State of the Union published July 1, 2021, STR / Tourism Economics press release published August 12, 2021, and HVS Outlook Report published
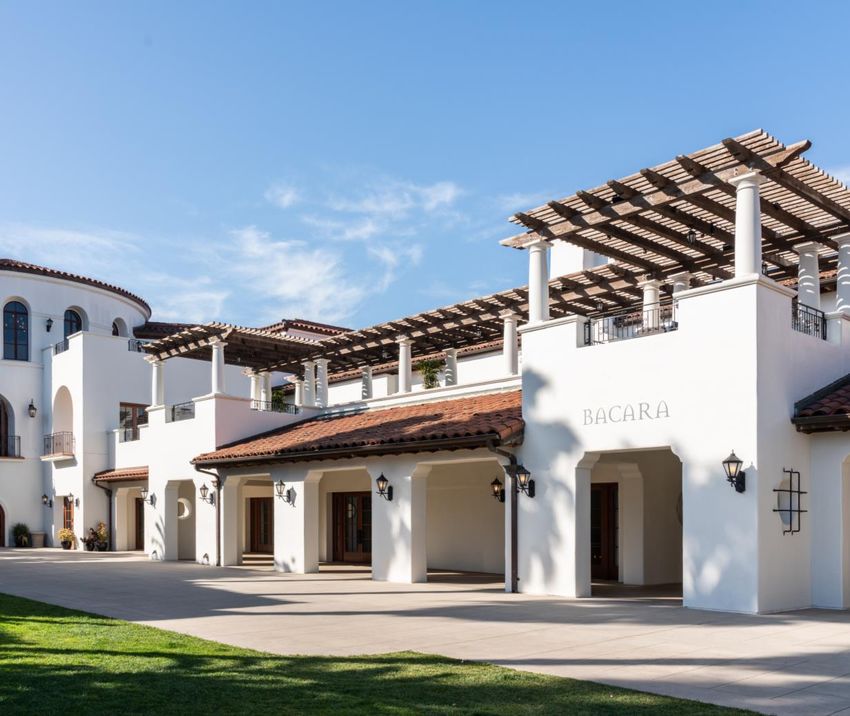
January 2021 20Higher-End Segments Historical Outperformance
Demand for Luxury and Upper Upscale hotels have outperformed the broader industry
Average Change in Demand
(2007 – 2019)
3.5%
WLT Composition
3.0% 45% Luxury
45% Upper Upscale
2.5%
2.0%
3.3%
1.5%
1.0% 2.1%
1.8%
0.5%
0.0%
U.S. Luxury Upper Upscale
Industry Segment Segment
21
Source: PwC Hospitality Directions US – Outlook TablesLooking Forward
22Looking Forward
Maintain focus on • Capitalize on anticipated high-growth lodging industry
recovery through aggressive asset management
protecting and enhancing
• Continue to manage liquidity
shareholder value
• Extend and refinance mortgages with near-term
maturities
• Plan on releasing an updated NAV as of Dec. 31, 2021,
in conjunction with 10-K filing in early 2022
• Pursue accretive growth opportunities with the
acquisition capital provided by the July 2020 strategic
financing transaction
• Prepare portfolio and balance sheet for an ultimate
shareholder liquidity event while monitoring market
conditions
23You can also read