INVESTOR PRESENTATION - Greg Palaschuk, EVP & CFO Juan Pablo Amar, President, Finning South America May 28, 2021

Page created by Troy Cohen
 
CONTINUE READING
INVESTOR PRESENTATION - Greg Palaschuk, EVP & CFO Juan Pablo Amar, President, Finning South America May 28, 2021
INVESTOR PRESENTATION
Greg Palaschuk, EVP & CFO
Juan Pablo Amar, President, Finning South America

May 28, 2021

See slides 9 and 10 for important information on forward-looking information, currency, non-GAAP financial measures, and sources in this presentation
INVESTOR PRESENTATION - Greg Palaschuk, EVP & CFO Juan Pablo Amar, President, Finning South America May 28, 2021
Finning Overview
                             Largest Caterpillar dealer                                                                                                                                                                                                 Focus on Sustainability
                                                                                                                                                                                          Market Statistics(1) - FTT (TSX)
                             Unrivalled service since 1933                                                                                                                               Share price                                 32.40
                                                                                                                                                                                          Market Cap                                   5.3B
                             Diversified by geography, customer base, product, and sector
                                                                                                                                                                                          S&P/DBRS rating                      BBB+/high
                             ~12,000 employees at March 31, 2021                                                                                                                         Annual dividend / share                       0.82
                                                                                                                                                                                          Dividend yield                               2.5%

                                                                                                                                                      Bolivia                              2021 Q1 LTM Financial Statistics(2)
                                             YT                  NU                                                                                                                        Revenue                        6.2B
                                                           NWT                                                                                                                             Net revenue(3)                 5.8B
                                                                                                                                                                                           EBIT                          406M
                                                                                                                                                         Argentina
                                                                                                          United                                 Chile                                     EBITDA(3)                     715M
                                                                                                                                                                                                                (3)
                                              BC            AB                                           Kingdom                                                                           Adjusted EBITDA               636M
                                                                                            Ireland                                                      Santiago
                                                                     SK                                     Cannock                                                                        EPS                            1.53
                                                          Edmonton
                                                                                                                                                                                                          (3)
                                                                                                                                                                                           Adjusted EPS                   1.16
                                                  Vancouver                                                                                                                                                 (3)
                                                                                                                                                                                           Invested capital               3.2B
                                                  head office
                                                                                                                                                                                           ROIC(3)                     12.5%
                                                                                                                                                                                           Adjusted ROIC(3)            10.0%                            Visit our website for our 2020
                                                                                             Used       Rental    Fuel & other                                  Power                                                                                   Sustainability Report, which
                                   UK & Ireland                                                          3%            2%                                      Systems
                                      16%
                                                                                           equipment
                                                                                                                                                                 12%                                                                                    describes our alignment with GRI,
                                                                                              6%
                                                                                                                                                                                                                                                        SASB and TCFD frameworks and
                                                                                                                                                                                                                                                        our target to reduce our absolute
                                                                                                                                                                                                                                                        GHG emissions by 20% by 2027
                                                  Q1 2021 LTM             Canada                         Q1 2021 LTM                                             Q1 2021 LTM
                                                                                           New                                   Product                                                 Mining                                                         from our 2017 baseline(5)
                                                  net revenue              51%
                                                                                         equipment
                                                                                                        net revenue by           support                         net revenue by           48%
                                    South
                                                   by region(2)                             30%        line of business(2)         59%                          market segment(2)
                                   America                                                                                                           Core(4)
                                     33%                                                                                                              40%

    (1)   At May 21, 2021    (2)   Last 12 months ended March 31, 2021             (3)   This is a non-GAAP financial measure.             (4)Core market segment includes construction,           (5) This is forward-looking information. See slide

                                                                                         See slide 9 for more information                  forestry, pipeline, quarrying, waste management,        9 for more information.
2                                                                                                                                          industrial services, public services, and agriculture
INVESTOR PRESENTATION - Greg Palaschuk, EVP & CFO Juan Pablo Amar, President, Finning South America May 28, 2021
2021 Outlook and Profitability Drivers

             Equipment Backlog(1)                                               Codelco Order                                             Construction Rebuilds                         GHG Emissions
                   Q1 2021 vs Q4 2020                                                       797 trucks                                         Canada, certified rebuilds                Q1 2021 vs Q1 2020

                                       57%                                                           22                                           34                 21                                  11%
                                                                                    Subsequent to Q1 2021                                        Q1 2021             FY 2020

                                     Positive 2021 Outlook(2)                                                                                                        2021 Profitability Drivers

     Expect revenue growth in 2021 underpinned by strong backlog,                                                                      Operating leverage in a recovering market
      however, remaining below 2019 levels
                                                                                                                                        Product support growth in all regions
     Expect 2021 earnings to exceed 2019, despite slower than anticipated
      vaccine rollout in Canada and challenges related to COVID-19                                                                      Significant progress towards SG&A target

     Expect strong annual free cash flow(1) in 2021; EBITDA to free cash flow                                                          Effective allocation of capital
      conversion(1) modestly below 50% due to increased inventory purchases

                   Product Support Growth                                                          SG&A as % of Net Revenue(1)(2)                                              EBITDA to Free Cash Flow
                                                                                                                                                                                    Conversion(2)
                      Construction market share gains

                                                                                                                          ~17%                                                            ~50%
                       Mining upcycle capture                                                                              Mid-cycle target                                             2013 - 2020 average
                                                                                                                                                                                          Mid-cycle target

3   (1)   This is a non-GAAP financial measure. See slide 9 for more information.     (2)   This is forward-looking information. See slide 9 for more information.
INVESTOR PRESENTATION - Greg Palaschuk, EVP & CFO Juan Pablo Amar, President, Finning South America May 28, 2021
South America Overview
                 Business Overview                                                                                                                         Strong Growth Prospects(6)

                 Operating in Chile, Argentina, and Bolivia                                                       Revenue
                                                                                                                                                                             Chile GDP forecast to grow                                       US$34B Chile infrastructure
                                                                                                                 Q1 2021 LTM (1)
                 38 branches and 3 parts distribution centres                                                                                                               6.5% in 2021 vs 2020(2)                                          investment for 2020-2022(4)
                                                                                                                   ~$1.9B
                 Leading capabilities to serve global copper producers
                                                                                                                                                       Cu                                                                 Li
                 Diversified construction and power systems markets
                                                                                                                   Employees
                                                                                                                  March 31, 2021
                                                                                                                                                                7.2          Chile copper                                      ~ 25%          Global lithium
                                                                                                                                                                2027         production forecast(3)                                           production forecast(5)
                  across all countries                                                                                                                                                                                   2020 – 2025
                                                                                                                  ~5,280                                5.7                  million tons                                                     average annual growth rate
                                                                                                                                                        2020

                 Key Markets and Revenue Drivers

                                                                                     Q1 2021 LTM(1) revenue by country
                                                                                                                                                               Mining
                     Used              Rental
                                                                                                                                                            ~70%
                   equipment                                                         Chile                                                     85%
                                        2%
                      4%                                     New
                                                           Equipment            Argentina              13%                                                   of revenue(1)                    Open Pit                         Underground                 Gold / Iron Ore /
                                                              24%                                                                                                                             Copper                             Copper                     Silver / Lithium
                                                                                    Bolivia      2%
    Product                 Q1 2021      LTM(1)
    support                    revenue by
      70%                   line of business                                           Construction                  Power Systems

                                                                                          ~25%                             ~5%
                                                                                          of   revenue(1)                 of revenue(1)                        Mining                 Public/Private                                             Electric              Energy/
                                                                                                                                                                                                                         Forestry
                                                                                                                                                           Infrastructure             Infrastructure                                             Power                Oil & Gas
     (1)   Last 12 months ended March 31, 2021    (2)   Bloomberg
4    (3)   Cochilco. See slide 10 for more information.    (4)   Chile Ministry of Public Works. See slide 10 for more information.   (5)   Goldman Sachs Equity Research. See slide 10 for more information.   (6)   This is forward-looking information. See slide 9 for more information.
INVESTOR PRESENTATION - Greg Palaschuk, EVP & CFO Juan Pablo Amar, President, Finning South America May 28, 2021
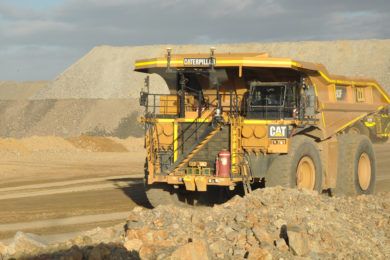
South America - Q1 2021 Financial Results

    Net Revenue                                                                                 EBITDA                                                                             Return on Invested Capital
    $ Millions                                                                                  Adjusted, $ Millions, as % of Net Revenue(1)                                       Adjusted, 4 Quarter Average
                                                                                                                                                                                                                    14.4%
                                                                                                                                                    12.8%
                                                                                                                                                                    20.0%

                                                                                                     12.4%                  12.2%                                                                         12.9%
                                                                                                                                                                    15.0%

                                                                                                                                                                                         12.2%
                                       496                     482
                                                                                           75

               478                                                                                                            61                      61
                                                                                                                                                                    10.0%

                                                                                                       60                                                           5.0%

                                                                                                                                                                    0.0%

                                                                                           50

                                                                                                                                                                    -5.0%

                                                                                                                                                                    -10.0%

                                                                                                                                                                    -15.0%

                                                                                           25

                                                                                                                                                                    -20.0%

                                                                                                                                                                    -25.0%

                                                                                            0                                                                       -30.0%

            Q1 2020                 Q4 2020                 Q1 2021                                 Q1 2020               Q4 2020                 Q1 2021                              Q1 2020           Q4 2020   Q1 2021

                                                                                                     7.8%                   8.3%                     8.6%
                                                                                                       Adjusted EBIT as % of Net         Revenue(1)

                                             Q1 2021 Commentary                                                                                                               Market Outlook(2)

     COVID-19 restrictions continued to impact mining operations and product                                                              Optimistic about mining recovery in Chile; actively quoting on multiple
      support revenue; Chile copper production down 2% from Q1/20, down 7%                                                                  RFPs for brownfield expansions and greenfield projects
      from Q4/20
                                                                                                                                           Expect mining product support to recover in the second half of 2021
     New equipment sales up 58% from Q1 2020 in functional currency, driven by
                                                                                                                                           Improved outlook for construction and power systems in Chile supported
      improved market activity and QB2 deliveries
                                                                                                                                            by infrastructure stimulus
     Higher profitability driven by improved execution to capture growth and
                                                                                                                                           Monitoring political and economic reform process, and upcoming customer
      increased efficiencies
                                                                                                                                            union negotiations
     Highest ROIC since Q3 2018

5   (1)   This is a non-GAAP financial measure. See slide 9 for more information. (2) This outlook information is forward-looking information. See slide 9 for more information.
INVESTOR PRESENTATION - Greg Palaschuk, EVP & CFO Juan Pablo Amar, President, Finning South America May 28, 2021
South America - Strong Growth Potential, Monitoring Uncertainty

                            Macro Economic Drivers                                                                                                               Profitability Drivers

                                                                                                                                                             SG&A as % of Net Revenue                                           Workforce

                                                                                                           Cost Reductions                                                     240 bps                                                   8%
                                                                                                                                                                    Q1 2021 vs Q1 2020                                    Q1 2021 vs Q1 2020
                            Electrification trend
                            Strong copper price
                            Copper production growth                                                                                                         Net Revenue per Employee(1)                                    Adjusted ROIC
                            Acceleration of mining capex                                                  New ERP System                                                         17 %                                                 220 bps
                            Infrastructure spending                                                                                                                   Q1 2021 vs Q1 2020                                  Q1 2021 vs Q1 2020

                            Renewable power sources
                            Lithium                                                                                                                                  Equipment Backlog                                                   22 x 797
                                                                                                           Strong Backlog Build                                                 ~100 %                                                     trucks

                                                                                                                                                                       Q1 2021 vs Q1 2020                                  Subsequent to Q1 2021
                             Chile elections & political landscape

                ?       
                        
                              Chile investment climate: taxes & royalties
                              Customer union negotiations & inflation                                                                                                 Customer Loyalty                                          EBIT Margin
                                                                                                           Improved Execution
                                                                                                                                                                                 ~15 %                                                  80 bps
                                                                                                                                                                           2020 vs 2019                                     Q1 2021 vs Q1 2020

6    (1)   This is a non-GAAP financial measure with no directly comparable IFRS measure. It is calculated as net revenue for the last three months / total number of employees at the period end. See slide 9 for more information.
INVESTOR PRESENTATION - Greg Palaschuk, EVP & CFO Juan Pablo Amar, President, Finning South America May 28, 2021
Next Phase of Mining Growth(1)
    Chile Copper Production Profile(2)                                                                                             Chile Copper Production Growth(2)                                    CAT Ultra Class Trucks
             8,000                                                                           7,248
             7,000                                                                                                                                                                                     Population            Average Age
                                                                                                                    1,682                                                                                 Trucks                  Years
             6,000
             5,000
                                                                                                                    1,421                                                   4 .0 %
    Ktonne

             4,000                                                                                                                                                    CAGR (2020-2027)
                                                                                                                                                                                                          228                    ~11
             3,000
             2,000                                                                                                   3,992                             0.6 %
             1,000                                                                                                                               CAGR (2010-2020)
                                                                                                                                                                                                       Includes 797, 795, 794, and 798 trucks
                 -
                     2019 2020 2021 2022 2023 2024 2025 2026 2027 2028 2029 2030 2031
                                    Current Operations           Brownfield Expansions               Greenfields

                                    Greenfield Projects – Opportunities(1)(3)                                                                                             Brownfield Projects - Opportunities(1)(3)

                                 QB2 / QB3                                                                  Taca Taca

                                  Santo                                                                                                                               Multiple Projects                         Los Pelambres
                                                                                                           Agua Rica
                                  Domingo

                                  Nueva                                                                 Filo Del Sol
                                  Union                                                                                                                                 Los Bronces                                Mantoverde

7      (1)   This is forward-looking information. See slide 9 for more information.   (2)   Cochilco. See slide 10 for more information.   (3)   Company reports. See slide 10 for more information.
INVESTOR PRESENTATION - Greg Palaschuk, EVP & CFO Juan Pablo Amar, President, Finning South America May 28, 2021
Winning Equipment Replacement and Greenfield Opportunities
                  Codelco - Radomiro Tomic (Replacement)                                Teck - QB2 (Greenfiled / Autonomy)

                   22 New Trucks                                                      Full Fleet
                                                    5-year Product                                                Support         5-year Product
                                                  Support Agreement                                              Equipment      Support Agreement

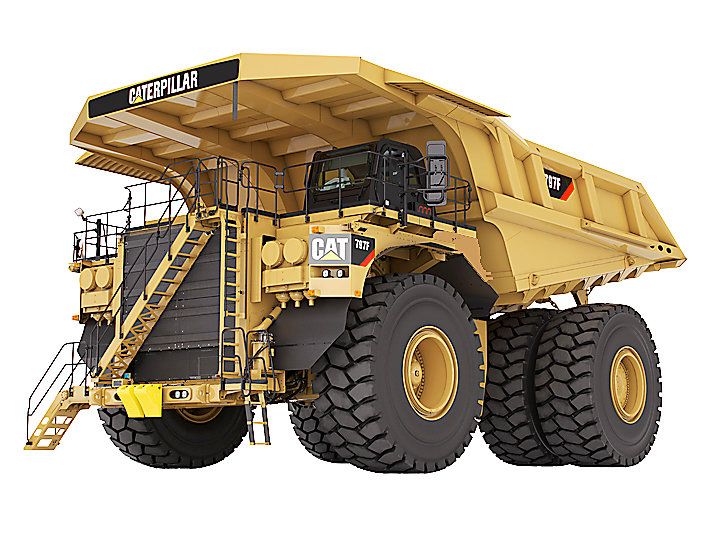
                    797F 400 Ton                                                    794AC 320 Ton
                   Mechanical Drive                                                  Electric Drive

                  Codelco - Ministro Hales (Autonomy Pilot)                      Caterpillar Autonomous Haulage System

            Product Support Agreement                    Autonomy Pilot       20%+ Productivity Improvement vs Conventional Fleet
                 5-Year Extension

    Ultra Class       Shovels          Support                                                                               INTEROPERABLE
                                                                                SCALABLE
      Trucks                          Equipment                                                                              with conventional and
                                                                                ~100 trucks and 250+ auxiliary
                                                                                vs limited scalability of                    competitors’ fleets
                                                                                competitors’ offering

                                                                                RETROFITTABLE                                FASTER
                                                                                                                             uses Lidar and Predictive
      39                 6            Multiple
                                       units
                                                        In partnership with
                                                            Caterpillar
                                                                                Caterpillar 789D, 793D,
                                                                                793F, 794, 797F                              Path to travel faster than
                                                                                Komatsu 930E-4                               competitors’ trucks
8
Disclosures
    Forward-looking information
    This presentation includes “forward-looking information” (as defined in applicable Canadian securities legislation) that is based on expectations, estimates and projections that we believe are reasonable as of the
    date of this presentation, but may ultimately turn out to be incorrect. Forward looking information in this presentation includes our target to reduce our absolute GHG emissions by 20% by 2027 from our 2017
    baseline on slide 2; our outlook for 2021 and our targets to achieve 17% SG&A as a percentage of net revenue and EBITDA to FCF conversion of ~50% in the mid-cycle on slide 3; the information under “Strong
    Growth Prospects” on slide 4; the information under “Market Outlook” on slide 5; the information on slide 7 regarding the next phase of mining growth in Chile, including the copper production profile for 2021
    to 2031, CAGR for 2020-2027 and opportunities related to greenfield and brownfield projects. No assurances can be given that the information in this presentation will result in sustained or improved financial or
    sustainability performance. This information has been provided to give information about our current expectations and plans and is accurate at the time of presentation, but may later be superseded by more
    current information. Except as required by law, we do not undertake any obligation to update the information.
    Forward-looking information is subject to known and unknown risks, uncertainties and other factors, and is based on a number of assumptions that we believe are reasonable as of the date of this presentation,
    which may cause our actual results, performance or achievements to be materially different from any future results, performance or achievements expressed or implied by the forward-looking information.
    Assumptions on which the forward-looking information is based include but are not limited to assumptions that: we will be able to execute on our strategic plans, take advantage of growth opportunities, including
    those that may come from the growth prospects listed on slide 4 and the greenfield and brownfield projects listed on slide 7, control our costs, drive continuous cost efficiency in a recovering market, respond to
    climate change-related risks and opportunities, and manage the impacts of COVID-19, and successfully execute on our profitability drivers listed on slides 3 and 6, and we are assuming an undisrupted market
    recovery, for example, undisrupted by COVID-19 impacts, commodity price volatility or social or political unrest, especially in Chile. Additional important information identifying and describing these and other
    risks, uncertainties, assumptions and other factors is contained in our most recently filed annual information form (AIF) and in our most recent annual and quarterly management’s discussion and analysis of financial
    results (MD&A), which are available on our website (www.finning.com) or under our profile on SEDAR (www.sedar.com).
    We caution readers that the risks described in the AIF and MD&A are not the only risks that could impact the company. We cannot accurately predict the full impact that COVID-19 will have on our business,
    results of operations, financial condition or the demand for our services, due in part to the uncertainties relating to the ultimate geographic spread of the virus, the severity of the disease, the duration of the
    outbreak, the steps our customers or suppliers may take in current circumstances, including slowing or halting operations, the duration of travel and quarantine restrictions imposed by governments of affected
    countries and other steps that may be taken by such governments to respond to the pandemic. Additional risks and uncertainties not currently known to us or that are currently deemed to be immaterial may also
    have a material adverse effect on our business, financial condition, or results of operations.

    Currency
    Monetary amounts referred to in this presentation are in Canadian dollars unless noted otherwise. All variances and ratios in this presentation are based on the functional currency of each operation (Canada:
    CAD, South America: USD, UK & Ireland: GBP).

    Non-GAAP financial measures
    This presentation includes certain “non-GAAP financial measures”, which are called out the first time they are used. The non-GAAP financial measures do not have a standardized meaning under International
    Financial Reporting Standards (IFRS) and therefore may not be comparable to similar measures presented by other issuers. For additional information regarding these financial metrics, including definitions and
    reconciliations from each of these non-GAAP financial measures to their most directly comparable measure under Generally Accepted Accounting Principles, where available, see the heading “Description of Non-
    GAAP Financial Measures and Reconciliations” in our most recent MD&A. We believe that providing certain non-GAAP financial measures provides users of our consolidated financial statements with important
    information regarding the operational performance and related trends of our business. By considering these measures in combination with the comparable IFRS measures set out in the MD&A, we believe that
    users are provided a better overall understanding of our business and financial performance during the relevant period than if they simply considered the IFRS measures alone.
    Reported financial metrics may be impacted by significant items we do not consider indicative of operational and financial trends either by nature or amount. Financial metrics that have been adjusted to take into
    account these items are referred to as “Adjusted” metrics. For a description of these significant items, please refer to our quarterly and annual MD&A for the period to which the relevant Adjusted metric relates.
9
Footnotes
     Slide 4
     Footnote 4: https://www.mop.cl/Prensa/Paginas/DetalleDestacadas-portadillanoticias.aspx?item=3247
     Footnote 5: Goldman Sachs Equity Research, China Metals & Mining Lithium - look beyond disruption; initiate Ganfeng H/A at Buy; August 21, 2020

     Slide 7
     Footnote 2: Comisión Chilena del Cobre; Proyección de la producción de cobre en Chile 2020 – 2031; Depp 29/2020.
     Footnote 3: Company reports
     • Teck, QB2/QB3 – https://www.teck.com/operations/chile/projects/quebrada-blanca-phase-2/
     • Capstone, Santo Domingo – https://capstonemining.com/operations/santo-domingo/default.aspx
     • Teck / Newmont, Nueva Union – https://www.teck.com/operations/chile/projects/nuevaunion/
     • First Quantum, Taca Taca – https://www.first-quantum.com/English/our-operations/default.aspx
     • Yamanagold, Agua Rica – https://www.yamana.com/portfolio/advancing-projects/default.aspx
     • Filo Mining, Filo Del Sol - https://filo-mining.com/operations/overview/
     • Codelco – https://www.codelco.com/prontus_codelco/site/edic/base/port/operaciones.html
     • AngloAmerican, Los Bronces – https://www.angloamerican.com/products/copper
     • Antofagasta, Los Pelambres – https://www.antofagasta.co.uk/our-business/mining-division/los-pelambres/
     • Mantos Copper, Mantoverde – https://www.mantoscopper.org/mantoverde

10
You can also read