GETTING STARTED WITH KLIPFOLIO: WORKING WITH GOOGLE ADWORDS DATA SOURCES
←
→
Page content transcription
If your browser does not render page correctly, please read the page content below

Getting Started with Klipfolio:
Working with Google AdWords Data Sources
Ready to dig deeper into your Klipfolio dashboard experience? This guide will help you build
and manage your data visualizations or jump straight over to our Knowledge Base for indepth
product guides and tutorials.
Klipfolio and you
Klipfolio lingo
Build a Klip
Connect to a data source
Using Google AdWords as a data source
Step 1: Start the data source creation process
Step 2: Create Adwords data source
Build a Klip with the Klip editor
Step 1. Choosing the type of component
Step 2. Choosing the data source
Step 3. Assigning data to subcomponents
Each component type has different subcomponents associated with it, so it's
important to note that the following steps only illustrate the typical workflow for
assigning data to a subcomponent. For more information on this step, visit: how to
use the Klip Editor.
Step 4. Adjust properties
Step 5. Add more context
Step 6. Save and share the Klip
How to email a Klip or a tab
More Klip building resources
Do more
Share your Dashboard
To share from the Library
To share from the tab
Show off your dashboard on a wall display
Here are a few tips to help you optimize a dashboard for display on a TV screen or wall
display:
Set up your account
Sign up for Klipfolio
Seats and Users
Partners
More resources on managing your account
Follow us on
Twitter
and
Facebook
| Contact
sales@klipfolio.com
for additional information 1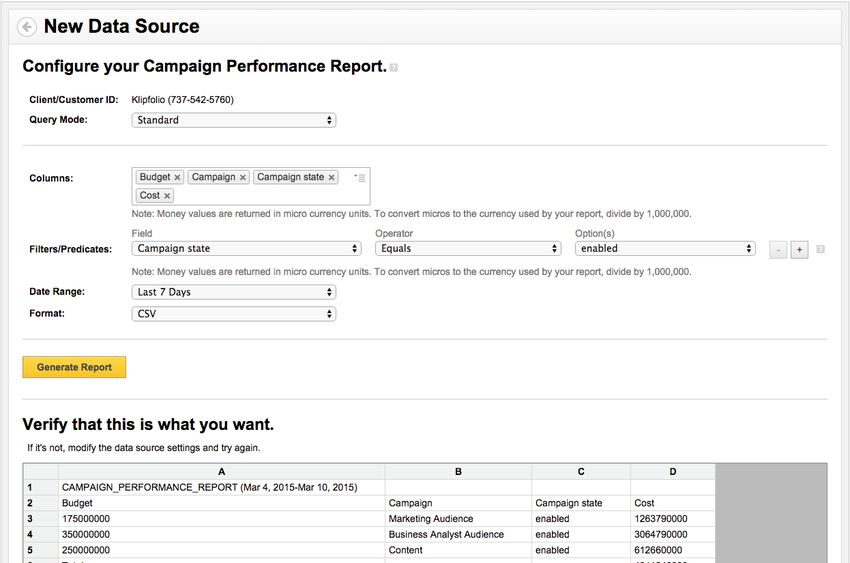
Klipfolio and you
A Klipfolio dashboard brings your business data to life helping you and your organization
understand and track KPIs, metrics and other essential information. With Klipfolio Dashboard,
you can gather, share and display the data that matters to you in realtime. Using dashboards
effectively not only enables you to access the most important information for your business,
but it also places you in a position of being able to quickly monitor the metrics that matter.
Learn more about business dashboards from the real life stories of our customers.
Klipfolio lingo
There are some key Klipfolio terms with which to familiarize yourself that will help you as you
start building your dashboard:
Klipfolio Dashboard is a cloudbased web app. With this app, everyone in your
organization can access your interactive dashboards from anywhere via a web
browser, mobile device or share with your organization using big screens. Security is
builtin so that only your authorized users can access your dashboards. Data from
your key service providers including Google Analytics and hundreds more is refreshed
at incremental levels that you can control.
Follow us on
Twitter
and
Facebook
| Contact
sales@klipfolio.com
for additional information 2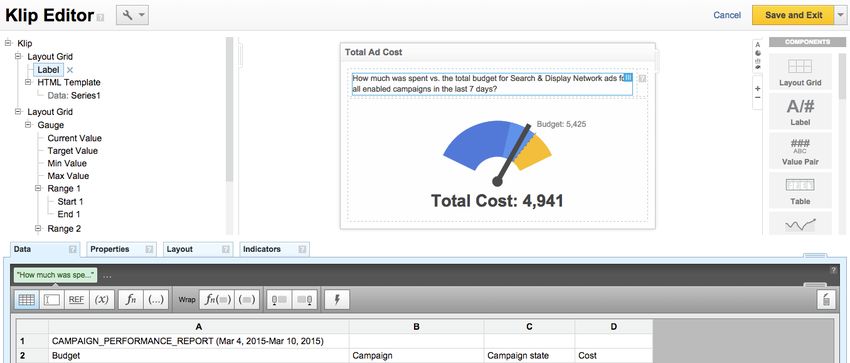
So, what makes up your Klipfolio Dashboard?
Data sources, at the heart of each Klip, are essentially queries or defined data
segments that come from a variety of sources such as databases, flat files like XML,
JSON, CSV and Excel, or web accessible resources like Google Analytics or
Facebook. One or more data sources form the foundation for populating your Klips.
For more information, see
Creating data sources
.
Tabs are used by Klipfolio to organize and display your Klips on your dashboard. Each
tab can hold one or more Klips and often reflect a specific area of your business that
you want to monitor, such as Marketing, Sales, Finance, HR, etc. With tabs you can
simplify distribution and sharing of your Klips with your team. When you log in to
Klipfolio, you will see all of your active tabs in your dashboard.
For more information, see
Building tabs
.
Follow us on
Twitter
and
Facebook
| Contact
sales@klipfolio.com
for additional information 3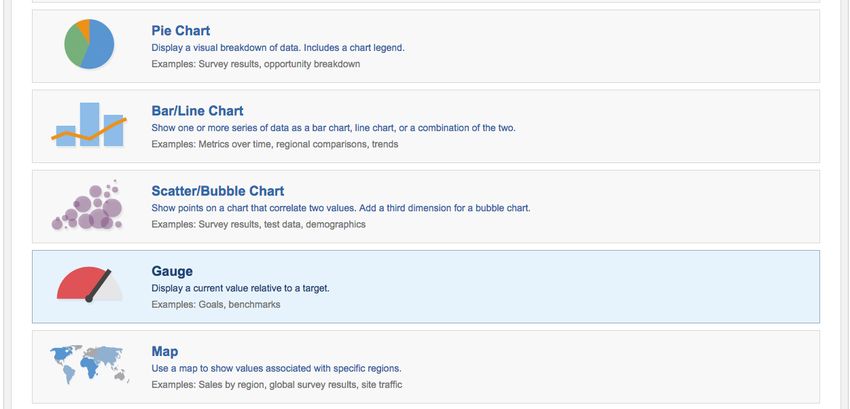
Klips are containers that may hold one or more data visualizations, or components,
and are typically focused on a specific KPI, or monitoring related information.
Klips are
comprised of components and attributes that control the important properties
associated with your Klip. Components are different types of data visualizations such
as tables, bar charts, maps, pictographs, gauges and more. A good way to think of the
difference between a Klip and a component is to think of a Klip as a container, and a
component as what's inside the container.
For more information, see
Building Klips
.
A is a unique individual that is granted access to Klipfolio Dashboard.
User
The Libraryis the engine room of Klipfolio. It is where you access, create and edit all
of your assets — Klips, Tabs and Data Sources.
Follow us on
Twitter
and
Facebook
| Contact
sales@klipfolio.com
for additional information 4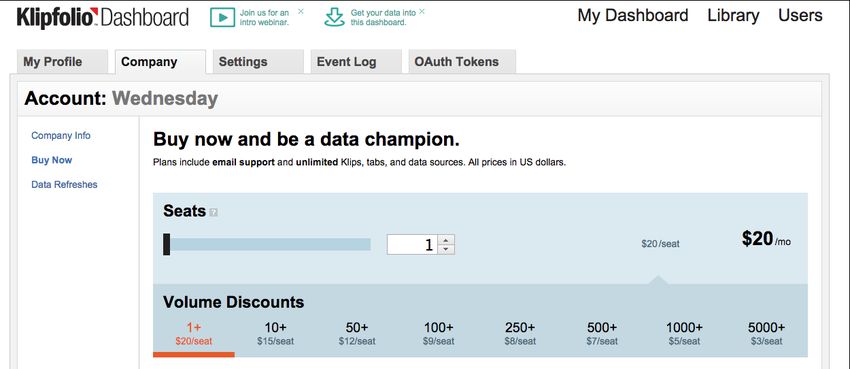
Follow us on
Twitter
and
Facebook
| Contact
sales@klipfolio.com
for additional information 5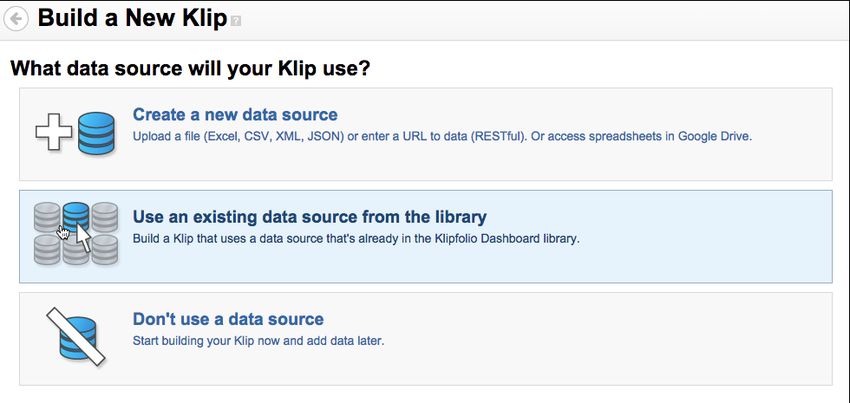
Build a Klip
Klips are the visualizations of your data. So, how do you get started? You:
● Connect to a data source
● Build a Klip with the Klip editor
● Share the Klip
Connect to a data source
First, you need to connect to the data source that you want to visualize in your Klip. In
addition to relational databases and flat files, including CSV, XML, JSON and EXCEL,
Klipfolio connects directly to a multitude of different online services such as Google
Analytics, Google Adwords, Facebook, Twitter, Salesforce, Google Webmaster Tools,
Dropbox and many other web accessible resources.
Here’s how you connect to Google AdWords as a data source:
Using Google AdWords as a data source
Step 1: Start the data source creation process
1. Click on the Library link.
2. Select the Data Sources tab.
3. Click the Create a New Data Source button.
4. Select the Google AdWords option.
5. Authenticate using your Google AdWords credentials.
i. Select Google AdWords from the list of Connectors on the data sources
page.
ii. Sign in using an existing token or create a new one by signing into your
Google account. If you have multiple clients, you require a My Client
Center (MCC) level access. For more information on MCC accounts,
see
Understanding My Client Center (MCC) access levels .
iii. After you have created your token, click Next to configure your report.
Follow us on
Twitter
and
Facebook
| Contact
sales@klipfolio.com
for additional information 6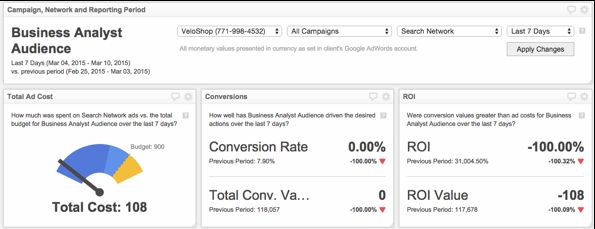
Step 2: Create Adwords data source
1. Select the report you want to generate from the list and click
Select Report
.
For a comprehensive list of report types, see the
Google AdWords Report
Types
documentation.
Each Google AdWords report is made up of a collection
of fields from which you can select to create a specific query to use as a data
source in Klipfolio. Below is an example using the Campaign Performance
Report.
2. Select a
Query Mode
from the dropdown menu. When you select
Standard
,
the query is automatically generated from your subsequent field selections.
Custom allows you to write your own query using the
AdWords Query
Language (AWQL)
.
3. Select the
Columns
from an autogenerated list based on the report you
selected.
4. Select the parameters that you want to s from the Filters/Predicates from the
dropdown menu. (See About predicate values and filters for more information
on Predicates). Every report contains a variety of parameters or fields used for
collecting specific data to generate a report. For an extensive list of reports and
the meaning of each field, see the Google AdWords Report Types
documentation. See also Changing currency .
5. Select the Date Range on which you want to filter. Note: Some reports do not
have a date range associated with them. In this case, you must select a date
type from the Columns or Filters/Predicates fields to filter your dates.
6. Select the
Download Format
in which you want to download the data. XML
and CSV formats are supported. (CSV is the default and is recommended for
simplicity.)
7. When you are finished configuring your report, click
Generate Report
.
8. If you are happy with the resulting data source, click
Continue
.
9. Save as “My Campaign Performance Report”.
Follow us on
Twitter
and
Facebook
| Contact
sales@klipfolio.com
for additional information 7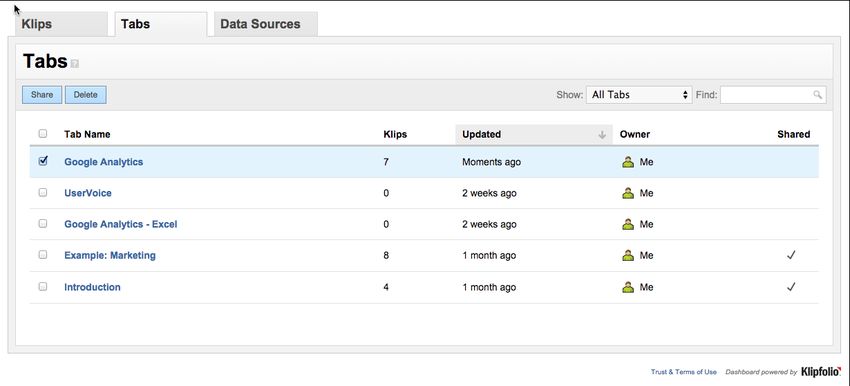
More information on data sources:
Online data sources and instructions on how to connect
Web Accessible Resources
Best practices on uploading your
Build a Klip with the Klip editor
Once you have the data source that you want to pull into Klipfolio, it’s time to start
creating your visualization. The Klip Editor is where it all happens you just need a
data source and the type of visualization you want. Let’s build an AdWords Campaign
Performance Report Klip using the data source we just created called My Campaign
Performance Report. The data source is saved in the Library. In this Klip we will show
Budget and Cost.
Follow us on
Twitter
and
Facebook
| Contact
sales@klipfolio.com
for additional information 8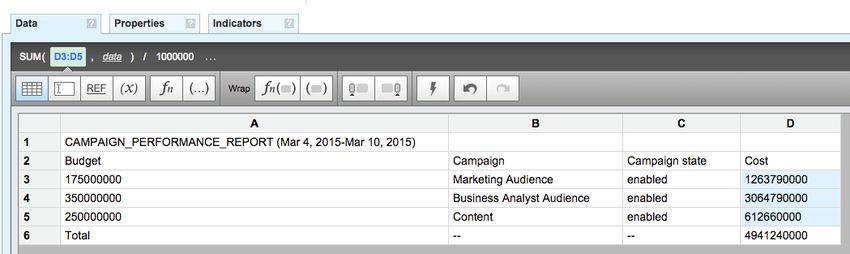
Every Klip is made up of attributes called components that control virtually every part
of your Klip, from its title to its visualization style (Chart, Pictograph, Gauge and so on).
The Klip Editor lets you work with your Klip components to customize your Klip's data,
properties, and appearance.
Building a Klip involves five steps:
1. Choosing the component style
2. Choosing the data source
3. Assigning data to subcomponents
4. Adjusting properties
5. Saving and sharing the Klip
Step 1. Choosing the type of component
1. On your dashboard, click the Add a Klip button.
2. Click the Build a New Klip button.
3. Select the Gauge component on the Build a Klip screen.
Follow us on
Twitter
and
Facebook
| Contact
sales@klipfolio.com
for additional information 9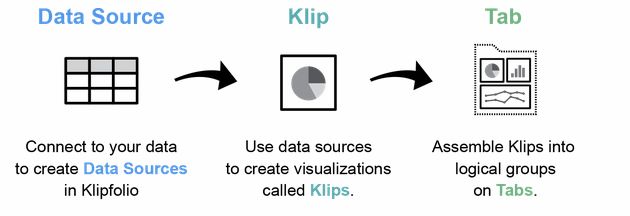
Step 2. Choosing the data source
Next, you will be prompted to provide a data source for the Klip to use. Select Use an
existing data source.
The Data Sources screen lists existing data sources. In this example, we will select the
My Campaign Performance Report data source. This data source was created in the
Using Google AdWords as a data source
section.
Follow us on
Twitter
and
Facebook
| Contact
sales@klipfolio.com
for additional information
10Here are some commonly used data sources:
● Excel spreadsheets
● Google Docs spreadsheets
● Web accessible resources
Once you select the data source, you enter the Klip Editor with a gauge Klip in the
middle of the screen.
Follow us on
Twitter
and
Facebook
| Contact
sales@klipfolio.com
for additional information
11Step 3. Assigning data to sub-components
Each component type has different subcomponents associated with it, so it's
important to note that the following steps only illustrate the typical workflow for
assigning data to a subcomponent. For more information on this step, visit: how to
use the Klip Editor
.
1. Select a subcomponent from the component tree (top left of the Klip Editor).
2. Open its data panel (bottom left).
3. Select a value(s) from your data source and do some calculations.
The value(s) is assigned to the subcomponent as it appears in your data source.
Step 5. Add more values
In this example, we are comparing the Budget against the actual spend. In Step 4,
Cost was associated with “Current Value” in the component tree. Now let’s compare
Follow us on
Twitter
and
Facebook
| Contact
sales@klipfolio.com
for additional information
12against budget and associate it with the Target Value sub component in the
component tree.
Step 4. Adjust properties
Use the Properties panel to adjust properties associated with your Klip and each of
your subcomponents. Commonly used properties include font style, prefixes and
suffixes, and setting update animations for the Klip. In this example, we will transform
the gauge from a Horizontal style to an Arc.
Click Gauge in the component tree to open the Properties tab. Select the type of
gauge from the Gauge Style dropdown menu.
Follow us on
Twitter
and
Facebook
| Contact
sales@klipfolio.com
for additional information
13Step 5. Add more context
You can provide more context for the data presented in your Klip with the use of
indicators and color ranges, as shown here.
To add color to your gauge, click on the + symbol next to the Range control (upper
righthand corner) to add a range.
Follow us on
Twitter
and
Facebook
| Contact
sales@klipfolio.com
for additional information
14If you are using ranges, you must set the start and end values to display the range.
Follow us on
Twitter
and
Facebook
| Contact
sales@klipfolio.com
for additional information
15Using the Prefix and Suffix properties for values also adds context to your Klip. In this
example, select Current Value from the component tree to open the Properties tab.
Then add an appropriate prefix for Current Value.
Step 6. Save and share the Klip
When you are finished building your Klip, click the Save button at the top of the Klip
Editor. On the next screen, you can share a Klip others in your organization as View
only or View and edit. This will make creating and sharing dashboards within your
organization much easier in the long run. The easiest way to share a Klip is to email it.
Follow us on
Twitter
and
Facebook
| Contact
sales@klipfolio.com
for additional information
16Follow us on
Twitter
and
Facebook
| Contact
sales@klipfolio.com
for additional information
17How to email a Klip or a tab
You can emai
l a Klip or a tab to other Klipfolio users or to an external email address.
Let’s use a Klip as the example the same approach is valid for an entire tab:
1. Locate the Klip you want to email.
2. On the top right of the Klip, select the Klip Menu icon (it looks like a
gear).
3. Select Share, Email Klip.
4. From the Email this Klip window, provide the following information:
i. Email address Tip: Use a semicolon to send to multiple email
addresses.
ii. Optional: Add a comment for the intended recipient.
iii. Choose to send as either a PDF or Image file. (Tip: change the option to
Landscape)
5. Click the Send Now button.
For more information:
How to build a Klip
Checklist for adding new users and sharing Klips
More Klip building resources
Here are a few resources that will speed you on your way.
The Klipfolio Dashboard Quick Start is a brief guide linking you to the knowledge base
articles you need to start working with Klipfolio.
The Tips and Techniques library provides in depth help on building data visualizations:
1. Tips and Techniques Function examples
2. Tips and Techniques Task examples
3. Tips and Techniques Google Analytics examples
Your account: How to
purchase
Klipfolio seats.
Follow us on
Twitter
and
Facebook
| Contact
sales@klipfolio.com
for additional information
18For Partners: The articles in our
Partner knowledge basewill help you find out more about
what it means to become a Klipfolio Partner and the additional functionality available to help
you manage your Clients.
Do more
Share your Dashboard
In Klipfolio, tabs are dashboards. You can share a tab from the Library or from the tab
itself. Tabs are shared with different groups that have been set up in your organization.
This allows for data experts to set up tabs and quickly share them with the people that
need to monitor that data. As you share tabs with other groups, you have the option to
assign different levels of permissions to those users.
To share from the Library
1. Click the Library link on the dashboard welcome page.
2. Select the Tabs tab.
3. Click the appropriate tab.
4. Click the Edit link beside the Sharing heading.
5. Click the Sharing link.
6. Click the Share this tab link.
7. Select one or more Groups under the Sharing heading.
8. Determine the Rights to be associated with each group.
9. Click the Save button.
The tab is shared with the specified groups and will appear in those groups’ Library.
Follow us on
Twitter
and
Facebook
| Contact
sales@klipfolio.com
for additional information
19To share from the tab
1. Click the tab's menu button.
2.
3. Select Share from the menu.
4. Select Share with groups ... .
5. Select one or more Groups under the Sharing heading.
6. Determine the Rights to be associated with each group.
7. In the same way, share the Klips on the tab by selecting the Klip’s menu.
8. Click the Save button.
The tab is shared with the specified groups and will appear in those groups’ Library.
Show off your dashboard on a wall display
Here are a few tips to help you optimize a dashboard for display on a TV screen or
wall display:
Trim content. You won't be able to display as much on a TV as you can on a desktop
so keep the content to just what will appear on the wall display without scrolling. Trim
out any data that doesn't clearly add to the story you're trying to tell. If you must, put it
on a separate tab and, in full screen mode, set your dashboard to automatically cycle
between tabs.
Adjust your browser's zoom level.
We find 150% to 175% ideal for televisions with
viewers who are within 20 feet.
Follow us on
Twitter
and
Facebook
| Contact
sales@klipfolio.com
for additional informationUse suffixes on big numbers. When users don't need to know a specific number
down to the last digit, consider using a suffix. For example, turn $34,231,342.23 into
$34.2M. In this case we divided the number by 1,000,000 added the M as a suffix.
This saves a lot of space and makes things clearer (and is especially effective on
charts).
Use smaller gauges. Gauges were designed to be bigger than most other Klip
components in Klipfolio. But on a big screen, it's not always worth the real estate
tradeoff. Make them smaller and/or set the gauges to horizontal or bullet charts which
can show the same information with a smaller footprint.
Use Klip titles. Klip title styling is limited.
We suggest using the titles wherever
possible to describe the content of a Klip. They scale well with the browser's zoom
settings and work on mobile devices.
Use Labels to make statements. Labels allow for larger text and more formatting
options than titles. They also allow you to add context to sections of your Klips.
Find clever ways to save space. Cut out chart axis labels if they're redundant. Put
descriptions in legends. Shorten axis tick mark labels. Making tick labels diagonal
helps, too.
Make heights consistent.
Where possible, ensure the height of each Klip is the
same.
Keep date formats consistent. Use the daterelated functions to format all dates in a
way that is familiar for users (and short, if possible).
Follow us on
Twitter
and
Facebook
| Contact
sales@klipfolio.com
for additional information
21Set up your account
Now that you have taken Klipfolio out for a spin, it’s time to set up your account for real so you
can get the most out of your dashboard.
Sign up for Klipfolio
Click on the link at the top of the screen to go to the Buy Now page.
You can purchase seats for Klipfolio Dashboard on either a monthly or yearly basis.
The price per user is calculated using a volume discount model. Billing is based on the
number of seats associated with your account.
To purchase seats:
1. From the Dashboard, click the Account link.
2. Select the Company tab.
3. Click the Buy Now link.
4. Under Seats, drag the slider to the number of seats you want to purchase.
Follow us on
Twitter
and
Facebook
| Contact
sales@klipfolio.com
for additional information
225. Click Buy Now if you are firsttime buyer or Update Plan to purchase additional
seats.
6. Enter your credit card information.
7. Click the Confirm button to submit your Payment Plan form.
Seats and Users
When you set up your plan, you buy seats so that you can add users.
When you buy Klipfolio Seats you are actually buying capacity. Seats are
allocated to users as needed. So let’s say you rent an airplane with the capacity
to transport up to 10 passengers. The seats in the airplane are similar to Klipfolio
Seats: they represent capacity.
A user, on the other hand, is a unique individual that is granted access to
Klipfolio. Going back to our airplane analogy, the passengers that will occupy the
seats in the airplane are similar to Klipfolio Users: they represent the individuals
who will access the dashboard.
Partners
If you would like to manage client accounts, you can find out more hereor contact our
sales tdeam to discuss becoming a Partner. As a partner you are given a "master"
account that provides you with the ability to manage client, or "child" accounts, and to
monitor your own performance metrics. Each master account has a Clientssection
associated with it that provides information about each of your clients, as well as the
ability to sign in and manage their account.
More resources on managing your account
● Your account: How to purchase Klipfolio seats.
● For Partners: The articles in our
Partner knowledge base
will help you find out more
about what it means to become a Klipfolio Partner.
Follow us on
Twitter
and
Facebook
| Contact
sales@klipfolio.com
for additional information
23You can also read