Systemic Change Through Meaningful Feedback - Urban Collaborative
←
→
Page content transcription
If your browser does not render page correctly, please read the page content below

Systemic Change Through
  Meaningful Feedback

                           Urban Collaborative Coalition
                                        Systemic Change
                                           Bobbi Pedrick,
                           Director of Special Education
                                    bpedrick@aacps.org
                 Julianna Hegarty, SE Resource Teacher
                                     jhegarty@aacps.org
                   Stephanie Seidl, SE Resource Teacher
                                        sseidl@aacps.org
Based on my work with my colleagues today,
I will take away with me:
                                                                         One new way that I can use
     Two things that I learned about today that                          data to guide our instructional
     I plan to incorporate in my work this year to                       staff as they strive to grow is:
     help teachers and school leaders focus on areas                     R
     of needed growth are:
     R

     R

             To ensure that our staff are practicing best instructional practices that we
             have been working on enhancing, I can do the following:

            R

            R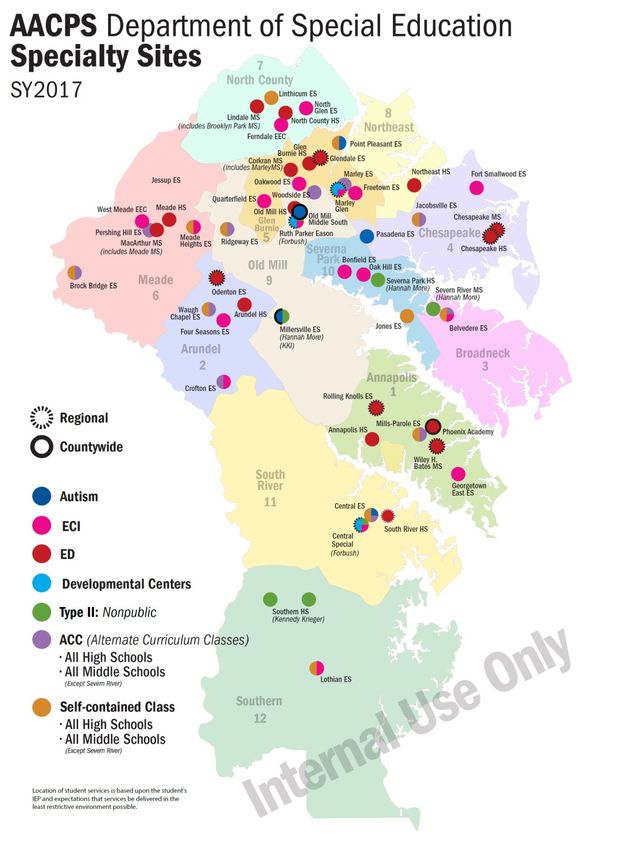
WHO
ARE
WE?

Students      84,000
Students      10.3%
w/Special
Needs
Schools       80 Elementary
              19 Middle       WHO
              13 High
              12 Other        ARE
SE Teachers   1122            WE?
Average       Elementary 11
Caseload      Middle     13
              High        9
FARMS         34%
% Homes       28%
with
students in
Public
School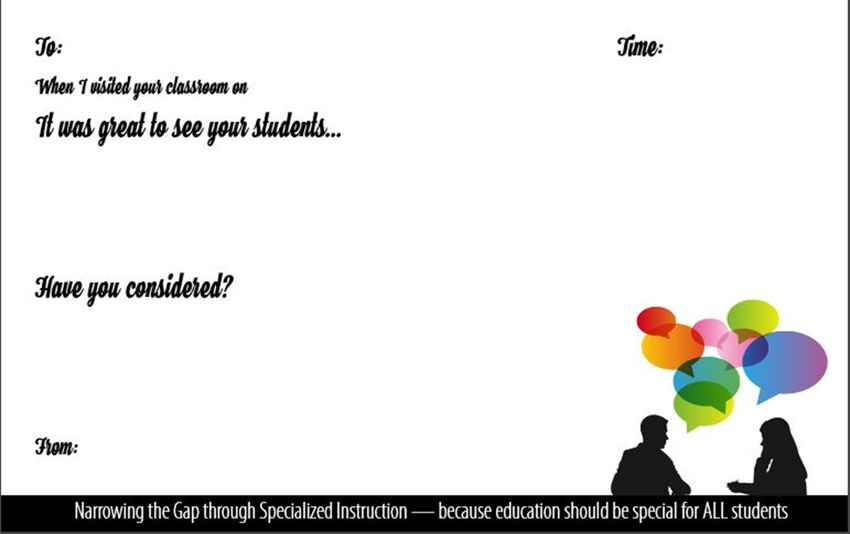
Key                                                        Enrollment             LRE            Disproportionality           Accommodations
            Anne Arundel County Public Schools                                                                                                       MSDE SPP*
                                                                      Meeting standards. Keep up the good work!                   8% & lower                                      1.9                      >25.1%
                                                                      State and National standards.                                   8%                  80%
The STATE of SPECIAL EDUCATION
Quarterly Assessment Data Quarterly Assessment Data Quarterly Assessment Data
100% - 3rd
AACPS Comprehensive ES
100%
4th
AACPS Comprehensive ES -
100%
5th
AACPS Comprehensive ES -
90%
80% Grade - Reading 90%
80%
Grade - Reading 90%
80%
Grade - Reading
Percent of Students
Percent of Students
Percent of Students
70% 70% 72% 70%
69% 75%
60% 60% 60% 65%
59% 59% 56%
50% 50% 50% 54%
33%
40% 40% 40%
23% 32% 39%
30% 36% 30% 30%
31% 29%
20% 21% 20% 20% 27%
18%
10% 11% 10% 10% 10% 16% 17%
7% 10%
0% 0% 0%
Q1 Q2 Q3 Q4 Q1 Q2 Q3 Q4 Q1 Q2 Q3 Q4
Non-SpEd - Reading SpEd - Reading Non-SpEd - Reading SpEd - Reading Non-SpEd - Reading SpEd - Reading
Quarterly Assessment Data Quarterly Assessment Data Quarterly Assessment Data
100% - 3rd
AACPS Comprehensive ES
100%
- 4th
AACPS Comprehensive ES 5th
AACPS Comprehensive ES -
90%
Grade - Math 90%
Grade - Math Grade - Math
Percent of Students
80%
Percent of Students
Percent of Students
80%
70% 70% 100%
60% 90%
65% 60% 63%
50% 50% 80%
51% 52% 52% 57%
40% 70%
42% 40% 42%
42% 60% 65%
30% 30% 32%
26% 26% 28% 50%
20% 22% 24% 20% 50%
20% 40% 44% 46%
10% 10%
0%
30% 33%
0%
Q1 Q2 Q3 Q4 Q1 Q2 Q3 Q4 20% 21% 24%
20%
10%
Non-SpEd - Math SpEd - Math Non-SpEd - Math SpEd - Math 0% Non-SpEd - Math SpEd - Math
Q1 Q2 Q3 Q4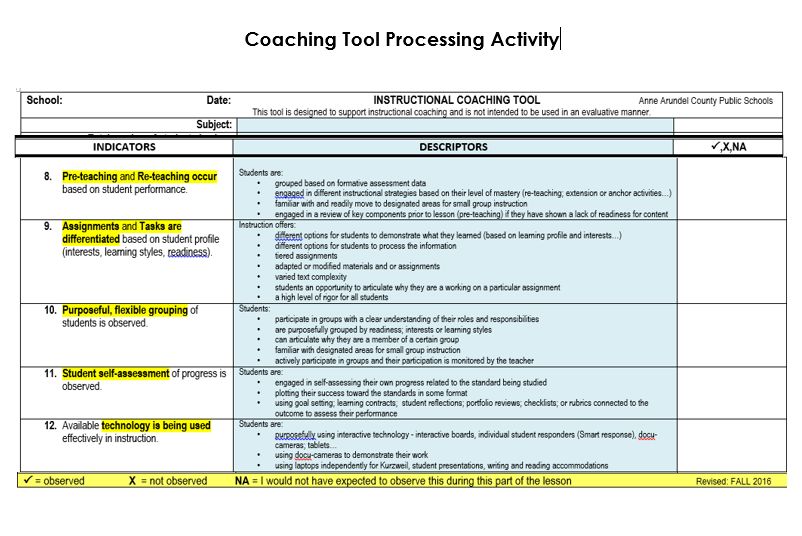
Critical Questions we were facing…

 ØHow are we going to
         ?

               Though many teachers
                                         Why are we not seeing
                  were strong and                  the
                  working hard, in
                 general, not much       Specialized Instruction
               “special” was being      that we would expect to
                   done for either
               struggling or advanced
                                          see given the gaps in
                     learners…               performance?
                     We were a
               ONE SIZE FITS ALL
                      system!
The IMPORTANCE of USING ASSESSMENT TO CHANGE WHAT WE DO…

The IMPORTANCE of USING ASSESSMENT TO CHANGE WHAT WE DO…

FEEDBACK:
“Schools that are closing the gap exist in a culture of “public teaching” that supports non-
defensive examination of practice in relation to student results. This means that when
students don’t learn, teachers face the evidence squarely and accept responsibility for their
part. “                                                               Jon Saphier, Research for Better Teaching
                 School:                                    Date:                                             INSTRUCTIONAL COACHING TOOL                                                        Anne Arundel County Public Schools
                                                         Subject:
                               Total number of students in class
                    Number of students with disabilities in class
                 Percentage of students with disabilities in class
                                  INDICATORS                                                                                 DESCRIPTORS                                                                               P,X,NA
                 Both teachers are directing student actions and      Both teachers are:
                 activities.                                                •     actively involved in leading instruction
                                                                            •     providing pre-teaching or re-teaching
                                                                            •     using one of the co-teaching models (simultaneous, alternative, parallel, station, one teach/one observe while collecting
                                                                                  data)
                                                                            •     assessing student performance using data sources (clipboard, Smart response…)
                 Lesson outcomes are posted in terminology            Outcomes are:
                 clearly understood by students.                            •     visible and able to be read by students
                                                                            •     formatted in operational terms (I will…; student will…)
                                                                            •     inclusive of an essential question
                                                                            •     measurable
                                                                            •     posted for entire class period
                                                                            •     legible
                                                                            •     matched to instructional activities
                                                                            •     written in student-friendly language
                 Lesson outcomes are referenced periodically          Outcomes are:
                 throughout instruction.                                    •     reviewed to check for student understanding of the material periodically throughout the lesson
                                                                            •     referenced at least 3-5 times throughout the lesson including opening and closure of the lesson
                                                                            •     included in the closure which should occur approximately 5-7 minutes prior to end of class with summary of lesson
                                                                                  outcomes
                 Concrete examples and modeling of content            Teachers provide:
                 being studied are offered.                                 •     a sample of the finished product which is displayed at the time of task assignment
                                                                            •     a template or rubric depicting an effective product
                                                                            •     observing teachers using technology to model and display concrete examples
                                                                            •     real life examples
                                                                            •     opportunities for students to interact with objects/manipulatives/artifacts
                                                                            •     modeling of the process to complete the task (i.e. think aloud)
                 Teachers break down questions when needed.           Teachers:
                                                                            •     define and clarify terms with examples
                                                                            •     check for student understanding
                                                                            •     ask students to rephrase for understanding
                 Teachers use a variety of strategies and             Activities offer:
                 activities to engage students.                             • opportunities for students to move about the room
                                                                            •     multiple opportunities that allow diverse students to process the content
                                                                            •     opportunities for the students to lead activities and facilitate the learning
                                                                            •     opportunities for students to work in a variety of groups
                 Student mastery of concepts is assessed              Formative Assessments:
                 periodically throughout instruction.                       •     show evidence of at least 2-4 formative assessments per class aimed at identifying students who are struggling or
                                                                                  excelling with the concepts
                                                                            •     lead to an adjustment of instruction
                                                                            •     are used to check level of mastery (e.g. cruising clipboard; entrance and exit tickets; pinch cards; stop and thinks,
                                                                                  Smart response data…)
                 P = observed             X = not observed           NA = I would not have expected to observe this during this part of the lesson                                                               Revised: APRIL 2011
                                                                                                                                                                                           Developed by the Secondary Special Education Team
Take three minutes to study this coaching
tool.IMMEDIATE FEEDBACK:
“I think it's very important to have a feedback loop, where
you're constantly thinking about what you've done and how
you could be doing it better.” Elon Musk, Entrepreneur
10:30-11:15
Language Arts
10/15/2017
-review the outcome using word wall to focus on what and why they were learning content
-utilizing a brain break to re-reenergize and refocus to engage in the lesson
-have models of types of cinquain poems while they were working on composing their own
-using dry erase boards to encourage all students to respond during
all of the awesome questioning (and use as formative assessment
data on mastery towards the content!)
Stephanie Seidl, Special Ed Resource TeacherGUIDING QUESTIONS • Do improved instructional practices impact student learning?
Use of Effective Instructional Practices
                                                          Growing Teacher
                   100%
                                 95%             Growing Teacher Team(s)
                   90%                        89%

                                                                                    82%
                   80%
Frequency of Use

                   70%
                                                           67%          67%

                   60%

                   50%

                   40%
                                                                                           Growing Teacher Team(s)
                   30%

                   20%

                   10%

                    0%
                          Variety of    Formative Differentiated   Grouping     Student
                          Strategies   Assessments     Tasks                  Engagement

                                              Instructional Practice
Data based on Instructional Coaching Tool data from the
2016 Language Arts Instructional Site Visit
Use of Effective Instructional Practices
Growing Teacher vs. Static Teacher
100%
95%
90% 89%
82%
Frequency of Use
80%
70%
67% 67%
60%
50% Growing Teacher Team(s)
40% Static Teacher Team(s)
30%
25%
20%
18% 17%
14%
10%
2%
0%
Variety of Formative Differentiated Grouping Student
Strategies Assessments Tasks Engagement
Instructional Practice
Data based on Instructional Coaching Tool data from the
2016 Language Arts Instructional Site VisitStudent Performance SWD (Students with Disabilities)
100% 100%
80% 90%
Frequency of Use
60% 80% 77%
% Students Proficient and Advanced
65%
40% Growing 70%
Teacher
20% 60%
Team(s) 51% 52%
Static 50%
0%
Formative…
Differentiated…
Variety of…
Student…
Teacher
Grouping
Team(s) 40%
Growing Teacher
30% Team(s)
20% Static TeacherTeam(s)
10%
0%
Instructional Practice QA 1 QA 2
HS English / LA QUARTERLY ASSESSMENT
Data based on Instructional Coaching Tool data from the
2014 Language Arts Instructional Site Visit and ELA Benchmarks 2 and 3DATA:
“Progressive school systems use data to drive reform in assessing school performance, selecting
improvement strategies that meet a school's particular needs, setting high goals, creating strategic plans
for improvement, and measuring progress so that the process of change becomes a cycle of
continuous improvement”. Ronald Ferguson, Harvard University
Instructional
Site Visit
by content based on
Continuous Informal classroom
schoolwide visits
feedback through
ISV process and PHASE Assist schools in using
data data and feedback to
identify focus and needs
Coaching
• Weekly visits from
Resource Teacher
• Targeted, school based PD
• Instructional Coaching
Special Education Performance Process CycleUse of Effective Instructional Practices
Growing School
100%
86%
80% 79%
80%
66% 65%
62%
59%
60%
Frequency of Use
41% Growing School 2014
37%
40%
Growing School Current
23%
20%
0%
Variety of Formative Purposeful, Effective use of Active
Strategies Assessments Flexible Technoogy Engagement
Grouping
Instructional Practice
Data based on Instructional Coaching Tool data from the Phase 3 and current dataUse of Effective Instructional Practices
Growing School vs. Static School
100%
86%
80% 79%
80%
66% 67%
65%
62%
59%
57%
60%
Growing School 2014
Frequency of Use
52%
47% 46%
45%
41% Growing School Current
37% 38%
40%
Static School Phase 3
24% 25%
23%
20% Static School Current
20%
0%
Variety of Formative Purposeful, Effective use of Active
Strategies Assessments Flexible Technoogy Engagement
Grouping
Instructional Practice
Data based on Instructional Coaching Tool data from the Phase 3 and current dataStudent Performance NCLB Group (SWD, LEP, AA, FARMs)
100%
100%
80%
Frequency of Use
80%
60% 55%
60% 52%
40%
% Students Proficient and Advanced
Growing School Phase 3 40%
20% Growing School
Growing School Current 20% 37% 41%
0% Static School Phase 3 Static School
0%
Static School Current
Government Government
HSA2015 HSA2016
100%
80% 66%
60% 52%
40%
54% 53%
Instructional Practice
20% Growing School
0%
Static School
English PARCC English PARCC
2015 2016
Data based on Instructional Coaching Tool data from the Phase 3 and current data
2012 and 2013 Benchmark DataYOUR TIME THINK, PAIR, SHARE
DATA: LOOKING AT GROWTH FROM A DEPARTMENT OR GRADE LEVEL

                          Instructional
                            Site Visit
                      by content based on
                    Informal classroom visits
                  • Based on 42-75 informal,
                  unannounced classroom visits of
                       20-80 minutes in length

                                              Assist schools in using data and feedback to
                                                        identify focus and needs

Secondary Special Education Performance Process Cycle
DATA: INSTRUCTIONAL SITE VISIT REPORT
Growth
Strengths   Opportunities
DATA: LOOKING AT GROWTH FROM A SCHOOLWIDE LEVEL

           Continuous feedback through ISV process and
                           PHASE data

  Secondary Special Education Performance Process Cycle
DATA:
SAMPLE SCHOOL A
CYCLE I
Jun 2011-
Jun 2013
Both teachers are directing
student actions and activities. 91%
Lesson outcomes are posted
and reviewed in terminology 65%
clearly understood by students.
Lesson outcomes are
referenced periodically 59% Assist schools in using
throughout instruction.
Concrete examples and
data and feedback to
modeling of content being 78% identify focus and needs
studied are offered.
Teachers break down
questions when needed. 88%
Teachers use a variety of
strategies and activities to 74%
engage students.
Student mastery of concepts is
assessed periodically 50%
throughout instruction.
Pre-teaching and Re-
teaching occur through 19%
specialized instruction based
on student performance.
Assignments and Tasks are
differentiated based on 25%
student abilities.
Purposeful, flexible grouping
of students is observed. 41%
Student self assessment of
progress is observed. 17%DATA:
SAMPLE SCHOOL A
CYCLE I CYCLE II
Jun 2011- Jun 2013-
Jun 2013 Jun 2015
Both teachers are directing
student actions and activities. 91% 91%
Lesson outcomes are posted
and reviewed in terminology 65% 66%
clearly understood by students.
Lesson outcomes are
referenced periodically 59% 27% Assist schools in using
throughout instruction.
Concrete examples and
data and feedback to
modeling of content being 78% 92% identify focus and needs
studied are offered.
Teachers break down
questions when needed. 88% 91%
Teachers use a variety of
strategies and activities to 74% 89%
engage students.
Student mastery of concepts is
assessed periodically 50% 41%
throughout instruction.
Pre-teaching and Re-
GROWTH
teaching occur through 19% 43%
specialized instruction based SOME REGRESSION
on student performance.
SIGNIFICANT REGRESSION
Assignments and Tasks are
differentiated based on 25% 26% VERY CONCERNING
student abilities.
Purposeful, flexible grouping
of students is observed. 41% 56%
Student self assessment of
progress is observed. 17% 24%DATA:
SAMPLE SCHOOL A AACPS
CYCLE I CYCLE II CYCLE III CYCLE III-MS
Jun 2011- Jun 2013- Jun 2015- Average
Jun 2015-
Jun 2013 Jun 2015 Jun 2017
Jun 2017
Both teachers are directing 81%
91% 91% 95%
student actions and activities. Range:
54%-98%
õ
Lesson outcomes are posted 91%
and reviewed in terminology 65% 66% 94% Range:
clearly understood by students. 66%-98%
Lesson outcomes are
referenced periodically 59% 27% 33% 47%
Range: Assist schools in using
throughout instruction. 31%-63%
data and feedback to
õ
Concrete examples and 84%
modeling of content being 78% 92% 94% Range: identify focus and needs
studied are offered. 66%-94%
Teachers break down 93%
questions when needed. 88% 91% 97% Range:
82%-100%
Teachers use a variety of 73%
74% 89% 83%
strategies and activities to
engage students.
õ
Range:
59%-88%
Student mastery of concepts is 57%
50% 41% 77%
assessed periodically
throughout instruction.
õ
Range:
22%-78%
Pre-teaching and Re- 31%
GROWTH
19% 43% 51%
teaching occur through
specialized instruction based
Range:
7%-51% õ SOME REGRESSION
on student performance.
SIGNIFICANT REGRESSION
33%
õ
Assignments and Tasks are
differentiated based on 25% 26% 43% Range: VERY CONCERNING
student abilities. 15%-46%
Purposeful, flexible grouping
of students is observed. 41% 56% 60% 43%
õ
Range:
õ YOU EXCEED THE
AVERAGE BY 10% OR MORE!
16%-61%
Student self assessment of 29%
17% 24% 46%
progress is observed.
õ
Range:
11%-50%DATA: Phase I
Sept. 2008-Jan. 2010
Phase II
Feb. 2010-June 2011
Phase III
Sept. 2011-Jan. 2013
AACPS
Phase III-HS
Average
Sep. 2011-Jan. 2013
Both teachers are directing 90% 80% 63% 76%
student actions and activities. Range:
63%-89%
Lesson outcomes are posted 100% 100% 78% 80%
and reviewed in terminology Range:
clearly understood by students. 69%-92%
Lesson outcomes are 95% 75% 38% 42%
referenced periodically Range:
throughout instruction. 16%-83%
Concrete examples and 10% 80% 69% 71%
modeling of content being Range:
studied are offered. 63%-90%
Teachers break down 50% 80% 78% 86%
questions when needed. Range:
78%-98%
Teachers use a variety of 96% 80% 57% 58%
strategies and activities to Range:
engage students. 48%-77%
Student mastery of concepts is 60% 40% 38% 43%
assessed periodically Range:
throughout instruction. 17%-63%
Pre-teaching and Re- 5% 46% 15% 20%
teaching occur through Range:
specialized instruction based 5%-20%
on student performance.
Assignments and Tasks are 17% 41% 31% 24%
differentiated based on Range:
student abilities. 11%-40%
GROWTH Purposeful, flexible 58% 54% 20% 28%
grouping of students is Range:
SOME REGRESSION observed. 15%-48%
Student self assessment of N/A 19% 9% 22%
SIGNIFICANT REGRESSION progress is observed. Range:
9%-37%
VERY CONCERNING Available technology is being 97% 85% 46%
Because we now look for student interaction versus
teacher use, there was an average decrease in this
53%
used effectively in instruction. area of 15% Range:
YOU EXCEED THE 39%-70%
AVERAGE BY 10% OR MORE! Students are actively 92% 81% 67% 74%
engaged in the instruction. Range:
59%-92%Based on my work with my colleagues today,
I will take away with me:
One new way that I can use
Two things that I learned about today that data to guide our instructional
I plan to incorporate in my work this year to staff as they strive to grow is:
help teachers and school leaders focus on areas R
of needed growth are:
R
R
To ensure that our staff are practicing best instructional practices that we
have been working on enhancing, I can do the following:
R
RUse of Effective Instructional Practices
Growing Teacher vs. Static Teacher
100%
92% 92%
90%
86%
Frequency of Use
80% 80%
70%
66%
60%
50% Growing Teacher Team(s)
42% 43%
40% 41% Static Teacher Team(s)
33%
30%
20% 19%
10%
0%
Variety of Formative Differentiated Grouping Student
Strategies Assessments Tasks Engagement
Instructional Practice
Data based on Instructional Coaching Tool data from the
2014 Language Arts Instructional Site VisitStudent Performance NCLB Group (SWD, LEP, AA, FARMs)
100%
100%
Frequency of Use
90%
80% 78%
60%
80% 76%
Growing 69% 72%
% Students Proficient and Advanced
40% 70%
Teacher
20% Team(s) County Average ALL
60%
0% 52% 51%
Static
Teacher 50%
Growing Teacher
Team(s) Team(s)
40%
Static Teacher Team(s)
30%
20%
Instructional Practice
10%
0%
Benchmark 2 Benchmark 3
ELA Benchmark NCLB Group (SWD, LEP, AA, FARMs)
Data based on Instructional Coaching Tool data from the
2014 Language Arts Instructional Site Visit and ELA Benchmarks 2 and 3 –
NCLB group – SWD, LEP, AA, FARMsUse of Effective Instructional Practices
Growing School vs. Static School
100%
77% 77%
80%
Frequency of Use
63%
57% 57%
60% 53% 54% 54%
50%
54%
52% Growing School Phase 3
45% 46%47%
44%
39%
Growing School Current
40% 34%
Static School Phase 3
24%
20% Static School Current
20% 15%
0%
Variety of Formative Purposeful, Effective use of Active
Strategies Assessments Flexible Technoogy Engagement
Grouping
Instructional Practice
Data based on Instructional Coaching Tool data from Phase 3 and Cureent DataStudent Performance SWD
100%
100%
80%
80% 65%
60% 60%
Growing School
40% Phase 3
40%
39% 38% Growing School
33%
Growing School
20%
Frequency of Use
% Students Proficient and Advanced
Current 20% Static School
0% Static School Phase
3 0%
English 9 BM 3 2012 English 9 BM 3 2013
Static School
Current
100%
80%
59%
60%
Instructional Practice 40%
Growing School
20% 13%
5% 9% Static School
0%
Algebra BM 3 2012 Algebra BM 3 2013
Data based on Instructional Coaching Tool data from Phase 3 and Benchmark 3 years 2012 and 2013PD:
“Schools that are closing the gap show improvement in student learning as a direct
consequence of improvements in the level of teachers content knowledge and skills, which
improves by providing job-embedded, school specific, sustainable Professional Development.”
Elizabeth City, Instructional Rounds in Education
VIDEO CLIPS reflecting AACPS
Differentiated Instruction PD Timeline
teachers and students
FY07 –09 FY 10 FY 11 FY 12 FY13 FY 14
9 teachers 90+ AACPS staff attend AACPS DI Consultants in DI Consultants DI Instructional
attend National DI Conference DI Conference schools 2 days in schools 2 Rounds
National DI 2000 staff days VERTICAL – K-
Conferenc LEAD the LEADERS LEAD the Video Taping of 12
500 reps from all 23
e training for 18 LEADERS Common (Consultants
other MD school
Rick secondary schools & Training for Core / DI workshops with schools for
systems
Wormeli 19 elementary schools remaining (35 participants) After 2School
days)
Countywid LEAD the LEADERS elementary Workshops:
Presentati Training for DI Instructional
schools After School • Tiering
o remaining secondary Planning Funding Workshops: • Formative
LEAD the LEADERS and more elementary (school based) • Tiering Assessment
Oct 2009
Quarterly training for central schools • Formative • Classroom
Meetings officeMeetings
staff Teacher to Teacher
Quarterly 6 Day DI Planning Assessment Management
(school & principals Workshops
(school based) Workshop in • Classroom • Flexible
based) 14 high schools
Dinner June Managemen Grouping
Dinner meetings with 21 middle schools DI Blackboard t • Poverty
Meetings
expert Elementary schools • Flexible • Gender-
Teacher
with Rick
5 high AYP – MS Countywide Grouping Based
Showcase
schools Some AYP HS Presentation Workshops
Teacher to DI Instructional
14 high schools
Teacher Teacher to Teacher 6 Day DI Planning) Planning
21 middle
Workshops Workshops
schools
14 high 14 high schools
DI Instructional
Schools 1 middle schools
Planning
Elementary schools
Funding
Principal
Workshop
Weekly visits from Resource Teacher Showcase
Teachers
Targeted, school based PD
Instructional Coaching DI Blackboard supports and TrainingBUILDING LEADERSHIP CAPACITY:
“In schools that are closing the gap:
• team members visit each others’ classrooms regularly to do focused peer observations of
one another.
• They collect data in service of a question they want answered.
• There is skillful debriefing of the observation and planning of next steps.”
Stephen Sheldon, Director of Research, John HopkinsBUILDING LEADERSHIP CAPACITY:
“Leaders in schools that narrow the achievement gap make closing the gap the primary goal,
set measurable goals and shrink the change.” Eric Jenson, Teaching with Poverty in Mind
DI Instructional RoundsTO SEND AHEAD Full page SOSE sample Full page graphs sample Handout Full page CT (one blank and one with indicators highlighted) Full page Phase Data Copies of Feedback Forms ISV reports (front high performing school back low performing school)
You can also read