CIBC 2018 Whistler Institutional Investor Conference - January 24 - 27, 2018
←
→
Page content transcription
If your browser does not render page correctly, please read the page content below
CIBC 2018 Whistler Institutional
Investor Conference
January 24 – 27, 2018
Cautionary Note Regarding Forward-Looking Statements

CAUTIONARY NOTE REGARDING FORWARD-LOOKING STATEMENTS: This presentation contains “forward-looking statements” within the meaning of the United States Private Securities Litigation Reform Act of
1995 and applicable Canadian securities legislation. Except for statements of historical fact relating to the Company, information contained herein constitutes forward-looking statements, including any
information as to the Company’s strategy, plans or future financial or operating performance, the outcome of the legal matters involving the damages assessment and any related enforcement proceedings.
Forward-looking statements are characterized by words such as “plan,” “expect”, “budget”, “target”, “project”, “intend,” “believe”, “anticipate”, “estimate” and other similar words, or statements that
certain events or conditions “may” or “will” occur. Forward looking statements are based on the opinions, assumptions and estimates of management considered reasonable at the date the statements are
made, and are inherently subject to a variety of risks and uncertainties and other known and unknown factors that could cause actual events or results to differ materially from those projected in the forward
looking statements. These factors include the Company’s expectations in connection with the expected production and exploration, development and expansion plans at the Company’s projects discussed
herein being met, the impact of proposed optimizations at the Company’s projects, changes in national and local government legislation, taxation, controls or regulations and/or change in the administration of
laws, policies and practices, the impact of the proposed new mining law in Brazil and the impact of general business and economic conditions, global liquidity and credit availability on the timing of cash flows
and the values of assets and liabilities based on projected future conditions, fluctuating metal prices (such as gold, copper, silver and zinc), currency exchange rates (such as the Brazilian Real, the Chilean
Peso, and the Argentine Peso versus the United States Dollar), the impact of inflation, possible variations in ore grade or recovery rates, changes in the Company’s hedging program, changes in accounting
policies, changes in mineral resources and mineral reserves, risk related to non-core asset dispositions, risks related to metal purchase agreements, risks related to acquisitions, changes in project parameters
as plans continue to be refined, changes in project development, construction, production and commissioning time frames, risk related to joint venture operations, the possibility of project cost overruns or
unanticipated costs and expenses, higher prices for fuel, steel, power, labour and other consumables contributing to higher costs and general risks of the mining industry, failure of plant, equipment or
processes to operate as anticipated, unexpected changes in mine life, final pricing for concentrate sales, unanticipated results of future studies, seasonality and unanticipated weather changes, costs and
timing of the development of new deposits, success of exploration activities, permitting time lines, government regulation and the risk of government expropriation or nationalization of mining operations,
environmental risks, unanticipated reclamation expenses, title disputes or claims, limitations on insurance coverage and timing and possible outcome of pending litigation and labour disputes, as well as those
risk factors discussed or referred to in the Company’s current and annual Management’s Discussion and Analysis and the Annual Information Form filed with the securities regulatory authorities in all provinces
of Canada and available at www.sedar.com, and the Company’s Annual Report on Form 40-F filed with the United States Securities and Exchange Commission. Although the Company has attempted to identify
important factors that could cause actual actions, events or results to differ materially from those described in forward-looking statements, there may be other factors that cause actions, events or results not
to be anticipated, estimated or intended. There can be no assurance that forward-looking statements will prove to be accurate, as actual results and future events could differ materially from those anticipated
in such statements. The Company undertakes no obligation to update forward-looking statements if circumstances or management’s estimates, assumptions or opinions should change, except as required by
applicable law. The reader is cautioned not to place undue reliance on forward-looking statements. The forward-looking information contained herein is presented for the purpose of assisting investors in
understanding the Company’s expected financial and operational performance and results as at and for the periods ended on the dates presented in the Company’s plans and objectives and may not be
appropriate for other purposes.

The Company has included certain non-GAAP financial measures, which the Company believes that together with measures determined in accordance with IFRS, provide investors with an improved ability to
evaluate the underlying performance of the Company. Non-GAAP financial measures do not have any standardized meaning prescribed under IFRS, and therefore they may not be comparable to similar measures
employed by other companies. The data is intended to provide additional information and should not be considered in isolation or as a substitute for measures of performance prepared in accordance with IFRS.
The non-GAAP financial measures included in this presentation include: co-product cash costs per ounce of gold produced, co-product cash costs per ounce of silver produced, co-product cash costs per pound
of copper produced, all-in sustaining co-product costs per ounce of gold produced, all-in sustaining co-product costs per ounce of silver produced, all-in sustaining co-product costs per pound of copper
produced, adjusted earnings or loss, adjusted earnings or loss per share, adjusted operating cash flows, net debt, net free cash flow, and average realized price per ounce of gold sold, average realized price
per ounce of silver sold, average realized price per pound of copper sold. Please refer to section 13 of the Company’s third quarter MD&A filed on SEDAR for a detailed discussion of the usefulness of the non-
GAAP measures. The terms “EBITDA” and “EBITDA Margin” do not have a standardized meaning prescribed by IFRS, and therefore the Company’s definitions are unlikely to be comparable to similar measures
presented by other companies. The Company believes that in addition to conventional measures prepared in accordance with IFRS, the Company and certain investors and analysts use this information to
evaluate the Company’s performance. In particular, management uses these measures for internal valuation for the period and to assist with planning and forecasting of future operations. The presentation of
EBITDA and EBITDA Margin is not meant to be a substitute for the information presented in accordance with IFRS.

The information presented herein was approved by management of Yamana Gold on January 23, 2018.

All amounts are expressed in United States dollars unless otherwise indicated.

                                                                                                                                                                                                                     2
Operating Mines
         Six Operations in Four Jurisdictions
                                                                                                                                   Canadian Malartic (50%, Au) – open pit
                                                                                                                                   Strategically positioned in the Abitibi
                                                                                                                                   with Mineral Reserves of 3.55 Moz (50%)
                                                                                                                                   Odyssey and East Malartic deposits the
                                                                                                                                   subject of drilling and technical studies

                                                                                                                                   Jacobina (Au) - underground
                                                                                                                                   Primary development tracking ahead of
                                                                                                                                   plan while per tonne expenditures are
      El Peñón (Au/Ag) - underground
                                                                                                                                   declining. Line of sight to the strategic
      Right-sized for next phase of its evolution
                                                                                                                                   objective of 150,000 oz within 3 years
      at ~200,000 GEO/yr

      Gualcamayo (Au) – open pit/underground
      Near-mine oxide heap leach targets with
      longer-term sulphide opportunities

      Minera Florida (Au/Ag/Zn) - underground
      Interim period with higher grades, higher
      recoveries, but lower tonnes
      With consolidated land package - line of
                                                                                                                                   Chapada (Au/Ag/Cu) – open pit
      sight to 130,000 oz/yr gold
                                                                                                                                   Interim focus on process optimization
                                                                                                                                   (recoveries, throughput rates and
                                                                                                                                   stability), while medium-term
                                                                                                                                   opportunities taking shape with Suruca,
Aggregate reserve life - 13 years                                        (1)
                                                                                                                                   Baru and Sucupira higher grade cores

1.   Reserve life calculated based on Proven & Probable Gold Mineral Reserves excluding Agua Rica, Brio Gold, and Jeronimo and divided by 2017 production.                     3
2.   A non-GAAP measure. A reconciliation of the IFRS measure to this non-GAAP measure can be found at www.yamana.com/Q32017.
2017 Production Exceeds Guidance

            Gold Production                          Silver Production                      Copper Production
                                        977moz
                                         977k oz                 5.0m oz       5.0m oz                                127m lbs
                                                                                                        125m lbs
                           960k oz

             940k oz
                                                     4.7m oz                                120m lbs
920k oz

       940moz

 Original     Updated       Updated      Full Year    Original     Updated      Full Year    Original     Updated      Full Year
Guidance    Guidance Q1   Guidance Q3   Production   Guidance    Guidance Q3   Production   Guidance    Guidance Q3   Production

                                                                                                                                   4
Select 2017 Operational
and Financial Achievements
Increased production Continued to enhance
guidance - twice for gold,
once each for copper and
financial flexibility and
protect the balance sheet
silver for the final phase of Cerro
Moro development
Exceeded updated guidance $162.5M monetization of certain
for all metals 50%-owned exploration
properties
Delivered production of all $300M of senior notes sold at
metals at costs in line with
or better than guidance
attractive terms – proceeds to
repay outstanding debt as it
comes due, including in 2019
Advanced Cerro Moro $125M copper advanced sales
program to better balance cash
according to plan and
positioned it to begin
operations in a few months
flows
C$100M raised through sale of
Brio Gold shares
5Select 2017 Strategic Developments
Rightsized several operations Improved the management
to optimize production then
exceeded those production
construct and refreshed the
Board of Directors
levels
Repositioned the geographic
Rightsized the portfolio presence with a continuing
with a focus on longer term
cash flow growth focus on the Americas
(Canada, Brazil, Chile and
Delivered significant Argentina)
exploration successes at
almost all mines and Initiated a program of
strategic evaluation of the
projects
Advanced several plans for
portfolio and certain
monetization initiatives
longer term pipeline and
production including
Chapada, Monument Bay
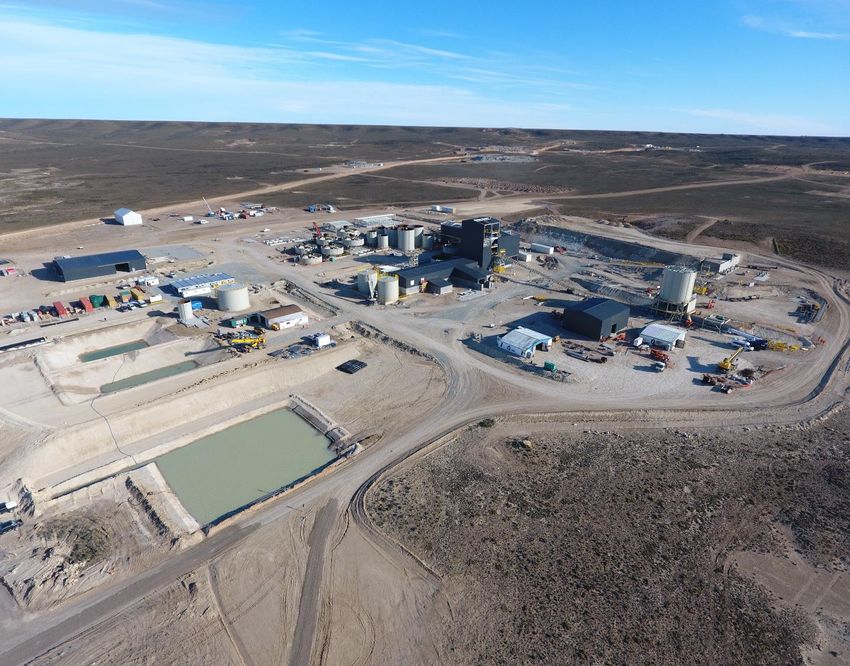
6Cerro Moro
Project Progress at Year End 2017
Project remains on schedule and on
Production Forecast
budget
2018 2019
Completion of the mechanical discipline
in the processing facility was achieved Tonnes Processed 1,000 tpd capacity
Grade – gold (g/t) 11.3 11.7
Underground and open pit mine
silver (g/t) 650 920
development is now being managed by Recovery – gold 95% 95%
Operations silver 93% 93%
Production – gold (koz) 80 130
Underground development progressed silver (moz) 4.5 9.9
according to plan producing a high grade
stockpile of approximately 16,265 tonnes
grading 27 g/t gold and 1,725 g/t silver Optimal mix of gold and silver
Open pit operations have commenced is under evaluation
while development activities are
underway at the high grade Escondida
Central pit
Ramp up of operations expected in Q2
2018
7A Compelling Valuation
With Multiple Near Term Catalysts
Current 2018E-2019E Free Current Price/2018E CFPS
Cash Flow1 to Market Trading Multiples
Capitalization
25% 16.00
14.00
20%
12.00
10.00
15%
8.00 Highest
Multiple
10% Yamana 6.00 Peer
Peer
4.00 Group
5% Peer
Yamana Average
Group 2.00
Average
0% 0.00
NEAR TERM CATALYSTS
Support a compelling investment opportunity as value is surfaced
Source: FactSet; Based on Consensus Analyst estimates and NYSE closing trading prices as of January 12, 2018
Peer group includes: Agnico Eagle, Alamos Gold, B2Gold, Barrick Gold, Eldorado Gold, Goldcorp, IAMGOLD, Kinross Gold, New Gold, Newmont Mining and Tahoe Resources 8
1. Cumulative FCF defined as cumulative Operating Cash Flow less Total Capex over the 2018-2019 period based on Consensus Analyst EstiamtesInvestor Relations
200 Bay Street, Suite 2200
Toronto, Ontario
M5J 2J3
416-815-0220/1-888-809-0925
investor@yamana.com
www.yamana.com
9You can also read


