Q2-2019 Nova Austral Financial Presentation - August 2019 - cloudfront.net
←
→
Page content transcription
If your browser does not render page correctly, please read the page content below

Q2-2019 Nova Austral Financial Presentation
                                   August 2019
Agenda

    A               B               C             D
 Company        Stocking and     Operational    Financial
 highlights   harvest guidance    metrics      statements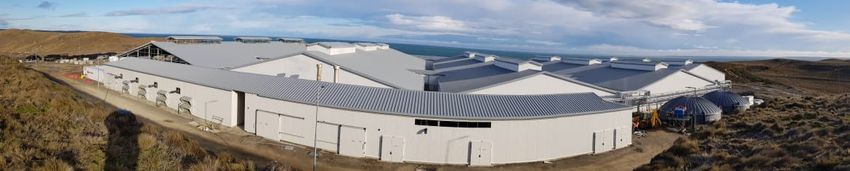
A
Company
highlights
•   Message from the Board of Directors
•   Management Changes
•   Investment Value Fundamentals
•   Business Update
•   Hatchery

Nova Austral Q2-2019 Financial Report                            A Message from the Board

A Message from the Board of Directors

• At the direction of the Board of Directors, the Company continues to devote significant resources to
  the situation we described on the investor call on July 16th. We remain fully committed to resolving
  this matter and working with all relevant stakeholders towards understanding and addressing pending
  legal and regulatory matters.

• Since our last investor call, the Company has made several leadership and personnel changes,
  including appointing an interim in-house legal and compliance advisor, and is in the process of
  developing and implementing further improvements to its compliance program.

• Both Sernapesca and the SMA have filed public complaints against the company; however no
  sanctions have yet been imposed, and the Company continues to operate as usual. In the event any
  sanctions are imposed, the Company would have the opportunity to appeal before sanctions come
  into effect.

• While it will take time to resolve these matters and we cannot provide any certainty concerning
  potential sanctions, the Company and the Board remain committed to transparency and cooperation,
  and importantly to delivering for its customers and upholding the highest standards in its operations.

• Both Altor and Bain Capital remain engaged shareholders aiming to support the Company through
  this situation, and to continue to build long-term value reinforcing Nova Austral’s position in the
  market.

                                                                                                           4
Nova Austral Q2-2019 Financial Report                          A Changes in Top Management

New management poised to execute on Nova Austral vision

               Francisco Miranda
               COO

                •   Francisco has more than 20 years of salmon industry experience and joined
                    Nova Austral from Cermaq, the second largest salmon farmer globally.
                •   He brings broad international experience from Canada, Scotland, and Norway.
                •   Francisco leads all sales and operations of the Company.

               Nicolas Larco
               CFO

               •    Nicolas brings a wealth of financial experience, joining recently from Cencosud
                    Chile where he served as Chief Financial Officer.
               •    Nicolas will improve Company reporting and strategic financial planning, and
                    brings strong public markets and investor relations experience to enhance
                    communication with investors.
               •    Nicolas will also lead the company’s support activities, including IT and HR.

                                                                                                      5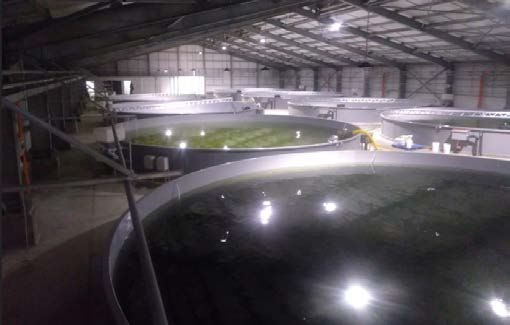
Nova Austral Q2-2019 Financial Report                                                            A Investment value fundamentals

Aim to improve value fundamentals, compliance, and transparency going forward

              Value Fundamentals                                                    KPI                           LTM Q2-2019               Target

                                                              % ABF standing biomass (Nª fish)                          100%                 100%
   Produce pure Antarctic salmon with
                                                                % Completion Hatchery Facility                           90%                 100%
     control over biological chain…
                                                                 % Internal smolt in operations                           0%                 100%
    …which sells at a premium market
                                                                 % Sold as premium (kg WFE)                              58%                  65%
                  rate

       Focus on efficient production                               USD/Kg WFE ex cage cost                                4.0                  3.4

                                                                       % Seawater mortality*                             31%                  10%
  Prioritize transparency with focus on
                                                                         Avg. caligus load**                            < 0.3                 < 0.5
                performance
                                                                       eFCR Closed cycle***                              1.31                 1.15
Comments
• Nova Austral’s critical competitive advantage - pure, antibiotic free salmon - remains in place and is not affected by
  the recent compliance difficulties
• NA continues to improve its cost of production, with its ex cage cost reduced from USD 4.4 in 2018 to USD 4.0 LTM
  Q2-19
• New management values compliance and transparency, and will report on the listed KPIs going forward (in addition to
  other corporate compliance reporting)
* Mortality is for closed cycles
** Avg. Caligus load is reported for female eggs figures (HO – hembras ovigeras)                                                                         6
*** Efcr (economic Feed Conversion Ratio) - weight of feed administered over the salmon lifetime divided by the salmon weight. Reported on a LTM basis
Nova Austral Q2-2019 Financial Report                                       A Business Update

Business Update

• Certifications (ABF & ASC):
    – Internal investigation concluded that Nova Austral upheld its antibiotic-free customer
      commitments.
    – Nova Austral continues to engage with relevant stakeholders to regain certifications.
    – Prices expected to retain a market premium due to high quality product and no use of antibiotics*

• Mortality:
    – Nova Austral experienced an average mortality of 13%** across its production sites during Q2.
      The company will report mortality going forward to increase transparency with its investors.

• Key Financial Highlights***:
    – Increase of 4% in revenues due to 15% increase in volumes sold.
    – Significant reduction in COGS of 18% due to improvement on biological key indicators (mortality /
      feed conversion rate).
    – EBITDA increased 44% as a result of the aforementioned operational improvements.
    – Cash flow from operations significantly increased due to working capital improvements.

* Price premium expected to be lower until the certifications are granted
** Mortality is for sites harvested during the quarter                                                    7
*** Key financial highlights compare Q2-19 to Q2-18
Nova Austral Q2-2019 Financial Report                 A Hatchery Update

                              Comments

                              • Construction at 90% completion, expected to be 100% operational
                                end of October 2019.
                              • Operations running in line with latest business plan, with two
                                batches already in production phase. First batch to stock in Oct-19,
                                with second in Feb-20.
                              • Mortality showing good performance, 13.9% acc av. per batch in
                                line with company expectation.
                              • Commercial opportunity exists for Nova Austral to sell excess
                                smolt until NA’s own stocking requires all of production.

                                                                                                  8
B
Market outlook &
harvest guidance
•   Price Outlook
•   Global Supply Outlook
•   NA Stocking and Harvest

Nova Austral Q2-2019 Financial Report                                                B Price Outlook

Fishpool forward prices Nok/Kg                                          Fresh Trim D Comparation H1-19 Prices

                                                                            6.50
                               60.0      60.0      59.8                     6.25
   58.9
                                                                            6.00

                                                             Price USD/lb
                                                                            5.75
               56.0
                                                                            5.50

                                                                            5.25

                                                                            5.00

                                                                            4.75

                                                                            4.50
  Q3'19       Q4'19            2019      2020      2021                            Jan     Feb       Mar   Apr      May       Jun
                                                                                         Nova 2019         Av UB 2019/Miami

Comments

• Analyst expectation still with stable price trend for 2019/2020, with level of 60 NOKs.
• During 1H-19, NA prices performed above the average market prices in US and Europe.
• During 2H-19, NA prices will remain internationally competitive with a slight market premium.

Source: Pareto, Fishpool
                                                                                                                                    10
Nova Austral Q2-2019 Financial Report B Global Supply Outlook
Global Supply Outlook
The world production of Atlantic Salmon (rw 1,000 tons) % Y/Y growth
Country 2018 2019e 2020e 2021e 2022e 2018 2019e 2020e 2021e 2022e
Norway 1253 1293 1389 1466 1520 4% 3% 7% 5% 4%
Chile 677 702 736 760 798 17% 4% 5% 3% 5%
UK 152 179 184 188 194 -16% 15% 3% 2% 3%
Canada 145 147 156 168 183 4% 1% 6% 7% 8%
Faroes 72 80 83 86 91 -11% 10% 4% 3% 5%
USA 19 17 20 28 39 -16% -12% 15% 29% 28%
Ireland 16 16 17 17 17 -6% 0% 6% 0% 0%
Australia 61 62 67 70 72 0% 2% 7% 4% 3%
Iceland 14 23 44 58 74 14% 39% 48% 24% 22%
Other 9 22 24 26 31 -56% 59% 8% 8% 16%
Total Production 2418 2541 2720 2867 3019
Anual growth 5% 5% 7% 5% 5% 5% 5% 7% 5% 5%
Source: Pareto, Kontali
Comments
• Supply growth expected to remain relatively stable at 5% in 2019, increasing slightly to 7% in 2020, then back to 5%
for 2021/2022 (YOY).
11Stocking and Harvest B Historic & Forward Production Guidance
Production Parameters
Release Number (FY)
Estimate
6.0 7.2
2017 2018 2019
27.3 19.4 23.2
Harvest Biomass (WFE)
Comments
• NA Harvest in 2017 was significantly higher than 2018 due primarily to poor smolt quality in 2018.
• No estimate provided for 2019 stocking as NA is awaiting final stocking figures to be provided by Chilean regulatory
fishing body.
• Note there is no expected impact to stocking figures from Beagle Channel due to ongoing legal disputes.
• NA will update the market should any new site stocking opportunities come into operations.
12C Operational metrics • Key Financials Summary Q2 • Key Financials Summary YTD • LTM Revenue, EBITDA & Harvest • Revenues & EBIT/Kg per Q • Sales Outlook YTD Q2-19
Nova Austral Q2-2019 Financial Report                   C Key Financials Summary Q2

 Key items (USDm)                    Q2'19   Q2'18     Var       Comments
 Operational revenues (*)            33.9    32.5      4%         • Higher Operational Revenues
 Operational EBITDA (**)              9.0     6.3     43%           explained by higher volume
                                                                    sold mainly in value
 Operational EBITDA %                26.6%   19.4%   720 pbs        added products.
 Operational EBIT (**)                7.1     4.8     48%         • Strong increase in EBITDA
                                                                    and EBIT compared to Q2-18
 Operational EBIT %                  21.1%   14.6%   650 pbs        despite lower sales prices.
 Others Non-operational              -0.6     6.9    -109%          Increase driven by lower
                                                                    production costs and higher
 Net financial items                 -5.3    -2.9     81%           sales volume (and
                                                                    consequently – an increase
 Profit or loss for the period        1.2     9.0     -86%
                                                                    in NL).
 Cash flow from operations           12.6     2.5     402%        • Others Non-Operational
 Total assets                        384.9   469.6    -18%          decrease mainly due to lower
                                                                    biomass fair value.
 NIBD                                297.8   294.8     1%
                                                                  • Net financial items loss
 Total Equity                         5.2    121.6    -96%          increased due to less
                                                                    intercompany interest income.
 Sales volume ('000 mt WFE)           5.1     4.5     15%
                                                                  • Cash Flow improvement due
 COGS per kg WFE (‘000 mt WFE)       5.45    6.27     -18%          to better supplier payment
 Operational EBIT per kg WFE – USD    1.4     1.1     30%           conditions and higher
                                                                    NL collection.

(*) Not considering Navarino Law
(**) Before NRI                                                                                    14
Nova Austral Q2-2019 Financial Report C Key Financials Summary YTD
YTD Key items (USDm) YTD Q2'19 YTD Q2'18 Var Comments
Operational revenues (*) 57.2 62.9 -9% • Lower Operational Revenues
Operational EBITDA (**) 15.2 10.9 39% explained by lower volumes
and prices during Q1-19, due
Operational EBITDA % 26.6% 17.5% 910 pbs to lower harvest (-1,130 tons)
and market conditions.
Operational EBIT (**) 11.4 7.7 48%
• Profit decrease driven by less
Operational EBIT % 19.9% 12.2% 770 pbs intercompany interest income.
Others Non-operational 7.1 7.8 -9% • Total EBITDA and EBIT per
Kg/USD shows an increase
Net financial items -10.6 -5.7 85%
compared with Q2-18, mainly
Profit or loss for the period 3.0 10.1 -70% due to lower production costs
and higher sales volume (and
Cash flow from operations 3.7 3.7 -1% consequently – an increase
Total assets 384.9 469.6 -18% in NL).
NIBD 297.8 297.3 0,2%
Total Equity 5.2 121.6 -96%
Sales volume ('000 mt WFE) 8.7 9.0 -3%
Operational EBIT per kg WFE – USD 1.3 0.9 44%
(*) Not considering Navarino Law
(**) Before NRI 15Nova Austral Q2-2019 Financial Report C LTM Revenue, EBITDA & Harvest
LTM Revenues & LTM EBITDA* Comments
159.2 • Q2-19 LTM Revenues lower
126.8 than LTM Q2-18 due to lower
harvest volumes (5,000 tons) in
the same period. Majority of
67.9
53.8 difference stems from
significantly higher 2H-17
harvest than 2H-18.
Q2´19 Q2'18
LTM Revenue LTM EBITDA
LTM Harvest x Q, K Ton WFE
• Expected increase in harvest
Estimate during Q3 and Q4 2019 is the
25.2
23.9 23.2 result of a delay in the stocking
20.5 21.5 of two sites in 2018.
19.2 18.2 18.9
Q1'18 Q2'18 Q3'18 Q4'18 Q1'19 Q2'19 Q3e'19 Q4e'19
* LTM EBITDA before NRI’s
16Nova Austral Q2-2019 Financial Report C Revenue & EBIT/Kg per Q
Operational Revenues Comments
41.1 • Operational revenues
32.5 33.9 increased 45% from Q1-19 to
30.4 28.5 Q2-19 and 4% from Q2-18 due
23.3 to higher sales volume.
Q1'18 Q2'18 Q3'18 Q4'18 Q1'19 Q2'19
EBIT/Kg WFE (USD)*
3.5 • EBIT/kg increased 27% from
3.3
Q2-18 to Q2-19 due to higher
volumes, more efficient harvest
and production (and
1.4 consequently – higher NL).
1.1 1.2
0.7
Q1'18 Q2'18 Q3'18 Q4'18 Q1'19 Q2'19
EBIT x Q, USD/Kg WFE (*)
* LTM EBIT/kg WFE before NRI’s
17Nova Austral Q2-2019 Financial Report C Sales Outlook YTD Q2-19
H1 2018 % Sales income by product H1 2019 % Sales income by product
6%
6%
Fresh fillets & HON Fresh fillets & HON
25%
Frozen HON 34% Frozen HON
27% 29%
Frozen Fillets Frozen Fillets
Frozen Portions Frozen Portions
12% 30% Frozen Others Frozen Others
16% 15%
H1 2018 % Sales income by market H1 2019 % Sales income by market
ASIA 6% ASIA
4%
31% EU EU
29%
46% 33% OTHERS
OTHERS
RUSSIA RUSSIA
US US
6%
32% 4%
9%
Comments
• The NA strategy shifted from a product mix focused on Frozen HON, to Fresh fillets & HON and Frozen Portions due
to higher prices and more stable customers.
• This strategy, in turn, changed the company’s market landscape as most of the demand for Fresh fillets & HON and
Frozen Portions comes from the US and Europe.
• Russia remains an important market for the company due to its large orders of Frozen HON and Frozen fillets.
18D Financial statements • Q2-19 IFRS Income Statement • YTD Q2-19 IFRS Income Statement • Q2-19 IFRS Balance Sheet Statement • Q2-19 IFRS Cash Flow Statement • YTD Q2-19 IFRS Cash Flow Statement • YTD Q2-19 IFRS Change in Equity
Nova Austral Q2-2019 Financial Report                         D Q2-19 IFRS Income Statement

Income statement (USD m)                     Q2’19   Q2’18    Var      Comments
Revenues                                     33.9    32.5     4%
                                                                        • Increase in Administration cost
Cost of goods sold                           -26.2   -26.5   -1%          due to variable labor cost.
Gross profit before fair value adjustments    7.7     6.0    28%
                                                                        • Lower financial income due to
Other income (*)                              7.2     5.4    32%          the capitalization of the debt
Other Cost                                    0.0     0.0     0%          that the Holdco company had
                                                                          with NA.
Distribution Cost                            -2.6    -2.3    11%
Administration Cost                          -3.2    -2.8    14%        • Fair value decrease mainly due
                                                                          to lower prices in 2019
EBITDA before fair value adjustment           9.0     6.2    44%          compared to 2018.
Depreciation                                 -1.9    -1.5    27%
EBIT before fair value adjustment             7.1     4.8    50%
Fair value adjustments                        0.8     9.2    -91%
EBIT with fair value adjustments              8.0    14.0    -43%
Other earnings/costs                         -1.3    -0.2    445%
Net Financial Income/Expenses                -5.3    -2.9    81%
Foreign exchange costs                       -0.1    -2.1    -94%
Earnings before taxes                         1.2     8.7    -86%
Tax                                           0.0     0.3    -107%
Net profit (loss)                             1.2     9.0    -86%
Total comprehensive income                    1.2     9.0    -86%

(*) Included Navarino Law Income
                                                                                                       20
Nova Austral Q2-2019 Financial Report D YTD Q2-19 IFRS Income Statement
Income statement (USD m) YTD Q2’19 YTD Q2’18 Var Comments
Revenues 57.2 62.9 -9%
• Lower Operational Revenues
Cost of goods sold -46.9 -52.4 -10% explained by lower volumes and
Gross profit before fair value adjustments 10.3 10.5 -2% prices during Q1-19, due to
Other income (*) 10.9 9.9 9% harvest and markets conditions.
Other Cost 0.0 0.0 0% • Decrease in other earnings &
cost due to losses in PTF
Distribution Cost -4.5 -4.3 5%
subsidiary participation of US
Administration Cost -6.5 -5.4 20% $1m.
EBITDA before fair value adjustment 10.2 10.7 -5% • Lower financial income due to
Depreciation -3.7 -3.0 24% the capitalization of the debt
EBIT before fair value adjustment 6.5 7.7 -16% that the Holdco company had
with NA.
Fair value adjustments 8.8 9.5 -8%
EBIT with fair value adjustments 15.3 17.3 -12%
Other earnings/costs -1.7 -0.1 1,335%
Net Financial Income/Expenses -10.6 -5.7 85%
Foreign exchange costs 0.0 -1.6 -102%
Earnings before taxes 3.0 9.8 -69%
Tax 0.0 0.3 -107%
Net profit (loss) 3.0 10.1 -70%
Total comprehensive income 3.0 10.1 -70%
(*) Included Navarino Law Income
21Nova Austral Q2-2019 Financial Report D Q2-19 IFRS Balance Sheet Statement
Balance sheet (USD m) Q2´19 Q2´18 Var Comments
Cash and cash equivalents 2.2 5.2 -58%
Accounts receivable 19.3 15.6 24% Current Assets:
Inventories 28.1 32.3 -13% • Main effect in biological asset
Current biological assets 90.6 77.5 17% due to 5,5 Mton more in
Tax and other current assets 29.1 31.7 -8% biomass with US $6m in stock
Total current assets 169.3 162.3 4% value and US $7m in fair value.
Intangible assets other than goodwill 11.9 7.0 69%
Non-Current Assets:
Property, plant, and equipment 68.3 60.4 13%
Biological assets, non-current 14.6 9.3 58% • Decrease capital in August 2018
Other non-current assets 120.7 230.6 -48% in HoldCo credit.
Total non-current assets 215.5 307.3 -30% • Increase in intangible assets
Total assets 384.9 469.6 -0,3 due to partial payment of $4m
Paid in capital 1.0 118.9 -99% for purchase of Pesquera Cabo
Retained earnings 4.2 2.7 54% Pilar S.A. (Beagle Channel).
Total equity 5.2 121.6 -96%
Current Liabilities:
Other current financial liabilities 12.4 2.5 404%
Accounts payable 65.2 43.6 50% • Used US $10m of Super Senior
Accounts payable to related entities 0.0 0.0 0% Multicurrency.
Other current liabilities 2.1 2.0 4% • Increase in accounts payable
Total current liabilities 79.7 48.0 66% mainly due to lower feed
Other non-current financial liabilities 300.0 300.0 0% supplier payments of US $8m
Accounts payable to related entities 0.0 0.0 0% and utilization of factoring facility
Total non-current liabilities 300.0 300.0 0% of US $7m above 2018.
Total liabilities 379.7 348.0 9%
Total Equity and liabilities 384.9 469.6 -18%
22Nova Austral Q2-2019 Financial Report D Q2-19 IFRS Cash Flow Statement
Cash Flow Statement (*) Q2´19 Q2´18 Var
Receipts from sales of goods and rendering of services 31.0 32.5 -5%
Comments
Other cash receipts from operating activities 9.6 6.0 61%
Payments to suppliers for goods and services -29.2 -36.1 -19% Operating Activities:
Payments to and on behalf of employees -4.4 -4.3 3% • Higher Navarino Law collection
Payments for premiums and claims annuities and other of US $3.6m.
policy benefits -0.6 -1.0 -44%
Income taxes paid or refunded 6.3 5.6 12% • Higher export VAT income of US
Other inflows or outflows of cash -0.1 -0.2 -50% $0.7m.
Net cash from operating activities 12.6 2.5 402% • Improved payment terms with
Cash flows used In obtaining control of subsidiaries or feed suppliers.
other businesses -2.5 0.0 100%
Purchase of property plant and equipment -3.6 -1.7 115% Investment Activities:
Loans to related entities 0.0 -3.4 -100% • Higher payments for hatchery
Proceeds from sales of property plant and equipment 0.0 0.0 0% project.
Other inflows or outflows of cash 0.0 0.0 0%
Net cash from investing activities -6.2 -5.1 21% Financing Activities:
Proceeds from borrowings short terms 8.0 0.0 100% • Short term debt withdrawal of
Interest payment -12.4 -12.4 0% US $8m and payment of US
Payment of loans, short term -3.0 0.0 100% $3m.
Payment of loans, long term 0.0 0.0 0%
Other inflows or outflows of cash -0.2 3.6 -104%
Net cash from financing activities -7.6 -8.8 -14%
Change in cash before effect of exchange
rate changes -1.1 -11.4 -90%
Effect of exchange rate changes on cash and
cash equivalents 0.3 0.0 1,550%
Cash and cash equivalents b.o.p 3.0 16.6 -82%
Cash and cash equivalents e.o.p (**) 2.2 5.2 -58%
(*) Company change CF statement, from indirect to direct method starting Q2-19, the comparative figure for 2018 are reported with direct method
(**) In addition we have a WK facility of USD m 50 (USD m 10 drawn at Q2-19) 23Nova Austral Q2-2019 Financial Report D YTD Q2-19 IFRS Cash Flow Statement
Cash Flow Statement (*) YTD Q2´19 YTD Q2´18 Var
Receipts from sales of goods and rendering of services 62.7 76.1 -18%
Comments
Other cash receipts from operating activities 14.5 15.9 -9%
Payments to suppliers for goods and services -72.2 -84.3 -14%
Operating Activities:
Payments to and on behalf of employees -8.8 -10.0 -12% • Higher export VAT income.
Payments for premiums and claims annuities and other
policy benefits -1.1 -2.0 -43% • Lower customer return.
Income taxes paid or refunded 9.1 8.3 10% • Lower payments to suppliers
Other inflows or outflows of cash -0.4 -0.3 52% due to improved payment terms
Net cash from operating activities 3.7 3.7 -1% with feed suppliers.
Cash flows used in obtaining control of subsidiaries or
other businesses -6.6 0.0 100% Investment Activities:
Purchase of property plant and equipment -5.4 -3.4 61% • Partial payment of $4m for
Loans to related entities 0.0 -3.4 -100% purchase of Pesquera Cabo
Proceeds from sales of property plant and equipment 0.0 0.0 0% Pilar S.A. (Beagle Channel).
Other inflows or outflows of cash 0.0 0.0 0%
Net cash from investing activities -12.0 -6.8 77% • Contributions of $2.5m in funds
Proceeds from borrowings short terms 13.0 0.0 100% for the hatchery.
Interest payment -12.4 -12.5 0% Financing Activities:
Payment of loans, short term -3.0 0.0 100%
• Short term debt withdrawal of
Payment of loans, long term 0.0 0.0 0%
$13m and payment of $3m.
Other inflows outflows of cash -0.3 -6.5 -95%
Net cash from financing activities -2.8 -19.0 -86%
Change in cash before effect of exchange
rate changes -11.0 -22.0 -50%
Effect of exchange rate changes on cash and
cash equivalents 0.2 -0.4 -159%
Cash and cash equivalents b.o.p 13.0 27.6 -53%
Cash and cash equivalents e.o.p (**) 2.2 5.2 -58%
24Nova Austral Q2-2019 Financial Report D YTD Q2-19 IFRS Change in Equity
YTD Q2-19 IFRS Changes in Equity
Changes in equity Q2´19 Share capital Retained earnings (Other(s)) Total equity
Equity as at 01.04.19 1.0 3.0 0.0 4.0
Net profit for the period 0.0 1.2 0.0 1.2
Comprehensive income 0.0 0.0 0.0 0.0
Equity as at 30.06.2019 1.0 4.2 0.0 5.2
Changes in equity YTD Q2´19 Share capital Retained earnings (Other(s)) Total equity
Equity as at 01.01.19 1.0 1.2 0.0 2.2
Net profit for the period 0.0 3.0 0.0 3.0
Comprehensive income 0.0 0.0 0.0 0.0
Equity as at 30.06.2019 1.0 4.2 0.0 5.2
25Nova Austral Q2-2019 Financial Report D Non-recurring items
Summary of Non-Recurring Items
NRI Summary Q1'17 Q2'17 Q3'17 Q4'17 Q1'18 Q2'18 Q3'18 Q4'18 Q1'19 Q2'19
Volume Harvest Loss
2,141 2,295 2,040 752 12,292 4,097 2,000
Contribution
Cost Effect on Biomass 12,000 4,000 3,000
Restructure Cost MKT / Org 114 39 99 43 144 86 100
YTD NRI 2,611 4,589 6,728 7,523 144 231 24,623 32,720 5,000 5,000
NRI LTM 2,611 4,843 6,898 7,523 5,412 3,164 25,417 32,720 37,576 37,489
Comments
• No NRI’s incurred in Q2-19
26Nova Austral Q2-2019 Financial Report Responsibility statement
Responsibility statement
The Board of Directors of Nova Austral S.A. consists of Halvor Horten from Bain Capital Private Equity (Europe), LLP,
Tom Jovik from Altor Equity Partners AS, and Yngve Myhre. Company management consists of Nicolas Larco (CFO)
and Francisco Miranda (COO).
We confirm to the best of our knowledge that the condensed set of financial statements for the half year ended June 30,
2019 has been prepared in accordance with IAS 34 –Interim Financial Reporting and give a true and fair view of the
assets, liabilities, financial position and results of Nova Austral S.A. and the Nova Austral group as a whole for the
period. We also confirm to the best of our knowledge that the financial review includes a fair review of important events
that have occurred during the first six months of the financial year and their impact on the financial statements, and a
description of the principal risks and uncertainties for the remaining six months of the financial year.
27Nova Austral Q2-2019 Financial Report Global Call details
Global Call, Wednesday September 4th, 15:00 CET; 14:00 UK; 9:00 US ET
Dial-In Details:
Participant Standard International Dial-In: +44 (0) 2071 928000
Conference ID: 2394225
Additional Participant Free Dial-In Numbers Listed Below:
– United Kingdom +44 (0) 2071 928000
– Norway 80051874
– United States 18669661396
– Chile 12300200240
– Sweden 0200125581
– Denmark 80718097
Q&A Details:
During the call, investors have the opportunity to ask questions on the operational and financial
performance of the company. For questions related to the pending legal and regulatory matters, you
may only send questions in advance before Tuesday 12.00 GMT to
NovaAustralBondHolders@fticonsulting.com.
28Q2-2019 Nova Austral Financial Presentation
August 2019You can also read