Smead Value Fund 1st Quarter 2021 Webcast
←
→
Page content transcription
If your browser does not render page correctly, please read the page content below
Smead Value Fund
                                                                                             1st Quarter 2021 Webcast

   This material is provided for informational purposes only and should not be
   construed as investment advice. Forecasts and opinions reflect the personal
     judgments of the presenter and may not reflect those of Smead Capital
          Management. Statements and opinions are subject to change.

www.smeadcap.com                                                        © 2021 Smead Capital Management (SCM), All Rights Reserved.

             Opinions are subject to change, are not guaranteed, and should not be considered recommendations to buy or sell any security.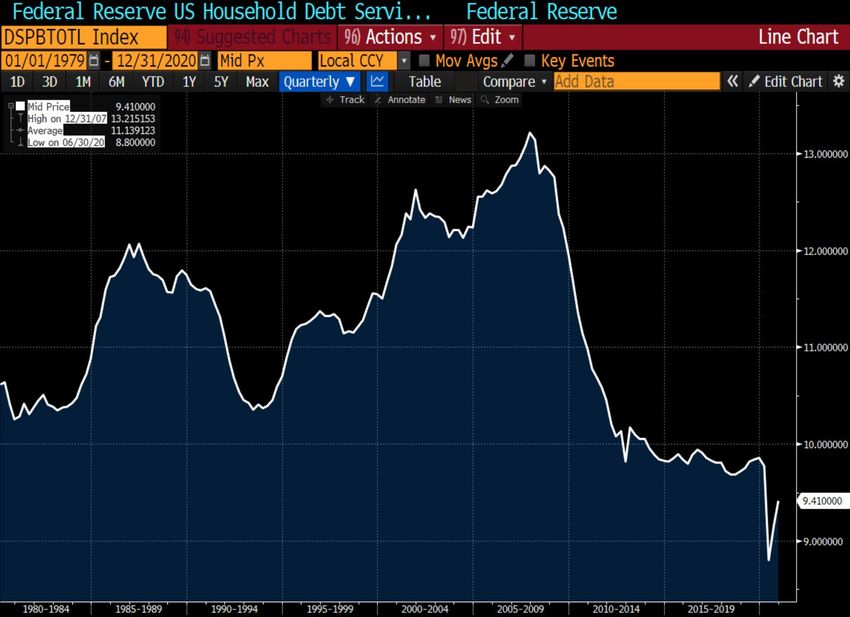
Today’s Agenda
Performance, Characteristics and Top 10 Holdings
Cole Smead, CFA, Portfolio Manager
Featured Stock: Merck & Co., Inc. (MRK)
Tony A. Scherrer, CFA, Portfolio Manager
Winning the Peace
Bill Smead, Lead Portfolio Manager
2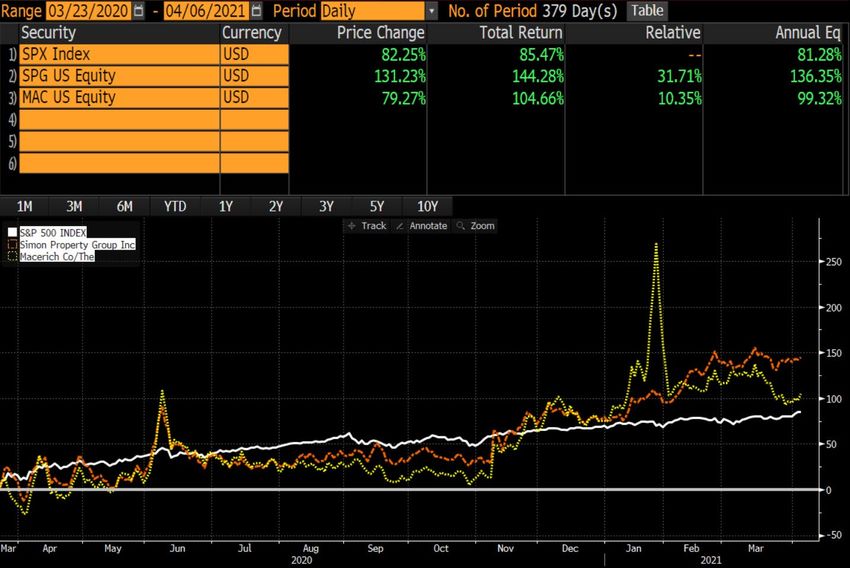
Quarter-End Performance
    Total Returns (%) as of March 31, 2021

                                                                                                                                                 Since
                                                            Qtr            YTD           1 Year         3 Year          5 Year       10 Year   Inception

     Smead Value Fund Investor Class (SMVLX)             20.22%          20.22%         79.86%         15.26%          14.43%        14.49%     9.75%

     Smead Value Fund A Share w/ load (SVFAX)            13.32%          13.32%         69.47%         13.03%          13.12%        13.74%     9.15%

     Smead Value Fund A Share w/o load (SVFAX)           20.24%          20.24%         79.83%         15.28%          14.47%        14.42%     9.64%

     Smead Value Fund I1 Share Class (SVFFX)*            20.29%          20.29%         80.28%         15.56%          14.74%        14.78%     9.99%

     Smead Value Fund C Share Class (SVFCX)              20.08%          20.08%         79.55%         15.20%          14.39%        14.47%     9.74%

     Russell 1000 Value Index                            11.26%          11.26%         56.09%         10.96%          11.74%        10.99%     7.59%

     S&P 500 Index                                        6.18%          6.18%          56.35%         16.78%          16.29%        13.91%    10.09%

    *Institutional Shares were renamed I1 shares on 11/21/2014 with a new ticker SVFFX
    Investor Shares Gross Expense Ratio 1.26%
    A Shares Gross Expense Ratio 1.26%
    I1 Shares Gross Expense Ratio 0.99%
    C Shares Gross Expense Ratio 1.85%
    Performance data quoted represents past performance; past performance does not guarantee future results. The investment return and principal
    value of an investment will fluctuate so that an investor’s shares, when redeemed, may be worth more or less than their original cost. Current
    performance of the Fund may be lower or higher than the performance quoted. Performance data current to the most recent month end may be
    obtained by calling 877-807-4122. Performance for SVFAX (w/load) reflects maximum sales charge of 5.75%. Performance for SVFAX w/o load
    does not reflect maximum sales charge of 5.75%. If reflected, the load would reduce the performance amount quoted. SVFAX applies a maximum
    Deferred Sales Charge on Class A shares only to purchases of $1,000,000 or more that are redeemed within 18 months of purchase. Performance
    data does not reflect the redemption fee. If it had, returns would be reduced.
    Investor Class shares of the Fund commenced operations on January 2, 2008. I1 Class shares of the Fund commenced
    operations on December 18, 2009. Performance shown for I1 Class shares prior to its inception reflects the performance of
    Investor Class shares. Class A shares of the Fund commenced operations on January 24, 2014. Performance shown for
    Class A shares prior to its inception reflects the performance of Investor Class shares, adjusted to reflect Class A expenses.
3   Performance data is annualized for periods longer than one year. Performance data is cumulative for periods shorter than one year.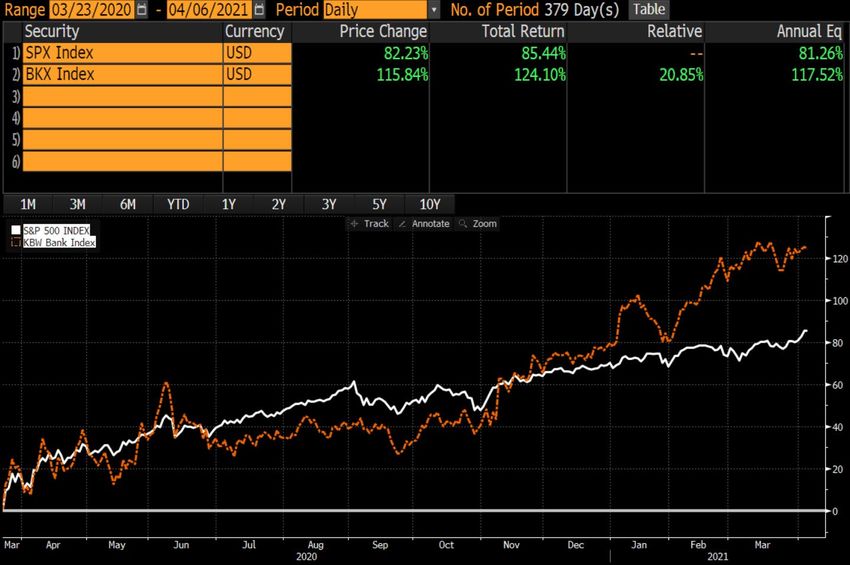
Smead Value Fund
    Key Facts and Characteristics as of March 31, 2021

                                                             Price to
                                                             Earnings
                                                              (P/E)

4    Past performance does not guarantee future results. P/E: Price to earnings ratio.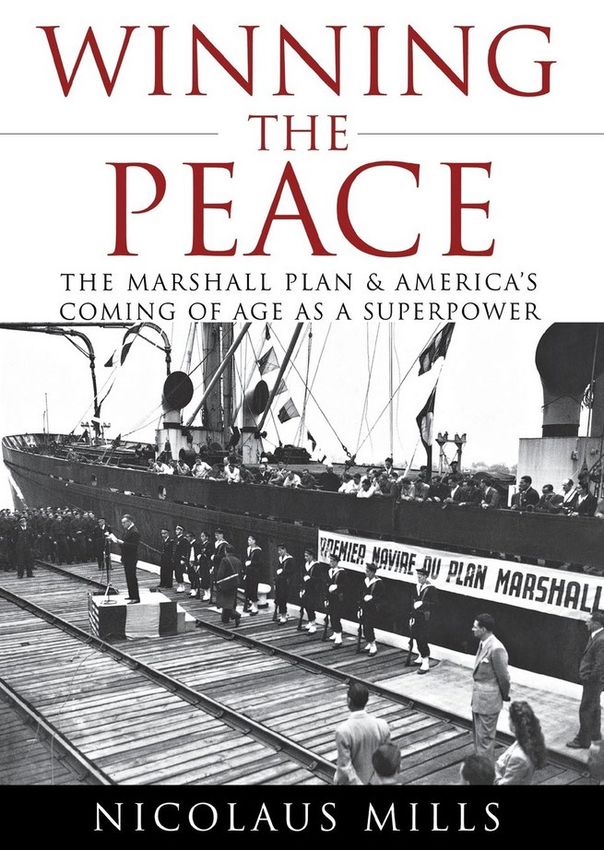
Smead Value Fund
    Top Ten Holdings as of March 31, 2021

                                                                         Percentage of Fund

                                        Lennar Corp                                                                                    6.21%

                             American Express Co                                                                                5.64%

                                        Target Corp                                                                            5.58%

                                             NVR Inc                                                                       5.28%

                                          Amgen Inc                                                                    4.92%

                                    Merck & Co Inc                                                                    4.89%

                       Continental Resources Inc                                                                    4.66%

                            JPMorgan Chase & Co                                                                    4.56%

                            Bank of America Corp                                                               4.27%

                                             eBay Inc                                                        4.11%

                                                      0.00%       1.00%       2.00%       3.00%       4.00%       5.00%       6.00%      7.00%   8.00%

5    Fund holdings and sector allocations are subject to change at any time and are not recommendations to buy or sell any security.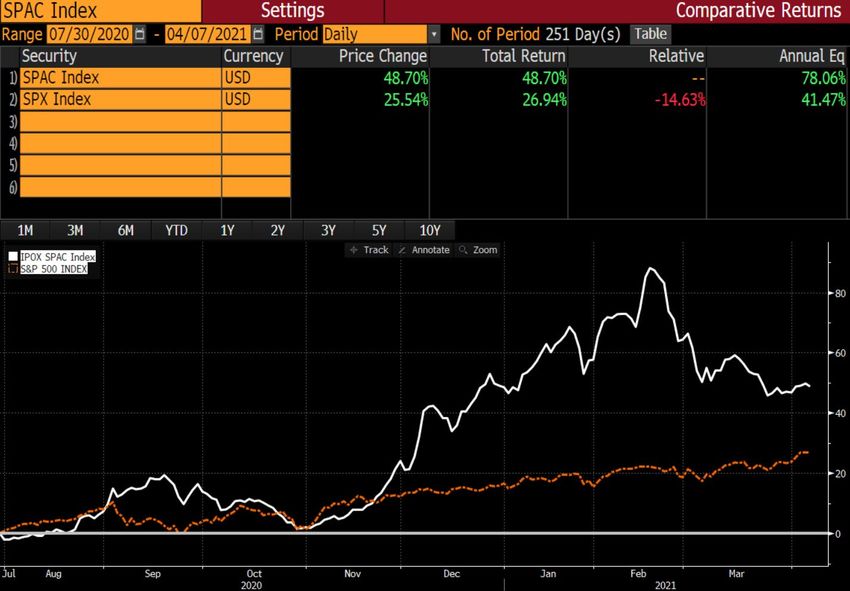
Portfolio Additions / Deletions
    First Quarter 2021

     >   New positions:                                                                   >    Trims to position weightings:
          – Discovery Inc Series C (DISCK)                                                      – Accenture (ACN)
          – Walgreens Boots Alliance Inc. (WBA)                                                 – Walt Disney Co. (DIS)

     >   Adds to position weightings:                                                           – Discovery Communications Inc. (DISCA)

          – Amgen Inc. (AMGN)                                                                   – Home Depot Inc. (HD)

          – Continental Resources Inc. (CLR)                                                    – Macerich Co. (MAC)

          – ConocoPhillips (COP)                                                                – NVR Inc. (NVR)
          – Chevron Corp. (CVX)                                                                 – Qualcomm Inc. (QCOM)
          – D. R. Horton Inc. (DHI)                                                             – Starbucks Corp. (SBUX)
          – Discovery Inc Series C (DISCK)                                                      – Target Corp. (TGT)
          – Macerich Co. (MAC)
                                                                                          >    Sells:
          – Merck & Co., Inc. (MRK)
                                                                                                – Viatris Inc. (VTRS)
          – Simon Property Group Inc. (SPG)
          – Viatris Inc. (VTRS)
          – Walgreens Boots Alliance Inc. (WBA)

6    Current and future holdings are subject to change at any time and are not recommendations to buy or sell any security.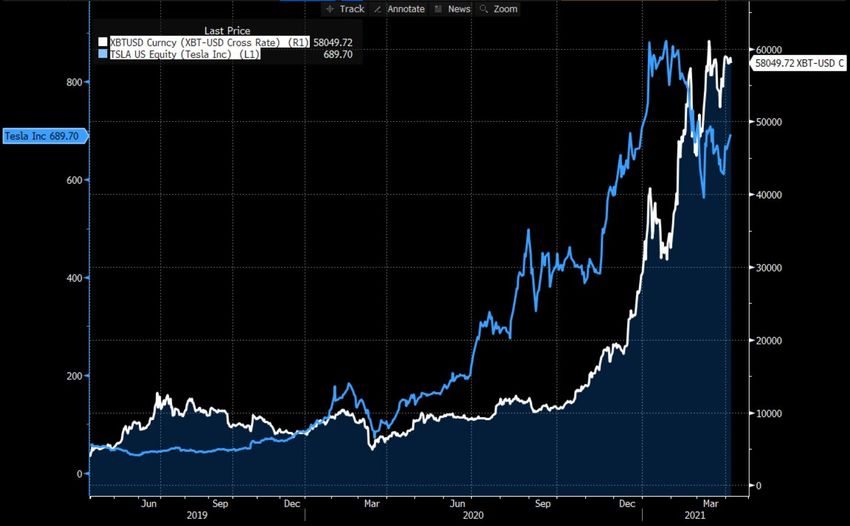
Today’s Agenda
Performance, Characteristics and Top 10 Holdings
Cole Smead, CFA, Portfolio Manager
Featured Stock: Merck & Co., Inc. (MRK)
Tony A. Scherrer, CFA, Portfolio Manager
Winning the Peace
Bill Smead, Lead Portfolio Manager
7 CFA is a registered trademark owned by the CFA Institute.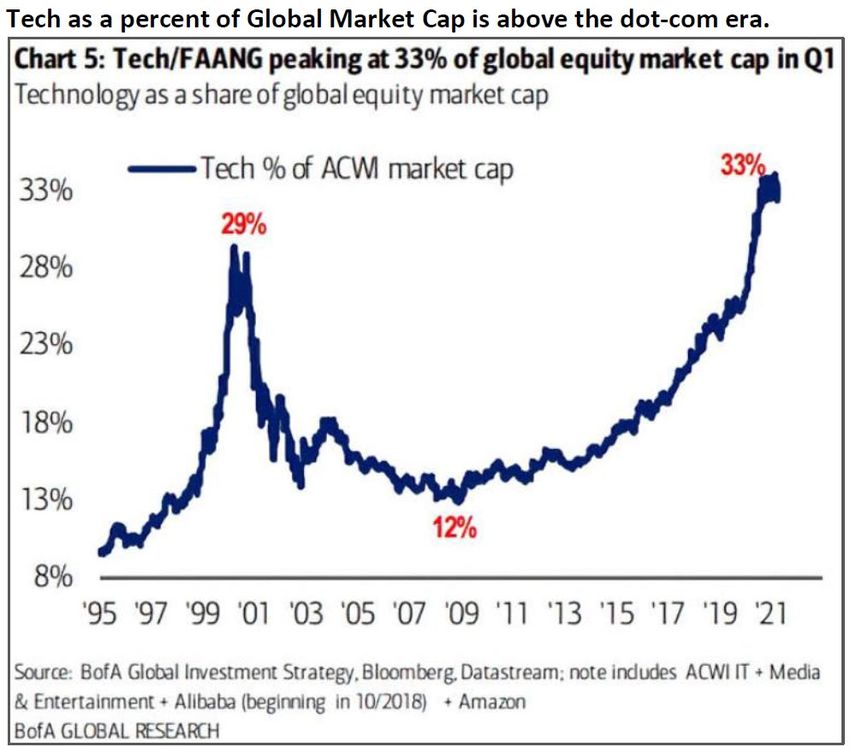
Featured Stock: Merck & Co., Inc. (MRK)

                                                     Our Eight Criteria
                                                     Required over entire holding period

                                         1.    Meets an economic need
                                         2.    Strong competitive advantage (wide moats or barriers to entry)
                                         3.    Long history of profitability and strong operating metrics
                                         4.    Generates high levels of free cash flow (FCF)
                                         5.    Available at a low price in relation to intrinsic value

                                                                Favored, but not required
    6.     Management’s history of shareholder friendliness                                     For companies that don’t meet one of these, we
                                                                                                believe our required criteria will ultimately correct or
    7.     Strong balance sheet                                                                 overwhelm.

    8.     Strong insider ownership
                                                                                                May also relate to timing/portfolio weighting
           (preferably with recent purchases)

         Past performance is no guarantee of future results. Current and future holdings are subject to change at any time and are not
8
         recommendations to buy or sell any security.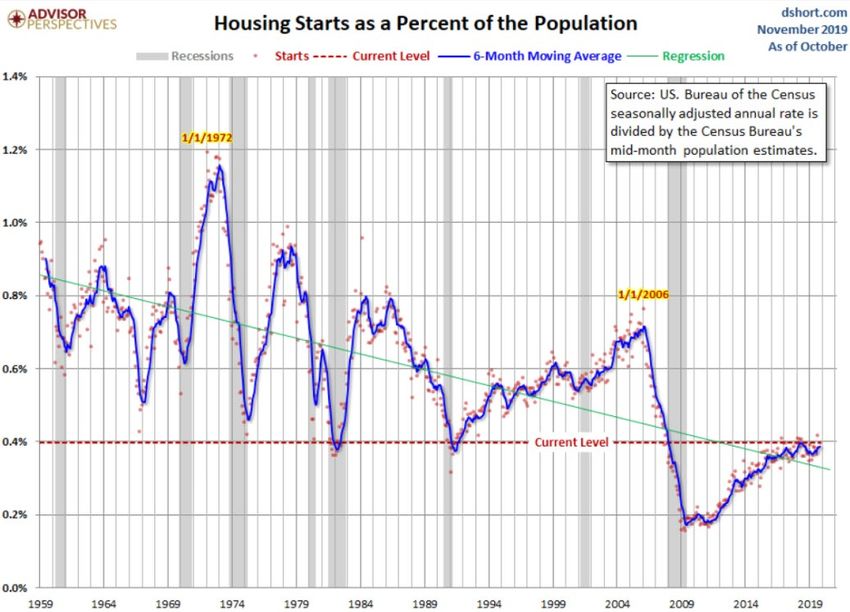
Featured Stock: Merck & Co., Inc. (MRK)
    Meets an Economic Need

9    Past performance is no guarantee of future results. Source: Company Fact Sheet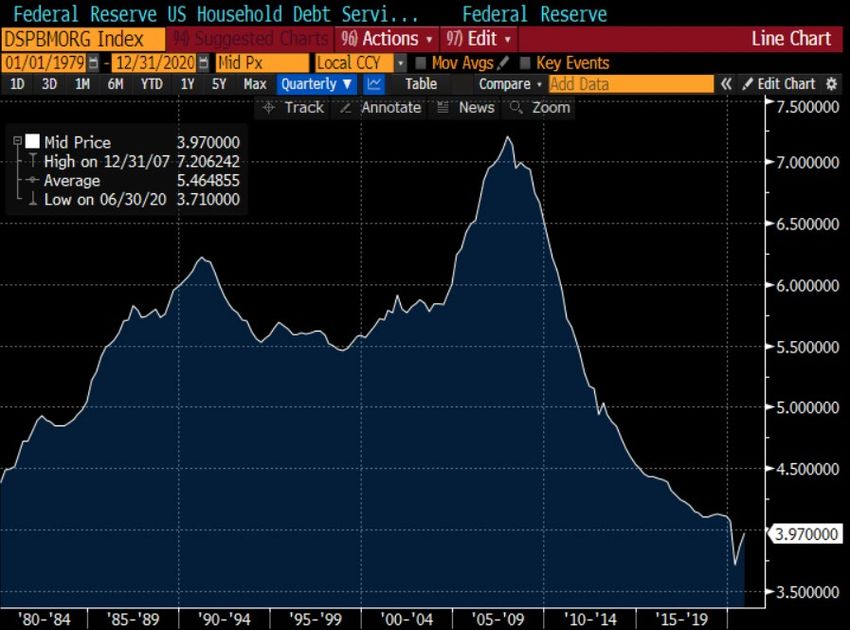
Featured Stock: Merck & Co., Inc. (MRK)
     Strong Competitive Advantage

10    Past performance is no guarantee of future results. Source: Trefis
Featured Stock: Merck & Co., Inc. (MRK)
Strong Competitive Advantage
11 Past performance is no guarantee of future results. Source: Merck Pipeline Q1 2021; RBC Initiation of Coverage reportFeatured Stock: Merck & Co., Inc. (MRK)
Long History of Profitability & Operating Metrics
12 Past performance is no guarantee of future results. Source: BloombergFeatured Stock: Merck & Co., Inc. (MRK)
High Levels of Free Cash Flow
13 Past performance is no guarantee of future results. Source: BloombergFeatured Stock: Merck & Co., Inc. (MRK)
Low Price in Relation to Intrinsic Value
14 Past performance is no guarantee of future results. Source: FactSetFeatured Stock: Merck & Co., Inc. (MRK)
History of Shareholder Friendliness
15 Past performance is no guarantee of future results. Source: BloombergFeatured Stock: Merck & Co., Inc. (MRK)
Strong Balance Sheet
16 Past performance is no guarantee of future results. Source: Merck Investor DayFeatured Stock: Merck & Co., Inc. (MRK)
Insider Ownership
17 Past performance is no guarantee of future results. Source: BloombergToday’s Agenda
Performance, Characteristics and Top 10 Holdings
Cole Smead, CFA, Portfolio Manager
Featured Stock: Merck & Co., Inc. (MRK)
Tony A. Scherrer, CFA, Portfolio Manager
Winning the Peace
Bill Smead, Lead Portfolio Manager
18Winning the Peace
Presented by:
Bill Smead
Lead Portfolio Manager
www.smeadcap.com © 2021 Smead Capital Management (SCM), All Rights Reserved.
Opinions are subject to change, are not guaranteed, and should not be considered recommendations to buy or sell any security.Agenda
Who Won the War?
Who Wins the Peace?
Where to Invest for the Peace?
20Winning the Peace
Who Won the War?
Stay At Home Stocks
21 Past performance is no guarantee of future results. Source: Yardeni; Cypress Capital March 26, 2021Winning the Peace
Who Won the War?
Work From Home Stocks
22 Past performance is no guarantee of future results. Source: BloombergWinning the Peace
Who Won the War?
The Unprofitable
23 Past performance is no guarantee of future results. Source: Cypress Capital March 26, 2021; https://www.barrons.com/articles/the-
booming-ipo-market-shows-no-signs-of-slowing-what-investors-need-to-know-51615546800Winning the Peace
Who Won the War?
The Fed / Deficit Spending
24 Past performance is no guarantee of future results. Source: Cypress Capital March 12, 2021Winning the Peace
Who Won the War?
Equity Enthusiasm
25 Past performance is no guarantee of future results. Source: JP Morgan; Cypress Capital March 26, 2021Winning the Peace
Who Won the War?
Insane Speculation-SPACTACULAR
Past performance is no guarantee of future results. Source: Bloomberg; https://www.ft.com/content/3258285a-00c2-445e-a318-
26 3e760c298698. A special purpose acquisition company (SPAC) is a company with no commercial operations that is formed strictly to raise
capital through an initial public offering (IPO) for the purpose of acquiring an existing company.Winning the Peace
Who Won the War?
Fleas and Lice / Bitcoin and Tesla
27 Past performance is no guarantee of future results. Source: BloombergAgenda
Who Won the War?
Who Wins the Peace?
Where to Invest for the Peace?
28Winning the Peace
Who Wins the Peace?
The Importance of Winning the Peace: 1918 vs. 1945
29 Past performance is no guarantee of future results. Source: The Winnipeg Evening Tribune, Nov 4, 1918Winning the Peace
Who Wins the Peace?
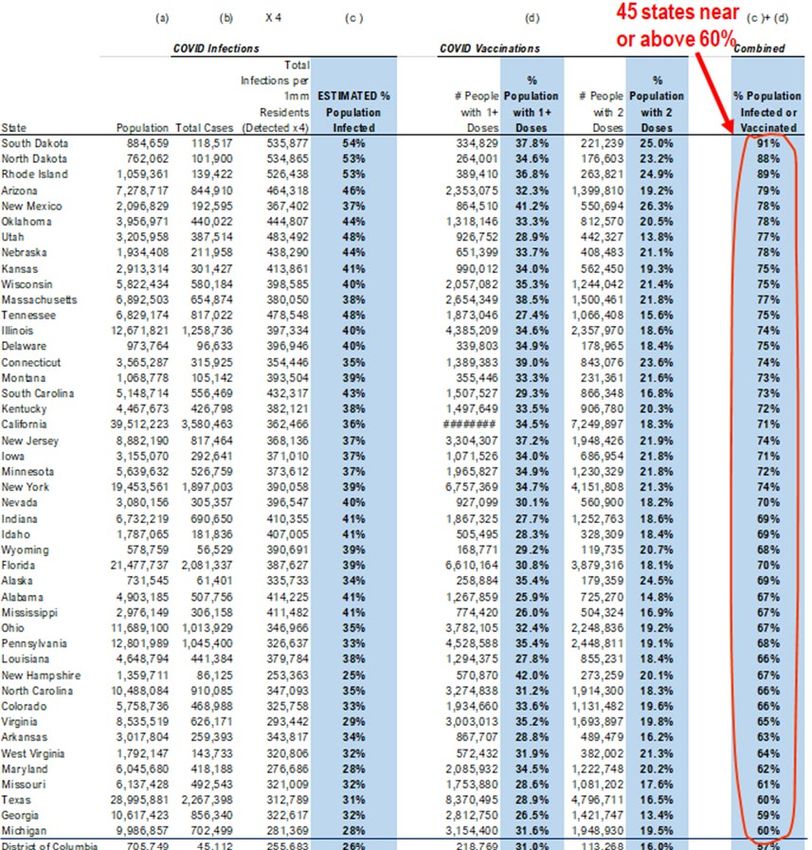
The Vaccine Army
30 Past performance is no guarantee of future results. Source: Fundstrat; JP Morgan Guide to the Markets, March 31, 2021Winning the Peace
Who Wins the Peace?
The Demographic Pig Through the Python
31 Past performance is no guarantee of future results. Source: FundstratWinning the Peace
Who Wins the Peace?
Necessary Industries
32 Past performance is no guarantee of future results. Source: FundstratWinning the Peace
Who Wins the Peace?
Unlevered Personal Balance Sheets Ready to Go
33 Past performance is no guarantee of future results. Source: BloombergWinning the Peace
Who Wins the Peace?
Main Street Economic Ability to take Risk
Mortgage Burden
34 Past performance is no guarantee of future results. Source: https://themortgagereports.com/61853/30-year-mortgage-rates-chartAgenda
Who Won the War?
Who Wins the Peace?
Where to Invest for the Peace?
35Winning the Peace
Where to Invest for the Peace?
Homebuilders
36 Past performance is no guarantee of future results. Source: Advisor Perspectives November 2019; Cypress Capital March 26, 2021Winning the Peace
Where to Invest for the Peace?
Class A Mall REITS
37 Past performance is no guarantee of future results. Source:Winning the Peace
Where to Invest for the Peace?
Banks
Past performance is no guarantee of future results. Source: Bloomberg; https://www.wsj.com/articles/the-pandemic-ignited-a-housing-
38
boombut-its-different-from-the-last-one-11615824558?mod=article_inlineWinning the Peace
Where to Invest for the Peace?
Energy
39 Past performance is no guarantee of future results. Source: JP Morgan Guide to the Markets, March 31, 2021Winning the Peace
Where to Invest for the Peace?
Drug/biotech blue chips
NYSE Arca
Pharmaceutical forward
P/E relative to the S&P
500
40 Past performance is no guarantee of future results. Source: FactsetWinning the Peace
Where to Invest for the Peace?
Dividends & Book Value
41 Past performance is no guarantee of future results. Source: Cypress, January 15, 2021 + March 12, 2021Agenda
Who Won the War?
Who Wins the Peace?
Where to Invest for the Peace?
42Today’s Agenda
Performance, Characteristics and Top 10 Holdings
Cole Smead, CFA, Portfolio Manager
Featured Stock: Merck & Co., Inc. (MRK)
Tony A. Scherrer, CFA, Portfolio Manager
Winning the Peace
Bill Smead, Lead Portfolio Manager
43Definitions Basis point: A basis point is one hundredth of one percent, used chiefly in expressing differences of interest rates. Book Value: A company's common stock equity as it appears on a balance sheet, equal to total assets minus liabilities, preferred stock, and intangible assets such as goodwill. Cash Flow: A revenue or expense stream that changes a cash account over a given period. Debt/Equity: A measure of a company's financial leverage calculated by dividing its total liabilities by stockholders' equity. Debt/Total Capital: A company's debt-to-capital ratio or D/C ratio is the ratio of its total debt to its total capital, its debt and equity combined. Dividend yield is represented as a percentage and can be calculated by dividing the dollar value of dividends paid in a given year per share of stock held by the dollar value of one share of stock. DSPBMORG Index is the Federal Reserve U.S. household debt service ratio mortgage obligations. It represents household debt service payments and financial obligations as a percentage of disposable personal income; seasonally adjusted. Earnings before interest, tax, depreciation and amortization (EBITDA) is a measure of a company's operating performance. Earnings per share (EPS) is the portion of a company's profit allocated to each outstanding share of common stock. Free Cash flow: measures the cash generating capability of a company by adding non-cash charges (e.g. depreciation) and interest expense to pretax income. Free cash flow per share is a measure of a company's financial flexibility that is determined by dividing free cash flow by the total number of shares outstanding. Free cash flow to sales (FCF Sales) is a valuation ratio that measures a company's surplus cash flow against sales revenues. Free cash flow yield is an overall return evaluation ratio of a stock, which standardizes the free cash flow per share a company is expected to earn against its market price per share. Gross margin: A company's total sales revenue minus its cost of goods sold (COGS), divided by total sales revenue. Leverage: The relationship of debt to equity. Mutual Fund Portfolio Turnover: A measure of the trading activity in the fund's portfolio of investments. In other words, how often securities are bought and sold. Net profit margin is the ratio of net profits to revenues for a company or business segment. 44
Definitions
NASDAQ-100 is a stock market index made up of 104 equity securities issued by 100 of the largest non-financial companies listed on the NASDAQ. It is a modified
capitalization-weighted index.
Nasdaq Composite Index is the market capitalization-weighted index of approximately 3,000 common equities listed on the Nasdaq stock exchange.
Nifty Fifty refers to the 50 popular large-cap stocks on the New York Stock Exchange in the 1960s and 1970s that were widely regarded as solid buy and hold
growth stocks, or "Blue-chip" stocks.
Operating Cash Flow (OCF): refers to the amount of cash a company generates from the revenues it brings in, excluding costs associated with long-term
investment on capital items or investment in securities
Operating margin: a margin ratio used to measure a company's pricing strategy and operating efficiency.
The price-to-cash-flow ratio is the ratio of a stock's price to its cash flow per share.
The price-to-book ratio (P/B Ratio) is a ratio used to compare a stock's market value to its book value.
Price/Earnings (P/E): the ratio of a firm’s closing stock price & its trailing 12 months’ earnings/share.
Price to tangible book value (PTBV) is a valuation ratio expressing the price of a security compared to its hard, or tangible, book value as reported in the
company's balance sheet.
Return on assets (ROA) is an indicator of how profitable a company is relative to its total assets.
Return on equity (ROE) is the amount of net income returned as a percentage of shareholders equity.
Return on total capital is a profitability ratio that measures profit earned by a company using both its debt and equity capital
Return on invested capital (ROIC) is a profitability ratio. It measures the return that an investment generates for those who have provided capital, i.e. bondholders
and stockholders.
Russell 1000 Index is an index that represents the highest-ranking 1,000 stocks in the Russell 3000 Index, which represents about 90% of the total market
capitalization of that index.
Russell 1000 Growth Index refers to a composite that includes large and mid-cap companies located in the United States that also exhibit a growth probability.
Russell 1000 Value Index refers to a composite of large and mid-cap companies located in the United States that also exhibit a value probability.
S&P 500 Index: A market-value weighted index consisting of 500 stocks chosen for market size, liquidity, and industry group representation.
Standard deviation is a measure of the dispersion of a set of data from its mean.
The US 10 Year Treasury note is a debt obligation issued by the United States government with a maturity of 10 years upon initial issuance. A 10-year Treasury note
pays interest at a fixed rate once every six months, and pays the face value to the holder at maturity.

45
Disclosures

 Past performance is no guarantee of future results.

 Consider the investment objectives, risks, charges and expenses of the Fund carefully before investing. The
 statutory and summary prospectuses contain this and other information about the Fund and is available at
 www.smeadcap.com or by calling 877-807-4122. Read carefully before investing.

 Mutual fund investing involves risk. The Fund is non-diversified, meaning it may concentrate its assets in fewer individual
 holdings than a diversified fund. Therefore, the fund is more exposed to individual stock volatility than a diversified fund.

 Information provided does not constitute investment advice and no investment decisions should be made based on any
 information provided. Information reflects the views of Smead Capital Management as of a particular time. Such views are
 subject to change without notice. Information regarding holdings, allocations and other allocations are for illustrative purposes
 only and may not be representative of current or future investments or allocations. This information is not a recommendation to
 purchase or sell a security or follow any strategy or allocation. Any forward-looking statements or forecasts are based on
 assumptions and actual results may vary from any statements or forecasts. While Smead Capital Management has used
 reasonable efforts to obtain information from reliable sources, no representations or warranties are made as to the accuracy,
 reliability or completeness of Fourth-party information presented in this material. This material is not to be duplicated or
 recreated without prior written consent of Smead Capital Management.

 Frank Russell Company is the Source: and owner of the trademarks, service marks and copyrights related to the Russell
 Indexes. Russell® is a trademark of Russell Investment Group.

 The Smead Value Fund is distributed by UMB Distribution Services, LLC. UMB Distribution Services and Smead Capital
 Management are not affiliated.

46
| Questions & Answers
 Email info@smeadcap.com or call 877.701.2883

                                  | SMEAD CAPITAL MANAGEMENT
                                   2777 East Camelback Road, Suite 375
                                   Phoenix, AZ 85016
You can also read