Performance Analysis Tools 1. Profiler Generalities - RRZE ...
←
→
Page content transcription
If your browser does not render page correctly, please read the page content below
Performance Analysis Tools
            1. Profiler Generalities
                                   part of the material presented is courtesy of Fabio Baruffa, Intel
                                                                           and Luigi Iapichino, LRZ

Performance Tools | 2020-03-13                                                                    1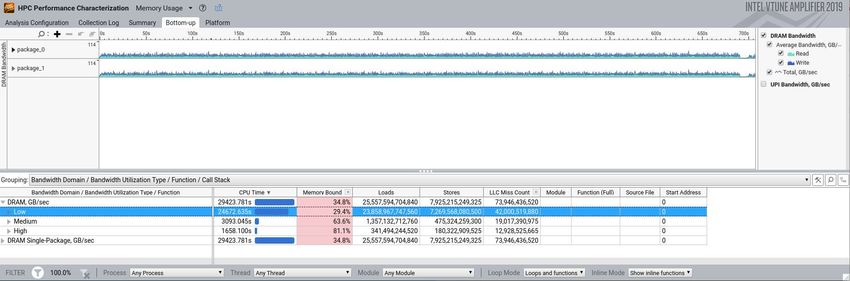
Moore‘s law is dead! Long live Moore‘s law!
“There ain't no such thing as a free lunch“
• # of components
still grows
• Single-tread
performance and
frequency
settle
• Machines are
more difficult
to use
• Pressure for
https://www.quora.com/Will-Moores-law-halt-in-computer-processing
code optimization
Performance Tools | 2020-03-13 2
Optimization flowchart & Intel® Profiling Tools

                                                  Since 2020:
                                                           Profiler
                                                  VTune™ Amplifier

                                                    This morning:

                                                   This afternoon:
                                                     (Anupam)
                                                   APS       ITAC

   Image courtesy of Intel®

Performance Tools | 2020-03-13                                        3
A very broad overview
How profilers operate
Statistical sampling Event-based / Instrumenting / Tracing
Interrupt the execution of the program to take snapshots of Modify the executable, typically at compilation time, to call
What they do the process status: functions, call tree, memory, … performance counters at any occurrence of specified event.
May run the application several times under the hood.
Typically no need to recompile ✘ Need to compile a dedicated version
Pros and cons Typically negligible overhead ✘ Large overhead (e.g. small functions called many times)
Runtime meaningful ✘ Runtime (and partials) not indicative of true performance
✘ Statistical nature of sampling: measure uncertainties, Complete performance characterization
may need to tune sampling interval
• First overview / blind profiling • Development, debugging
When • Profiling of production runs • When time granularity < few ms
preferred • All the other cases • Isolated kernels in controlled tests
Examples APS, VTune, ITAC, Advisor, perf (linux). Scalasca, Score-P, …
Two options on Intel; also how VTune actually works
Software Collector Hardware Collector (aka event-based sampling, watch out!) Mixed strategies also possible
Uses OS interrupts Uses the on chip Performance Monitoring Unit (PMU)
(e.g. VTune some time ago)
Collects from a single process tree Collect system wide or from a single process tree.
~10ms default resolution ~1ms default resolution (finer granularity - finds small functions)
Either an Intel® or a compatible
Requires a genuine Intel® processor for collection https://software.intel.com/en-us/vtune-help-sep-driver
processor
LRZ: - sep available on Linux Cluster
Call stacks show calling sequence Optionally collect call stacks - perf available on SuperMUC-NG
Works in a VM only when supported by the VM (e.g., vSphere*, /proc/sys/kernel/perf_event_paranoid
Works in virtual environments
KVM) is set to 0 on compute nodes (uncore events)
Performance Tools | 2020-03-13 4
No driver required Uses Intel driver or perf if driver not installed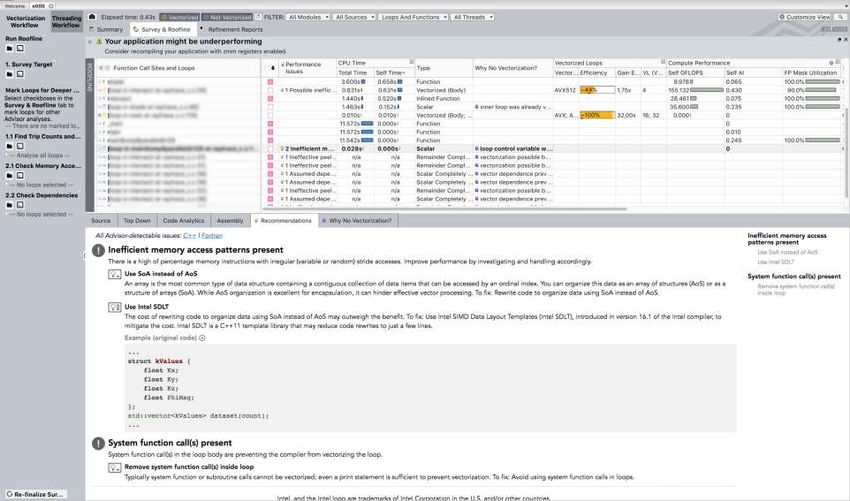
Performance Analysis Tools
          2. Intel® VTune™ Profiler
                                  part of the material presented is courtesy of Fabio Baruffa, Intel
                                                                          and Luigi Iapichino, LRZ

Performance Tools | 2020-03-13                                                                   5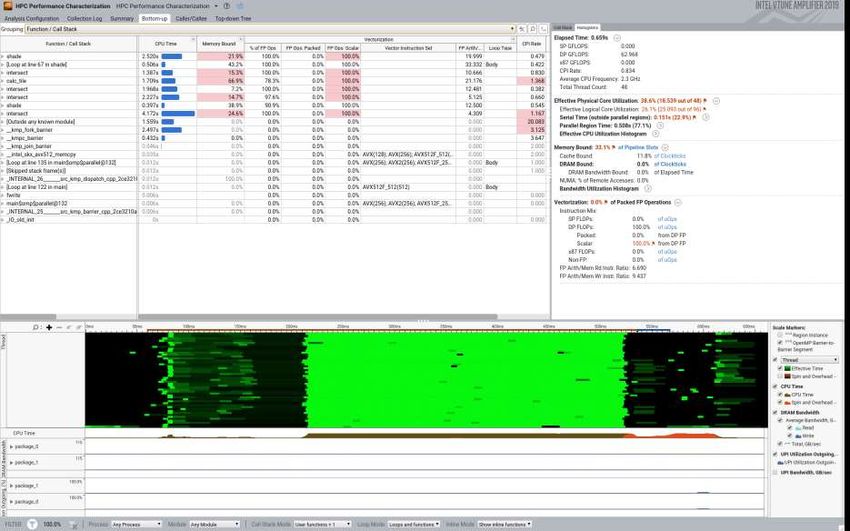
What VTune can do for you
• Analyze all aspect of node-level performance
        threading          communication               SIMD            memory access
• Identify bottlenecks, hints how to address them, predicts speedup
• List hotspots by execution time or resources consumed

• Optimize use of hardware resources (SIMD, hyperthreading, additional memories, …)

• Allow low-level hardware inspection (microarchitecture, frontend, backend)

•    Group and display collected data by:
          Process           Thread          Function          Source code line    …

• Point to target location in source code and shows assembly instructions

• Support multiple programming languages
  (C/C++/C#, Fortran, Java, Assembly, Python, Google Go)

• Support latest and fortcoming Intel® processors

• Provide a flexible workflow integrating GUI and command line
Performance Tools | 2020-03-13                                                         6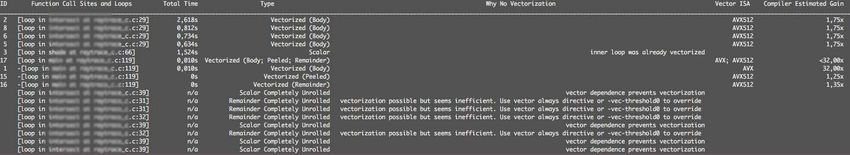
What you can do for VTune
1. Get it!
    o Your own: standalone or in Intel Parallel Studio or Intel oneAPI   https://software.intel.com/en-us/advisor
    o LRZ     :     module load amplifier_xe [/2020]
                    amplxe-gui / amplxe-cl
2. Install drivers for hardware collection (optional, need admin rights!)
    o Sampling drivers : https://software.intel.com/en-us/vtune-help-sep-driver
    o OR Perf : https://software.intel.com/en-us/vtune-cookbook-profiling-hardware-without-sampling-drivers

3. Compile and run your code with profiler-friendly features
    o Compile with –g –O2 (or -O3) options, plus SIMD, e.g. –xHost (see lecture on Advisor)
    o Hyperthreading and Turbo Boost technology are discouraged
    o Keep it simple! Ideally a short, representative run on a single node.

4. Get familiar with the workflow
   and include it in your own

                                                                                                          Optimize!
Performance Tools | 2020-03-13                                                                                        7
VTune workflow 1/2
   VTune Collecting samples
      module load amplifier_xe

GUI amplxe_gui                      then fill the boxes. Also via SSH! CLI best on batch servers, multi-node.

CLI amplxe_cl –help collect [analysis]

      [mpirun –n  / srun] amplxe_cl \
             –collect  -knob = -knob = … \
             –collect  -knob = -knob = … \
             -collect … -r  --

             Common analyses                                                 Most useful corresponding knobs

                                          ** sampling_interval=  [def: 5]
           hpc-performance                 * sampling-mode=hw [def: sw], analyze-openmp=true [def:false],
                                             enable-stack-collection=true, collect-memory-bandwidth=true
           hotspots                          enable-stack-collection=true
           threading                       * sampling-and-waits=hw [def: sw]
       * uarch-exploration                   enable-stack-collection=true, collect-memory-bandwidth=true
       * advanced-hotspots                   analyze-openmp=true, enable-characterization-insights=true

                                             * Drivers required. Intel Sampling Driver (sep, check with sep -version) or, if not available, perf counters.
                                             ** Depending on finalization mode, data in excess of 500 MB may be skipped. A coarser time sampling is advised in case.
                                                One can always tweak -finalization-mode=full | fast | deferred | none. Check with amplxe_cl –help collect
   Performance Tools | 2020-03-13                                                                                                                                      8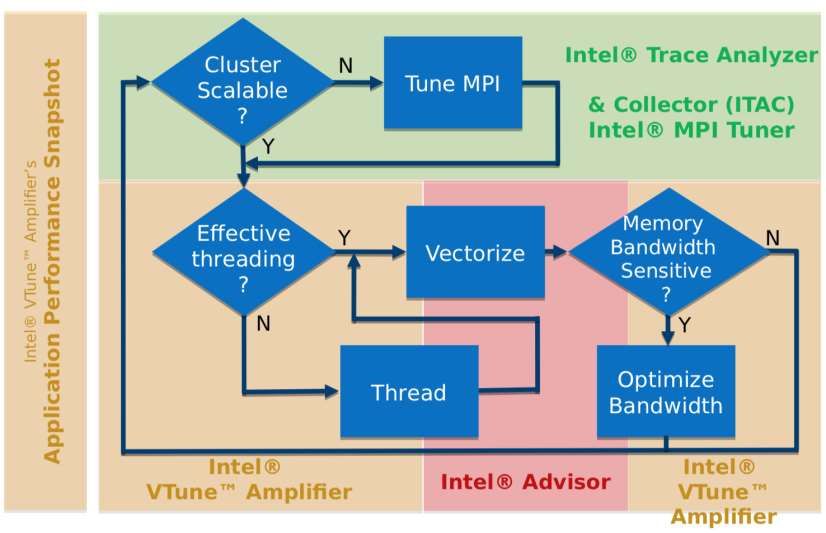
VTune workflow 2/2
   Generating reports
      module load amplifier_xe

GUI amplxe-gui
                                    Alternatively,
                                    to compare two
      good idea
      whenever
      a graphic
      environment
      is available

CLI amplxe-cl –help report [report_name]
      amplxe-cl -report  -r
          summary
          hotspots
          hw-events
          callstacks
          top-down
          …                                            …
   Performance Tools | 2020-03-13                      9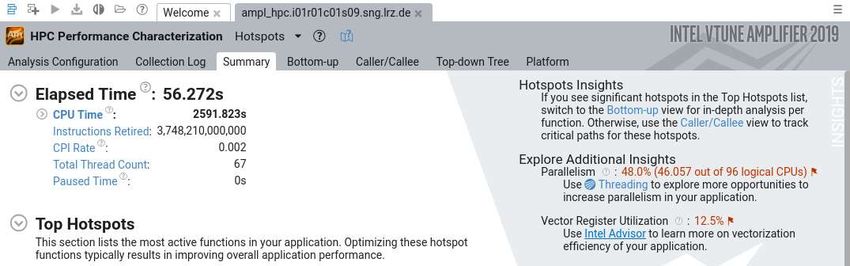
Navigating VTune: Reports and Views
                                      Reports
                                      • Somewhat dependent by collection

                                      Views
                                      • Available view depends on above
                                      • but very similar across them
                                      • Interface full of help / hints

Performance Tools | 2020-03-13                                             10
VTune Views
Summary Bottom-up Calls
Source/Assembly
Performance Tools | 2020-03-13 11VTune Reports
HPC Performance Characterization
Summary-like
report, or Call Stack
How to
red flags
browse =
bottlenecks
click and drag
How to
on a region read
to zoom
Performance Tools | 2020-03-13 12VTune Reports Hotspots / Threading efficiency Same information, but you can focus on single threads Performance Tools | 2020-03-13 13
VTune Reports
Microarchitecture Exploration
Image from VTune™ user guide
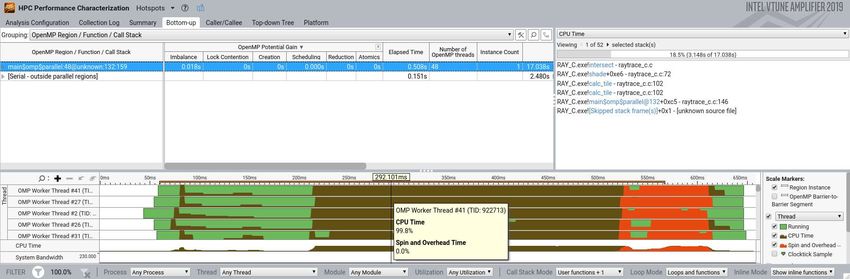
Performance Tools | 2020-03-13 14VTune Example #1 Examining Threading efficiency • Useful for OpenMP applications. • What‘s my potential gain? • Where are my threading inefficiencies? Performance Tools | 2020-03-13 15
VTune Example #2
Examining Memory Usage

•      On which memory are my data?   •   What‘s the available bandwidht?
•      How are they moved around?     •   Cache usage: how many misses?

Performance Tools | 2020-03-13                                              16
Performance Analysis Tools
              3. Vectorization recap
                                 part of the material presented is courtesy of Fabio Baruffa, Intel
                                                                         and Luigi Iapichino, LRZ

Performance Tools | 2020-03-13                                                                 17
Intel Advanced Vector instruction sets, AVX
Recap on SIMD (Single Instruction, Multiple Data)
An additional level of loop parallelism Intel®Advanced Vector Extensions (Intel®AVX)
8x floats xmm
Intel ®
AVX 4x doubles
32x bytes V
t
16x 16-bit shorts
Intel ®
ymm c
8x 32-bit integers
https://software.intel.com/en-us/blogs/2012/01/31/vectorization-find-out-what-it-is-find-out-more AVX2
4x 64-bit integers
• Also AVX512 on 512-bits zmm registers
2x 128-bit(!) integer
(KNL™, Xeon™ Scalable)
• Naive vectorization of loops/kernels enabled at compile time with the following flags: Optimization Notice
Copyright © 2019, Intel Corporation. All rights reserved.
*Other names and brands may be claimed as the property of others.
o -xHost Most advanced set on compiling machine
o -xMIC-AVX512 Forces AVX512 on KNL
o -xCORE-AVX512 [–qopt-zmm-usage=high] Intel Xeon version (SKX, CKX) [default: no zmm]
o -no-vec –no-simd Forces scalar code (e.g. for performance evaluation)
Performance Tools | 2020-03-13 18Node-level performance optimization
The possibilities of vector code
Threading and
vector synergise
Much faster than
separately
The difference
grows with every
new hardware
generation!
Compiler flags Pragma directives Intrinsic functions Assembly
Different levels
• Automatic, in seconds • “No” code change • Scalar won't compile • Good for inspection
of optimization:
More human-friendly More efficient
Performance Tools | 2020-03-13 19SIMD Facts 1/2
Just another degree of parallelism
• It is limited by own Amdahl‘s law: • OpenMP has got you covered!
• May be prevented by own „race conditions“:
Loop-carried dependencies
Dependency Description Example
RAW Read after write A[i] = A[i-1] + C[i]
(flow / true dependency)
WAR Write after read A[i] = A[i+1] + C[i]
(anti dependency)
WAW Write after write A[i%2] = B[i] + C[i]
(output dependency)
From OpenMP 5.0 ref guide:
https://www.openmp.org/wp-content/uploads/OpenMPRef-5.0-111802-web.pdf
Performance Tools | 2020-03-13 20SIMD Facts 2/2
Must optimize memory resources!
AVX512 • Need to work on many data at the same time
to reach performance peak!
FMA • Also must bring data to processor as fast as
AVX possible optimize cache use!
SSE2
Best use of memory for vector loops?
• Alignment: compilers generate scalar
• Jumps with new SIMD instruction sets peel and remainder loop.
• Often main parallel bottleneck • Data layout: stride of memory access
• Even less chances for free lunches! unit > constant > irregular
Performance Tools | 2020-03-13 21Optimising Vectorization Performance with Intel® Advisor™
The Roofline model (in one slide)
Answers the question: up to which point can I optimize? Theoretical limits?
• Advisor generates
them automatically
GFLOPS
Log y scale Same slope
• Publication quality,
tweaking required
Color-coding
• Time
• Vectorization • Cache-aware, and
• …
ungroup callstacks
Three different regions
• Nearest roofs point
to most relevant
Arithmetic Intensity bottlenecks
GFLOPS VS Arithmetic Intensity
Total number of operations FLOPs per accessed Byte
Performance Tools | 2020-03-13 22Performance Analysis Tools
4. Intel® Advisor™
part of the material presented is courtesy of Fabio Baruffa, Intel
and Luigi Iapichino, LRZ
Performance Tools | 2020-03-13 23Optimising Vectorization Performance with Intel® Advisor™
What Advisor does, and how to get started
• A software tool for vectorization optimization and thread prototyping
• Focus on node-level code modernization
• Makes the most of Intel Processors
(Threading workflow &) Vectorization workflow
Get Advisor
https://software.intel.com/en-us/advisor
On LRZ machines
module load advisor_xe[/2020]
Get started
https://software.intel.com/en-
us/advisor/documentation/get-started
Performance Tools | 2020-03-13 24Advisor Vectorization Workflow 1/2
Collection
0. [module load advisor_xe] advixe-cl / advixe-gui advixe-cl –help [action]
1. [mpirun -n ] advixe-cl –collect [--opt1 --opt2 …] \ CLI
--project-dir= --
Analyses
survey Discover where efficient vectorization and/or threading pays off the most.
GUI tripcounts Identify the number of loop iterations, collects FLOPs
roofline Shortcut for Survey + Trip Counts & FLOP, produces roofline plot
Useful options you may want (check help)
--trace-mpi --enable-cache-simulation --stacks
2.0 [mpirun -n ] advixe-cl --mark-up-loops --project-dir=
--loops="scalar,has-source,has-issues,…" --
2.1 [mpirun -n ] advixe-cl –collect dependencies [--opt1 --opt2 …] \
--project-dir= --
Identify and explore loop-carried dependencies preventing vectorization for marked loops.
2.2 [mpirun -n ] advixe-cl –collect map [--opt1 --opt2 …] \
--project-dir= --
Identify and explore complex memory accesses reducing vector efficiency for marked loops.
Performance Tools | 2020-03-13 25Advisor Vectorization Workflow 2/2
Generating reports
module load advisor_xe
GUI advixe-gui
good idea
whenever
a graphic 2
environment
is available
1
CLI advixe-cl –help report [report_name]
advixe-cl -report --proj-dir=
summary
hotspots
survey
dependencies
roofline
map
to .html
… …
Performance Tools | 2020-03-13 26Navigating Advisor reports 1/4
Summary view
Toggle either on/off
Warning: Timers are actual data,
efficiencies are model results!
Look at:
• red flags
• recommendations
Performance Tools | 2020-03-13 27Navigating Advisor reports 2/4
Survey view: Code Analytics Tab
Bottom view:
details on what you select
Performance Tools | 2020-03-13 28Navigating Advisor reports 3/4
Survey view: Recommendation Tab
Bottom view:
details on what you select
Performance Tools | 2020-03-13 29Navigating Advisor reports 4/4
Roofline view
Export to html
Larger, more time-consuming kernels
make better optimization candidates
Bottom view:
details on what you select
Performance Tools | 2020-03-13 30Optimising Vectorization Performance with Intel® Advisor™
Some common problems and how to (attempt to) solve them*
Problems preventing vectorization Problems limiting vector efficiency
Loop calls non-SIMD or non-inline functions Hardware under-utilization
• Function vectorizable? Declare as SIMD • low usage of zmm registers in AVX512 (Xeon Scalable):
OpenMP**: #pragma omp declare simd recompile with –qopt-zmm-usage=high
• Only some loops vectorizable?
May force vectorization on those: #pragma omp simd Peel loops significant (i.e. short loops)
Align your data to memory! Choose from (e.g. 32 byte, ymm 256 bit):
Loop-carried dependencies suspected* • Compile with -falign-loops[=32]
1. Run dependencies analysis • Declare arrays as aligned objects (e.g. static allocations):
2. Clear? Force vectorization! No? Rewrite your code, C/C++: __declspec((align(32)) ;
e.g. changing loop schedule or data layout. Fortran: cDEC$ ATTRIBUTES ALIGN: 32::
Then ALWAYS tell : #pragma omp simd aligned(v:32)
Inner loop already vectorized
• Enough iteration in inner loop? Never mind! Inefficient memory access (strided or irregular)
• Not enough? Collapse nested loops: Run memory access pattern analysis
#pragma omp simd collapse(n) Change data layout! 1-D arrays, layout change:
• Array of Structure Structure of arrays (AoSSoA)
Reduction clause needed (+ , *, max, …) • Use libraries or structures! E.g. Intel® SDLT, or DPC++
• #pragma omp simd reduction(op: var1,…)
* Just use the tool! Why no vectorization? and Recommendations tab
Performance Tools | 2020-03-13 ** C/C++: #pragma omp simd Fortran: !$omp simd 31Exercise
Optimization of raytrace code
1. Access server, get code, compile it. What does it do? 8. Generate a roofline plot, and analyze it.
Repeat analysis after each code change.
2. Start with either base or OpenMP version (no MPI).
9. What happens if you play with tile size?
What changes for the threSpeculate and try it out!
3. Run one serial/threaded scalar run.
TIP #1: You may have to use the CLI version of the tools for
4. Use VTune to thread code, characterize performance,
the collections (run on compute nodes) and reports
identify main hotspots. Something you can address
(bandwidth limitations).
already? Repeat analysis after each change.
TIP #2: Raytrace produces a 36 MB image output, slow to
5. Vectorization: use SIMD compilation options.
interact with from remote. View it by: display image.pnm
What happens to performance?
• Always check that your modified code gives the right
answer (very instructive)!
6. Use Advisor to identify vectorization issues.
• Reduce image size when debugging
What wasn‘t vectorized? Why not? Recommendations?
(not recommended for the tool runs)
What are the main hotspots?
• or check with: diff old_image.pnm new_image.pnm
7. How many can you vectorize? Performance?
Performance Tools | 2020-03-13 32You can also read