QUALITATIVE COMPARATIVE ANALYSIS GROWS UP: SURPRISING APPLICATIONS OF FUZZY SETS - By Wendy Olsen University of Manchester, Discipline of Social ...
←
→
Page content transcription
If your browser does not render page correctly, please read the page content below

1

QUALITATIVE COMPARATIVE ANALYSIS GROWS UP:
SURPRISING APPLICATIONS OF FUZZY SETS

                 By Wendy Olsen
                 University of Manchester, Discipline of Social Statistics
                 and Cathie Marsh Centre for Census & Survey Research

                 Workshop on Impact Assessment Methods
2

                                AIMS
• 1. Help you to interrogate data whether random or non-random samples,
  using mixed methods. I summarise methods of applying fuzzy set methods
  to the analysis of large scale and randomly sampled data, including data
  with control samples or treatment groups.

• 2. Show how epidemiologists are beginning to use QCA and fuzzy set
  consistency

• 3. Illustrate multiple pathways of cause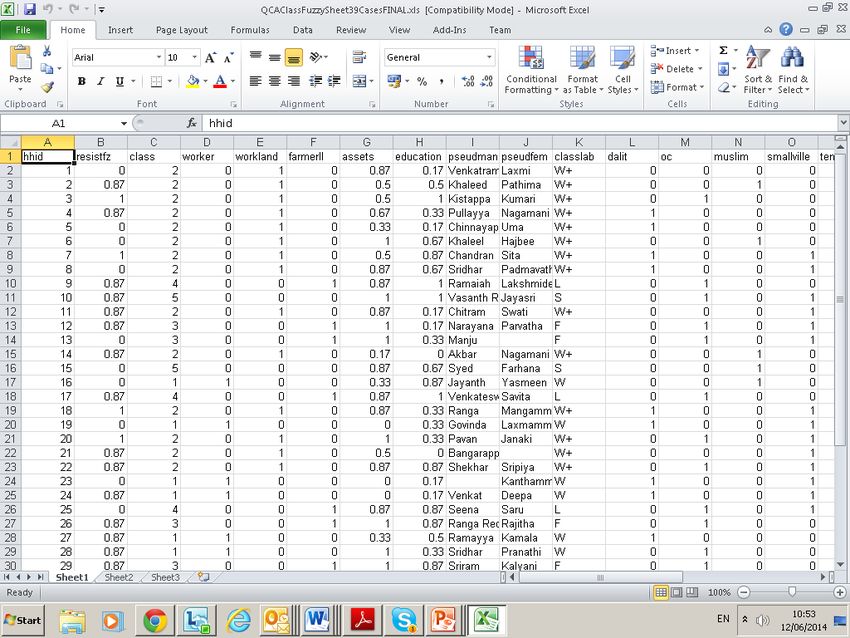
3

 1. THE FUZZY SET MEASUREMENT
                     METHODS
Crisp sets are so simple they are quite useful
0=no, 1=yes

Fuzzy sets are so complex they are controversial

Range: 0 to 1.
Scaling: Degree of membership in the qualitative set defined by 0.
(or by 1, conversely).
4
FUZZY SET MEASUREMENT –
SUBJECTIVE WELLBEING EXAMPLE
Households’ and Individuals’ Economic Circumstances Went Down (Low Fuzzy Score)5
FUZZY SETS - – OBJECTIVE EXAMPLE 1
From Interviews, we
calculate how many
instances of Exits,
Resistance,
Innovation, and
Conformity were
mentioned in semi-
structured interviews
around the landlord-
tenant relationship:
Count leads to a Fuzzy
Score6
FUZZY SETS - – OBJECTIVE EXAMPLE 2
From background
survey of a random
sample, N= 187
Education is a fuzzy
set (years, rescaled to
the 0-1 range).
We examine class
with a strong
theoretical
background.
Assets, labour relations
lead to class structure
as Categorical.7
POTENTIAL MICRO INDEPENDENT
VARIABLES
• First group are brought in from theories
• Gender
• Treatment Group
• You can use survey weights, design weights, grossing weights
• Demographic variables
• Age; mean/median age of the household;
• Hhold size
• Crisp set social class: industrial sectors and work status groups, or asset fuzzy
• Wealth (one can use the Wealth Index. Factor analysis + FUZZY fine)
• Multiple livelihoods (difficult to measure; most had 2 but few had 3 different
livelihood strands in monetised sectors)8
IND. VARS. CONTINUED
• Treatment Group
• Example of Self-Help Group Membership: Non-random joining date, early joiners are
likely to be special people who are well networked, vocal, leaders or Hhold-credit-
constrained
• NOTICE especially that the wealth are not credit-constrained so DON’T JOIN
• Amount of the treatment
• Be sure to notice that the mechanisms of cause need to be parsed out
• Qualitative research and mixed methods helps in process tracing
• Example: Membership SHG + Savings + Debt(s) + Invest? + Leadership/voice
• And amount of debt, amount of repayment, whether default,
• Finally whether husband has utilised the loan for an existing profitable activity
• Sequence analysis is also useful but needs a lot of data.9
2. EXAMPLES FROM
EPIDEMIOLOGY
Longest, K.C., and P. Voyts (2012) Gender, the Stress Process, and Health: A
Configurational Approach. Society and Mental Health, Nov. 2012. 2: 187-206.10
11

                       SOME QCA CONCEPTS IN THIS
                                     SCENARIO
• necessary cause;

• sufficient causal mechanism
12
PROTOCOL
• For testing for necessity of a cause X in relation to outcome W, you only need
to test individual X variates. It is not important to test complex configurations
at this stage.
• Also test for the necessity of X for NOT-W.
• Advice of Rihoux and Ragin, 2008.13
NEXT TEST FOR SUFFICIENCY OF CAUSE
• The vectors differ in complexity.
• As a result there are many, many permutations. Software helps ease the
decision problem.14
CONSISTENCY FOR SUFFICIENCY
• Consistency is a measure of the extent to which
membership strength in the causal
configuration is consistently equal to or less
than membership in the outcome (Epstein et. al,
2007: 10).
• = the inclusion ratio, Smithson & Verkuilen (Fuzzy Set Measurement, London:
Sage, 2006). They do not claim that an inclusion ratio implies causality.
• For each configuration, the joint membership scores (X1 X2 Y) are added
for all cases. This number is divided by the sum of all minimum membership
scores in the causal combination X1 X2. The general formula for consistency
is:
• Consistency (Xi ≤Yi) = Σ(min(Xi,Yi)) / Σ(Yi).IMPORTANT POINT ON METHOD 15
• Our method acknowledges points made by post-structuralists
• We can do discourse analysis as well as hypothesis testing.
• Knowledge is always fallible. We achieve a warranted argument strongly underpinned by
the mixed methods data.
• Triangulation is also helpful.
• But QCA focuses most strongly on the structural factors which are causal mechanisms.
• Structural background factors can enhance, or limit, the success of an intervention.
• See Byrne and Ragin, eds., Handbook of Case-Based Research, London: Sage.
•CONFIGURATIONAL LOGIC OF QCA
• Byrne (e.g. in 2002 Interpreting Quantitative Data) argues that configurations are really
different from each other. Context really matters.
• It is an empirical question to what EXTENT and HOW they differ.
• As a realist we see configurations as having causal powers and liabilities. A case has its own
tendencies by virtue of what configuration it lies within.
• Realists are not post-structuralist in deep methodological terms: structuralist instead.16
BOOLEAN INTERSECTION
• AND means the intersection of two sets.
• We interpret AND to mean ‘does the configuration of X and Y involve
membership in both X and Y? To what extent?’
• X and Y implies taking the minimum of X, Y17
BOOLEAN NOTATION
• OR is often presented as
• OR is also presented by +
• AND is presented as
• AND is also presented by *
• NOT is presented by ~
• NOT is also shown by small letters.18
3. ILLUSTRATE MULTIPLE PATHWAYS
OF CAUSE
• This is not merely a deductive exercise.
• Developing the argument does not reside merely in the domain of social
statistics.
• One applies disciplinary expertise and one uses existing theory.19
RESEARCH METHODOLOGY
• Mixed Methods Data Collection
• Varibles from the survey method + Interview texts in NVIVO, or Focus Gruops, to provide in-
depth insight and case-studies)
• Mixed Methods Triangulation at the Analysis Stage is Recommended
Data is a kind of evidence
Use other evidence about correlation of the treatment with income, etc.
What reasoning links the treatment with the outcome? Depends on the actual, varied
mechanisms. QCA finds the various PATHWAYS OF CHANGE.20
DATA
• Lam and Ostrom analysed watersheds in Nepal.
• They analysed them historically so time is embedded in the variables, not in
panel.
• The data was adapted qualitatively so LONGTERM GOOD WATER SUPPLY
was the final outcome, carefully defined.
• 0=Not good water supply. 1 = Good longterm W.
• Also designated W and ~W or W and w.
• SHORTTERM GAINS were shown to vary from the longterm gains.21 THREE TYPES OF HYPOTHESIS • 1. E is necessary for the outcome to be enhanced. • 2. A combination ABfG is sufficient for the outcome to be enhanced. • 3. A series of combinations all qualify, using the consistency cutoff of 0.8, and these can be summarised in an equation.
22

                                                      ILLUSTRATION
• Use Lam and Ostrom to Illustrate. Convert their table to numbers. In fsQCA
  set the S-consistency cutoff at 0.80 and frequency >= 1.
EXAMPLE: CIVIL LIBERTIES APPEAR TO
23
BE NECESSARY BUT NOT SUFFICIENT
FOR GENDER EMPOWERMENT
1.00
gender empowerment index, calculated by UNDP
Key: Each case is one
country.
0.80
Horizontal:
freedomhouse Civil
0.60 Liberties Index (Gastil
index)
Low GEM
0.40
Vertical: UNDP Gender
Empowerment Index
0.20
1.00 2.00 3.00 4.00 5.00 6.00 7.00
Civil liberties 1=low, 7 = high24
EXAMPLE: SHOWING THE
Warning: the dots should be jittered so
EXCEPTIONS
1.00 that each country is separated from others
of the same values. Or use hollow circles
gender empowerment index, calculated by UNDP
Key: 1 case is one
with size corresponding to N (or to country.
0.80 population).
Horizontal:
freedomhouse civil
0.60 liberties index (Gastil
Exceptions index)
0.40
Vertical: UNDP Gender
Empowerment Index
0.20
1.00 2.00 3.00 4.00 5.00 6.00 7.00
Civil liberties 1=low, 7 = high1.00 25
THE EXCEPTIONS HAVE UNIQUE
Norway
gender empowerment index, calculated by UNDP
Denmark
0.80
COUNTRY HISTORIES Australia
Austria
Canada
Singapore Argentina Bahamas
Israel Slovakia Portugal
0.60 Namibia
Croatia
Botswana
Malaysia Macedonia, TFYR Peru Greece
Cyprus
Russian Federation Swaziland Bolivia Hungary
Uruguay
Colombia Ecuador Panama
Pakistan
Belize Chile
Venezuela Paraguay
0.40 Bahrain
Cambodia Honduras
Georgia Korea, Rep. of
Iran, Islamic Rep. of
Fiji
Egypt Sri Lanka
Turkey
Bangladesh
Saudi Arabia
0.20
Yemen26
DATA – RAW – NEPAL IRRIGATION
A R F L C SUCCESS
Success in INW W
Not
W
0 1 0 1 1 1 1
0 1 1 1 1 2 0
1 1 0 1 1 2 0
1 1 1 1 1 2 0
0 0 0 0 1 1 0
0 1 0 0 1 1 0
0 0 1 1 1 0 1
1 0 0 0 0 0 1
1 1 1 0 0 1 0
1 1 0 0 1 1 0
1 1 1 0 1 1 0
The number of rows here is 11. This is the number of configurations, allowing for some contradictory
configurations, i.e. counting as a single configuration both the aRfLC combination with W and NOT-W outcome.
That is, aRfLCW and aRfLCw.27
FSQCA RESULTS
• This is a simple CSV or XLSX file.
• Model: w = f(a, r, f, l, c)
• No factor was necessary overall.
• Test for sufficiency.
• Lam & Ostrom report that several combinations of factors were sufficient.28
RESULTS, CRISP SET QUINE ALGORITHM
(HERE - WE HAVE STILL SPECIFIED THAT CONTRADICTIONS ARE EXCLUDED
ALSO CODED A CONTRADICTION AT 0.5 AS A 0 I.E. EXCLUDE/NO.)
raw unique
coverage coverage consistency
---------- ---------- ----------
a*r*c 0.500000 0.250000 1.000000
~a*~f*~l*c 0.166667 0.166667 1.000000
a*r*f*~l 0.166667 0.083333 1.000000
r*f*l*c 0.333333 0.166667 1.000000
solution coverage: 0.916667
solution consistency: 1.000000
This tells you: The four pathways’ results are all highly consistent (1.0) with Sufficiency.
A and R and C were sufficient to achieve a good water supply outcome.
But not-A combined with absence of F, L and the presence of C was also sufficient ; more
rarely; a particular pathway.
R is invoked in 3 out of 4 sufficient pathways in Nepal watersheds. So is C.29
HOW THIS IS REPORTED:
• ARC or aflC or ARFl or RFLC* outcome.
• ARC + aflC + ARFl + RFLC outcome.
• AR ( C + Fl) + ... W
• AR ( C + Fl) + C ( afl + RFL) W
• These steps use Boolean algebra.
• The four terms represent 13 cases of HIGH W and all the other case offers a
contrast.
• These are four pathways.
• The necessity of F occurs only within two pathways.
• The absence of F is necessary within one pathway.
• A also plays a role that varies from pathway to pathway.
• * a short appendix uses this configuration to define ‘consistency’.30
TAKING THIS FORWARD WITH
BOOTSTRAPPING
x2 sufficient for Y, with X highly
capable of raising Y high
• Calculate C which is 1.0 in the
1
diagram shown.
0.9 • Exceptions reduce C below 1.0.
0.8
• Bootstrap the sample by taking
0.7 1000 samples with replacement.
• Permutate through each possible
0.6
0.5
y configuration.
0.4
0.3 • Calculate C for each permutation.
0.2 • Calculate Upper and Lower
0.1 bounds, which are asymmetrical.
0
0 0.2 0.4 0.6 0.8 1 • Compare and rank the pathways.31
REFERENCES
• Lam and Ostrom (2010). “Analyzing the dynamic complexity of development interventions:
lessons from an irrigation experiment in Nepal, Policy Science, 43:1, pp. 1-25. DOI
10.1007/s11077-009-9082-6
• Ragin, C.C. (2008). Redesigning social inquiry: Set relations in social research. Chicago:
Chicago University Press.
• Ragin, C. C. (2000). Fuzzy-set social science. Chicago; London, University of Chicago
Press. (One only needs to read the first half to cover QCA; the second half covers Fuzzy
Set Analysis.)
• Byrne, D., and C. Ragin, eds. (2009), Handbook of Case-Centred Research Methods,
London: Sage.
• Rohwer, Gotz (2010). Qualitative Comparative Analysis: A Discussion of Interpretations. European
Sociological Review. Online version. July 19. DOI: 10.1093/esr/jcq034
• Rihoux, B., & Ragin, C. C. (2009). Configurational comparative methods. Qualitative Comparative
Analysis (QCA) and related techniques (Applied Social Research Methods). Thousand Oaks and
London: Sage.
• HUNT, SHELBY D., A Realist Theory of Empirical Testing: 'Resolving the Theory-Ladenness/Objectivity
Debate' , Philosophy of the Social Sciences, 24:2 (1994:June), p.13332
MORE REFERENCES
• Byrne, D. (2005). "Complexity, Configuration and Cases”, Theory, Culture and
Society 22(10): 95-111.
• Ragin, C. C. (1987). The Comparative Method: moving beyond qualitative
and quantitative strategies. Berkeley ; Los Angeles ; London, University of
California Press.
• Snow, D. and D. Cress (2000). "The Outcome of Homeless Mobilization:
the Influence of Organization, Disruption, Political Mediation, and
Framing." American Journal of Sociology 105(4): 1063-1104.
• Chapter 15 of R. Kent (2007), Marketing Research: Approaches,
Methods and Applications in Europe, London: Thomson Learning.33 Thank you for your attenion. Comments to me via email wendy.olsen@manchester.ac.uk Twitter address: @Sandhyamma
You can also read