Northamptonshire COVID-19 Weekly Surveillance Report - Northamptonshire County Council
←
→
Page content transcription
If your browser does not render page correctly, please read the page content below
Northamptonshire COVID-19
               Weekly Surveillance Report
• Clinically vulnerable adults who shielded in the first lockdown are being urged to do so again – even if they have received both
  doses of the vaccine
• A total of 3,009 Northamptonshire residents have tested positive for COVID-19 in the last week
• Mixing between households, in spite of national lockdown rules, is still the greatest cause of transmission locally

                                              Data up to 24 January 2021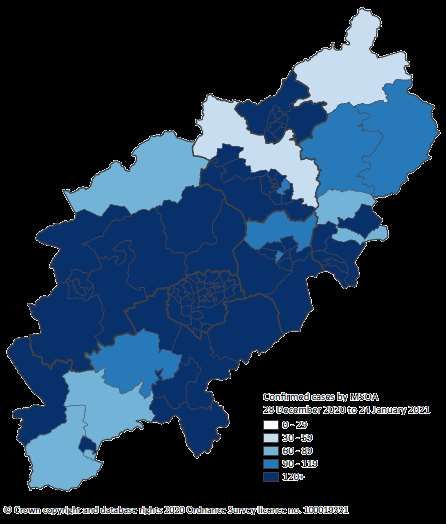
National Lockdown
All residents in           Under the national lockdown restrictions, the Government is ordering everyone to stay at
Northamptonshire and       home. You may only leave the house for limited reasons permitted in law, such as:
across England are         • To shop for essentials
officially being told to   • To work, if you absolutely cannot work from home
‘Stay at Home, Protect     • To exercise once a day
the NHS and Save Lives.’   • To seek medical assistance, for example to get a COVID-19 test
                           • Or to escape domestic abuse
                                                       Full National Lockdown Guidance

2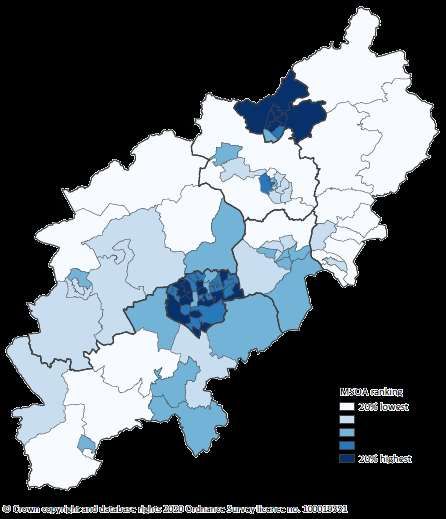
Rapid COVID-19 Testing
• Two community COVID-19 Rapid Testing Centres are open in Northamptonshire for key workers who are not showing
  symptoms of COVID-19.
• The new community based testing sites are at Lodge Park Sports Centre in Corby and the University of Northampton.
  The test is called a Lateral Flow Test and involves a swab of the mouth and nose and provides a result within 30 minutes.
• The aim of testing people who do not have COVID-19 symptoms is to identify those who may be infectious without being
  aware in order to reduce spread of the virus but it cannot definitively tell you if you do not have COVID-19. For those
  who test positive, immediate isolation is required for 10 days as with a PCR test.
• Testing slots must be booked online in advance and priority is given to workers in the following sectors: Health or social
  care, transportation, education or childcare (if not receiving regular rapid tests via the workplace), essential shops,
  supermarkets or financial services, food production or processing, warehousing, packing or distribution, essential
  public sector services including waste, bin collections, security, construction, utilities or communications and agency
  workers. It is advisable for those people working in these sectors to take up the opportunity to get tested on a weekly
  basis to help to reduce the spread of the virus.
• Further sites across the county will open in the coming weeks.

3
COVID-19: Let’s Use All The Tools We Have!
Lockdown is starting to work but we have a long way to go. Remember: ‘act as if you have it’ because you may not know you do.
Stay at home, stay safe, keep others safe and together we will beat this!
• Get tested! Did you know that up to 80% of people who have COVID-19 may show no symptoms at all but they still carry the
  disease at a strength which could kill another person? If such a high percentage of the population could have the disease
  without showing symptoms, they could be casually spreading the disease everywhere they go. Community-based
  asymptomatic testing sites are now open to those who are unable to work from home and particularly those in high-risk
  workplaces or key worker roles. Testing is available at sites in Corby and Northampton with booking available through the NCC
  website. Large workplaces can also apply to host lateral flow device testing in house. Details will appear on the NCC website
  shortly.
• Get vaccinated! Respond to the call when it’s your turn and get that jab in your arm. The more people who get vaccinated, the
  more likely we are to beat the coronavirus. The new mass Vaccination Centre is now open at the Royal Pavilion building in
  Moulton Park. This presents us with the opportunity of vaccinating even more people each week, as national supplies allow.
  Letters will be sent out to people in priority cohorts 1-4, over 80s, front line workers, over 75s and the over 70s and Clinically
  Extremely Vulnerable, explaining how they can book online or by phone. When you are contacted, please attend your booked
  appointments at exactly the time you’re asked to, so that we can avoid queues in this cold weather.
• Complacency can kill! Although we have these new tools to help us in the fight against COVID-19, the new mutant strain of the
  virus is up to 70% more transmissible and 30% more deadly than the previous strain. Even though case rates are reducing
  slowly, they remain alarmingly high. However tired you may be, keep following the gold standard trio: hands, face space.
  We all know that COVID-19 is invisible which is why it presents us with such a mammoth challenge. We are in national lockdown
  and compliance with Government restrictions and regulations is essential if we are to see our positive case rates,
  hospitalisations and deaths continue to come down.

4

Total and Weekly Summary
    A total of 37,496 positive cases have been identified in Northamptonshire to date. Of this number, 3,009 were
    identified in the last week, 18th to 24th January 2021.

                                                          This graph shows the total number of people who have tested
                                                          positive for COVID-19 in Northamptonshire each week since
                                                          2nd November 2020.
                                                          Weekly case numbers increased significantly during the
                                                          course of December and into early January. Although cases
                                                          have been decreasing over the last two weeks, the latest
                                                          weekly case total is still 18% higher than that seen in the
                                                          week of 21st December 2020.
                                                          The latest week’s figures are likely to increase further as data
                                                          for the most recent days are subject to reporting delays.

5
Total Cases by District and Borough
                                                                               This table shows the total number of people who
                                                                               have tested positive for COVID-19 up to 24th January
                                               Cases in week                   2021 in each of Northamptonshire’s seven districts
                             Total cases to                     Change from
    Area                                      18 Jan to 24 Jan                 and boroughs.
                              24 Jan 2021                      previous week
                                                   2021
                                                                               Northamptonshire’s total weekly cases shows an
    Northamptonshire            37,496            3,009         Decrease       increase of 18% when compared to the week of 21st
    Corby                        3,782             401          Decrease       December 2020.
    Daventry                     3,404             219          Decrease
                                                                               Northamptonshire as a whole, and all districts and
    East Northamptonshire        3,569             285           Increase      boroughs except for East Northamptonshire, have
    Kettering                    4,388             406          Decrease       seen a decrease in case numbers when compared to
                                                                               the previous week. These decreases are good news
    Northampton                 14,625            1,138         Decrease       but we must work together to maintain this trend.
    South Northamptonshire       4,050             228          Decrease
                                                                               Please note that extreme caution must be applied
    Wellingborough               3,678             332          Decrease
                                                                               when viewing week on week changes. To see the
                                                                               overall changes in areas in context please see slides
                                                                               14, 15 and 16.

6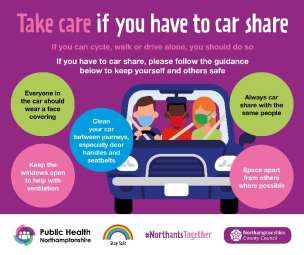
Rates of Cases by District and Borough
                                                                                                           The data in this table show us what the total and
                                       Cumulative      Rate per        Compared to        Compared to
                                                                                                           most recent week’s positive COVID-19 case
                                         rate per     100,000 15      County rate 15     England rate 15
    Area                                                                                                   numbers for our districts and boroughs would
                                       100,000 to    Jan to 21 Jan     Jan to 21 Jan      Jan to 21 Jan
                                       21 Jan 2021       2021              2021               2021         look like if each area had the exact same
                                                                                                           population size (100,000).
    Northamptonshire                     4,858           450.2               -              Sig higher
    Corby                                5,069           603.7          Sig higher          Sig higher
                                                                                                           This helps us to compare geographic areas with
                                                                                                           different sized populations more accurately.
    Daventry                             3,877           304.8          Sig lower           Sig lower
    East Northamptonshire                3,684           305.7          Sig lower           Sig lower
                                                                                                           Northamptonshire’s infection rate per 100,000
                                                                                                           population for the most recent week is 450.2,
    Kettering                            4,188           444.1            Similar            Similar       which is significantly higher than the national
    Northampton                          6,366           589.0          Sig higher          Sig higher     average.
    South Northamptonshire               4,216           292.1          Sig lower           Sig lower
                                                                                                           All district and borough infection rates, except for
    Wellingborough                       4,489           442.9            Similar            Similar       Northampton and Corby, are significantly lower
Source: Gov.uk Coronavirus Dashboard                                                                       than or similar to the national average.
                                                 *Please note that the word sig means ‘significant’,       Northampton and Corby’s rates are significantly
                                                 which is a statistical term that simply means that the    higher than the national average.
                                                 research is valid.

7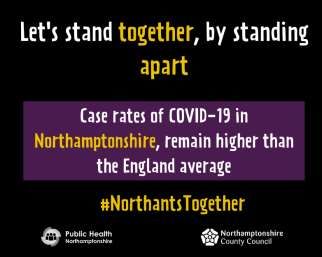
Percentage Change in Recent 7-day Case Rate
    This chart shows percentage changes in case rates over the last 3 months. Percentage changes are calculated by
    comparing to the previous non-overlapping 7-day period. It shows that Northamptonshire’s case rates increased more
    rapidly in December than they did ahead of the previous national lockdown in November and have decreased more
    slowly following the implementation of national lockdown policies.

* Data for the last 5 days are not displayed as they will be incomplete.
    Source: Gov.uk Coronavirus Dashboard

8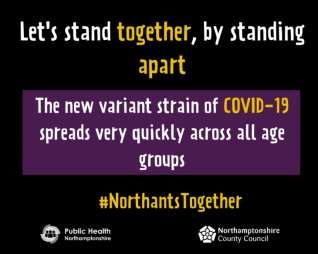
Deaths Within 28 Days of Positive Test
                                                                                                  This table shows total number of deaths of people
                                           Total deaths   Deaths in week      Change from         who had a positive test result for COVID-19 and died
      Area                                   to 24 Jan    18 Jan to 24 Jan      previous          within 28 days of the first positive test, reported up
                                               2021            2021              week             to 24th January 2021 for each of Northamptonshire’s
                                                                                                  seven districts and boroughs.
      Northamptonshire                         1,144            58              Decrease
                                                                                                  Northamptonshire as a whole, and all districts and
      Corby                                    106               8              Decrease
                                                                                                  boroughs except for East Northamptonshire, have
      Daventry                                 120               8              Decrease          seen either a decrease or no change in numbers of
                                                                                                  deaths when compared to the previous week. East
      East Northamptonshire                    158               7              Increase
                                                                                                  Northamptonshire has seen an increase in deaths
      Kettering                                148              12              Decrease          compared to the previous week.
      Northampton                              406              14              Decrease
                                                                                                  We must work together now more than ever to
      South Northamptonshire                    95               4             No change          reduce numbers of deaths as recent scientific
                                                                                                  evidence suggests that the new variant of COVID-19
      Wellingborough                           111               5              Decrease
                                                                                                  in the UK is deadlier than the original virus.
        Source: Gov.uk Coronavirus Dashboard

* People who died more than 28 days after their first positive test are not included, whether or not COVID-19 was the cause of death.

9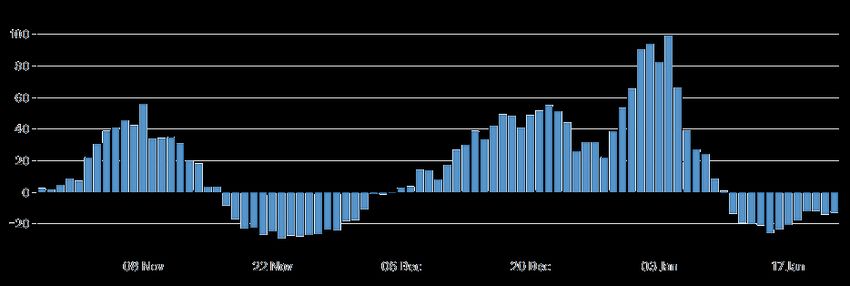
Rate of Weekly Lab Confirmed Cases
                                                                                                        This graph includes all testing data. Recent data
                                                                                                        shows that Northamptonshire’s rate of cases in the
                                                                                                        last seven days remains above the England average.
                                                                                                        With the exception of Daventry, South
                                                                                                        Northamptonshire and East Northamptonshire, all
                                                                                                        districts and boroughs now have weekly total rates
                                                                                                        above the England average, with recent data
                                                                                                        showing a rising case rate trend in East
                                                                                                        Northamptonshire and Kettering.

                                                                                                        All other districts and boroughs are showing
                                                                                                        decreasing trends in case rates over the last couple
                                                                                                        of weeks. Corby’s rate is currently the highest in the
                                                                                                        county, followed closely by Northampton. As Corby
                                                                                                        saw the sharpest increase in cases after Christmas,
                                                                                                        its case rate is currently 211% higher than it was on
                                                                                                        21st December 2020.
     Source: Gov.uk Coronavirus Dashboard.

 * These are 7-day rolling total numbers of cases as a rate per 100,000 population – this is done to even out the fluctuations we see in testing volumes on
 weekdays vs weekends.
10
Recent Cases by Age and Gender
This graph shows the number of positive test results for
COVID-19 in Northamptonshire over the last 28 days by
gender and by ten-year age band.
Overall, more women than men tested positive for COVID-
19 in the last 28 days.
The age group with the most positive tests was 30 to 39
year olds for both men and women. Case numbers are
currently highest amongst working age adults. The new
variant is appearing to cause more hospital admissions and
deaths in this age category.
Over the last 4-week period there have been further
increases in numbers of cases amongst people aged 60+.
This is of particular concern as these age groups tend to be
at greater risk of more severe disease, observed hospital
admission and death.
*Please refer to the gov.uk coronavirus dashboard heat map for more information on cases in specific age groups.
11Rate of Weekly Lab Confirmed Cases in
Ages 60+
This graph includes testing data for people
aged 60+. It shows that the rate of
confirmed cases for people aged 60+ in
Northamptonshire has started to fall in the
last week following the sharp rise seen since
Christmas.
Northampton and Kettering’s case rates for
ages 60+ are currently higher than the
Northamptonshire average. Corby’s case
rate for ages 60+ has fallen slightly below
Northamptonshire average in the last week.
Northampton’s rate remains the highest in
the county, followed by Kettering’s.
Case rates in all districts and boroughs
remain high but have decreased or
plateaued in the last week.
* These are 7-day rolling total numbers of cases as a rate per 100,000 population – this is done to even out the fluctuations we see in testing volumes on
weekdays vs weekends.
12Hospital Beds Occupied by Confirmed
COVID-19 Patients This chart shows the trend in numbers of beds at
Northampton and Kettering General Hospitals occupied
by COVID-19 patients since 1st August 2020.
It shows that the number of beds occupied due to
COVID-19 remained relatively steady over the late
summer through to mid-October, at which point
numbers of patients in hospital began to increase
sharply.
Although case rates went down during the second
national lockdown, the numbers of patients in
hospital due to COVID-19 continued to rise. There has
been a further sharp rise in hospital bed occupancy
following a brief decline in the run-up to Christmas.
The latest data shows that a total of 346 COVID-19
patients occupied hospital beds in Northamptonshire
on 26th January 2021. Bed occupancy appears to now
be on a decreasing trend following the record high of
422 seen on 13th January 2021.
13Cases by Community – Last 28 Days The chart shows the local communities within Northamptonshire where COVID-19 infections over the last 28 days are highest. Knowing the areas with the highest case numbers in the last 28 days help us to prioritise and focus our support locally. 14
Case Rates by Community – Last 28 Days per 100,000
 population

  These graphics show
  what positive COVID-
  19 case numbers over
  the last 28 days would
  look like if each local
  community had the
  exact same size
  population (100,000).

  The map illustrates the
  28-day infection rate
  per 100,000
  population across the
  whole county.

* Please note that the numbers shown on this page represent the best possible estimate we can make from a wider range of numbers, because there is always a
margin of error when calculating cases per 100,000 population – particularly where actual case numbers are small.

 15
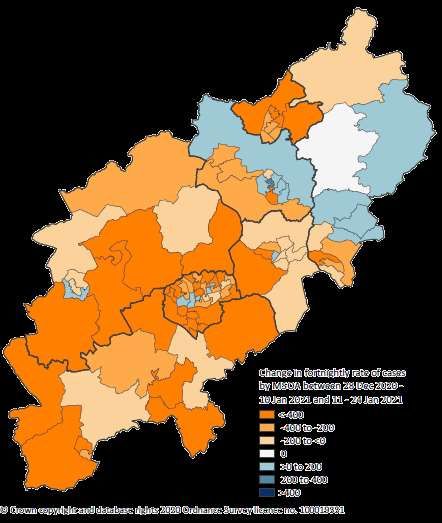
Change in Case Rates by Community – Fortnightly
 per 100,000 population

                                          Rank    Name
 If each community had the exact
                                             1.   Kettering Central East (Kett)
 same size population (100,000) in
                                             2.   Kettering East (Kett)
 Northamptonshire, this graphic
                                             3.   Stornton & Sixfields (Nton)
 shows how COVID-19 case numbers
 in the last 14 days would have              4.   Oundle, Warmington & Titchmarsh (EN)
 changed in each community                   5.   Daventry South & Southbrook (Dav)
 compared to the previous 14 days.           6.   Kettering Town & West (Kett)
                                             7.   Kettering Avondale Grange (Kett)
 The 15 areas with the greatest              8.   St Michael's Road (Nton)
 increases in case rates are listed          9.   Ringstead, Woodford & Stanwick (EN)
 next to the map.                           10.   Brickhill (Wboro)
                                            11.   Eastfield (Nton)
 Areas with the greatest increases in       12.   Geddington, Rushton & Stoke Albany (Kett)
 rates of infection show us where           13.   Barton Seagrave (Kett)
 we need to prioritise and focus our        14.   Raunds (EN)
 support locally.                           15.   Town Centre & Semilong (Nton)

* Please note that the numbers shown on this page represent the best possible estimate we can make from a wider range of numbers, because there is always a
margin of error when calculating cases per 100,000 population – particularly where actual case numbers are small.

 16
Summary of Outbreaks 25/01/2021
Two or more cases linked by place and time to that setting. Totals are 28 day counts for care homes and hospitals, and 14
day counts for all other locations.
In the last 28 days Corby Daventry East Northants Kettering Northampton South Northants Wellingborough County total Case total
Outbreaks 6 6 6 7 22 6 5 58 625
Care home/service 4 5 6 7 17 4 5 48 535
Childcare 1 0 0 0 0 0 0 1 11
Workplace 0 0 0 0 3 2 0 5 55
Education 0 1 0 0 2 0 0 3 22
Hospital/hospice 1 0 0 0 0 0 0 1 2
Other 0 0 0 0 0 0 0 0 0
• Please note that this summary covers all situations classified as ‘active’. An active situation has had at least 1 positive case within the previous 28 days.
• Outbreaks are pended if there are no new cases reported for Care H/Heath care in 14 days and 7 days for others.
• Although outbreaks have increased this week and are related to a particular setting - it is important to note that the majority of cases are due to community
household transmission.
17Winter Flu - Protecting the Immune System
Winter Flu immunisation uptake up to end of week 02 (11-17 Jan 2021)
This data represents 91.3% of GP practices uploading their data for week 02. Please note that individuals can appear in more than one
cohort, e.g. pregnant and in risk category.
Number of further
Total Number eligible Number of immunisations
Target Group immunisations required to Target %
people given
meet target
Over 65 120,542 98,147 Target met 75%
Under 65 at risk 93,829 50,078 20,294 75%
Pregnant Women 5,921 2,266 2,175 75%
2 and 3 year olds 17,653 9,558 3,682 75%
The table below shows that the current progress for flu uptake has improved in all eligible categories compared to week 02 in 2020.
Total Combined At-Risk
STP Year 65 and over Population 6 months to All Pregnant Women All Aged 2-3 years
under 65 years
Northamptonshire STP 2020/21 81.4% 53.4% 38.3% 54.1%
Northamptonshire STP 2019/20 70.1% 41.8% 35.2% 38.7%
Northamptonshire STP Change +11.3% +11.6% +3.1% +15.4%
18Public Health Measures • Public Health Northamptonshire, Environmental Health Departments within District and Borough Councils, Northamptonshire County Council and Northants Police will use enforcement powers where there is non-compliance in relation to COVID-19 Regulations. • The Health Protection (Coronavirus, Restrictions) (All Tiers) (England) Regulations 2020 are currently in force imposing Tier 4 restrictions nationally since 6th January 2021. • There are a number of established forums within Northamptonshire to discuss and agree a consistent approach to these Regulations. • Although there are a variety of agencies enforcing these restrictions, we have established a Joint Enforcement Team to target non- compliance which includes a multi-agency approach to interventions. • We will continue to engage with our community to ensure compliance with the objective of supporting public health and reducing the transmission rate of COVID-19. • However, gatherings in private dwellings; undertaking non-essential journeys; a failure to wear face coverings and failure to self- isolate when required to do so will result in the use of proportionate enforcement powers aimed at protecting public health which can include the service of Fixed Penalty Notices. 19
Got Symptoms? Get Tested

• To find out more information about local testing sites visit: Northamptonshire COVID-19 Testing Update.
• Tests can be booked online at NHS COVID-19 or by calling 119. Home testing kits can also be ordered subject to
  availability.
• It is vital that when you leave the house to be tested you must go straight to the testing centre and return home
  immediately to self- isolate until you get your results.
• Advice on how to access a COVID-19 test can be found here: COVID-19 Guidance on Getting Tested.

20
Help, Guidance and Fines

     • Government Financial support is now available for eligible individuals who have to
       self-isolate for up to 14 days. Details of financial support can be found here.

     • Northamptonshire County Council has put together a Self-isolation support pack for
       residents.

     • Those who do not follow Test and Trace guidance, or those who breach self-isolation,
       or lockdown legislation will be fined £1,000.

22
You can also read