Northamptonshire COVID-19 Weekly Surveillance Report - Data ...
←
→
Page content transcription
If your browser does not render page correctly, please read the page content below
Northamptonshire COVID-19
Weekly Surveillance Report
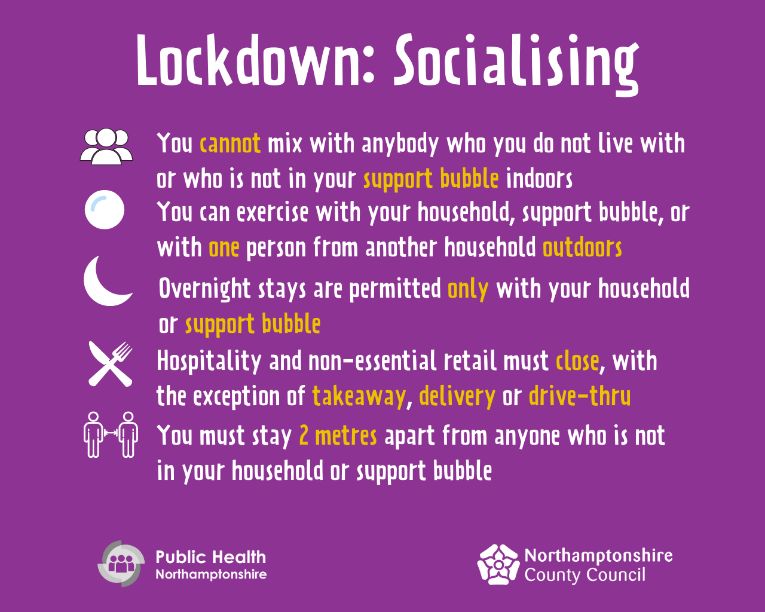
• National lockdown restrictions are in place across England until further Government review.
• A mutant, more transmittable strain of the coronavirus is causing rapid increases in infection rates nationally.
• Clinically vulnerable adults who shielded in the first lockdown are being urged to do so again.
• A record high of 4,307 Northamptonshire residents have tested positive for COVID-19 in the last week.
• Coronavirus related hospital admissions and deaths remain high in the over 60s, with up to 30 per cent of beds occupied by
patients with the virus.
Data up to 3 January 2021
National Lockdown
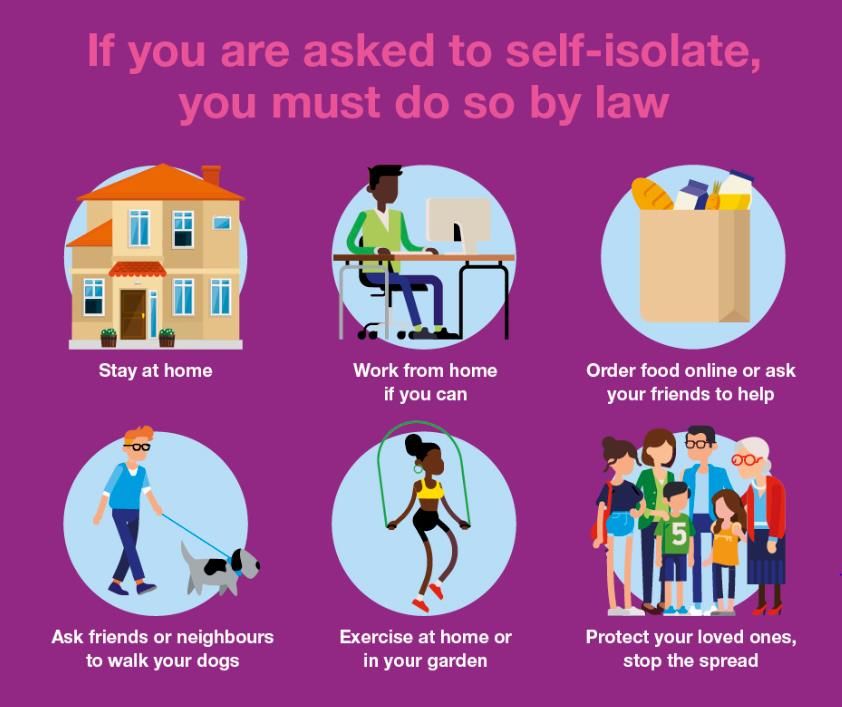
Under the national lockdown restrictions, the Government is ordering everyone to stay at
All residents in home. You may only leave the house for limited reasons permitted in law, such as:
Northamptonshire and • To shop for essentials
across England are • To work, if you absolutely cannot work from home
officially being told to • To exercise once a day
‘Stay at Home, Protect • To seek medical assistance, for example to get a COVID-19 test
the NHS and Save Lives.’ • Or to escape domestic abuse
For the full national lockdown guidance click here.
2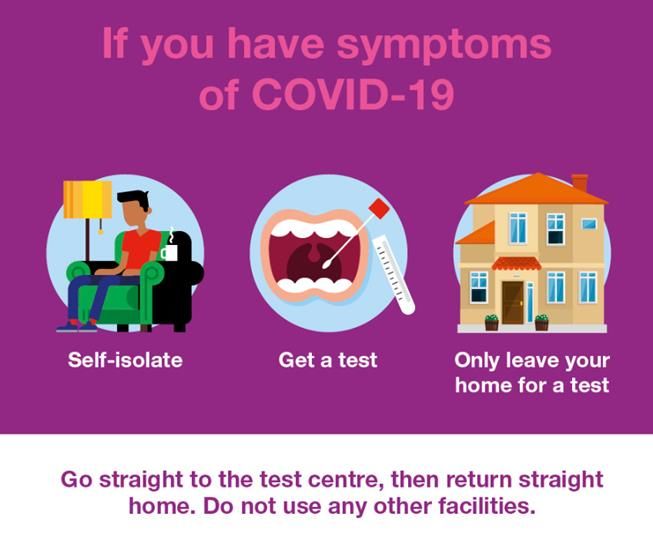
Stay at Home, Protect the NHS and Save Lives
• Cases are rising and the mutant strain is rife across the county. Act as though you have the virus, be careful to
  wear your mask correctly, wash your hands thoroughly and socially distance at all times when outside your home.
  Stay at home wherever possible but if you have to go out, try to avoid busy places and times. If you were deemed
  extremely clinically vulnerable during the first lockdown you must shield again if possible.
• Data is still showing that coronavirus related hospital admissions and deaths are continuing to rise in the over
  60s. It’s absolutely vital that we all exercise the highest degree of personal responsibility, especially when
  coming into contact with people over the age of 60. If you must mix with people in this age group due to child
  care responsibilities, you must do all you can to protect them. Ventilate rooms, keep a distance and regularly
  encourage them and those they care for to hand wash. If we do not act accordingly, the situation in our hospitals
  will worsen.
• Every contact leaves a trace. The virus can be transferred on all surfaces. Think before you touch and remember
  that pedestrian crossing buttons, lift buttons, handrails and car doors are all touch points which may be
  harbouring the coronavirus. When using public transport, shopping, accepting parcels and deliveries (including
  online shopping), car sharing (in bubbles), touching doors, going in and out of buildings – are all potential points of
  COVID-19 transmission and frequent hand washing is key to reducing the risk of catching COVID-19 from surfaces.

3
Total and Weekly Summary
    A total of 25,683 positive cases have been identified in Northamptonshire to date. Of this number, 4,307 were
    identified in the last week, 28th December 2020 to 3rd January 2021.

                                                          This graph shows the total number of people who have tested
                                                          positive for COVID-19 in Northamptonshire each week since
                                                          12th October 2020.
                                                          Weekly case numbers have increased significantly during the
                                                          course of December and cases in the latest 7 days have
                                                          reached a new record high. The latest weekly case total was
                                                          more than twice as high as the one seen in the peak week at
                                                          the beginning of November, just after the start of the second
                                                          national lockdown.
                                                          The latest week’s figures are likely to increase further as data
                                                          for the most recent days are subject to reporting delays.

4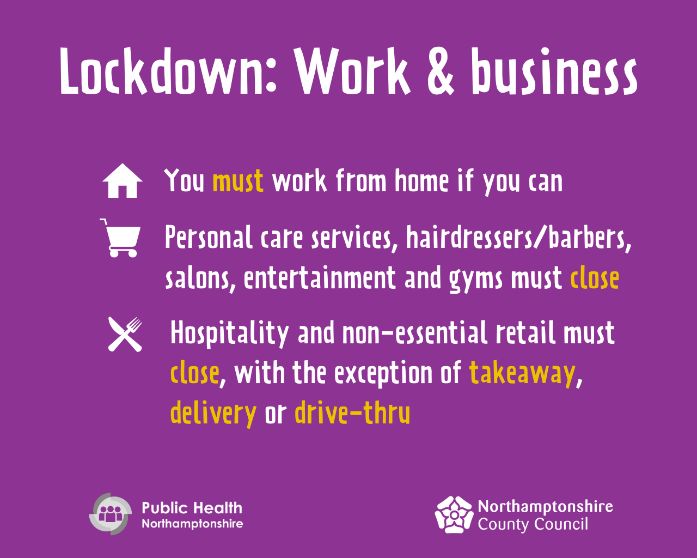
Total Cases by District and Borough
This table shows the total number of people who
Cases in week have tested positive for COVID-19 up to 3rd
Total cases to Change from January 2021 in each of Northamptonshire’s
Area 28 Dec to
3 Jan 2021 previous week seven districts and boroughs.
3 Jan 2021
Northamptonshire 25,683 4,307 Northamptonshire as a whole and all districts and
boroughs have seen an increase in cases
Corby 2,191 511
compared to the previous week.
Daventry 2,395 460 Northamptonshire’s total weekly cases are now
East Northamptonshire 2,634 318 more than twice as high as they were around the
start of the second national lockdown in
Kettering 3,011 440 November.
Northampton 9,989 1,683
Please note that extreme caution must be applied
South Northamptonshire 2,955 522 when viewing week on week changes. To see the
Wellingborough 2,508 373 overall changes in areas in context please see
slides 11, 12 and 13.
5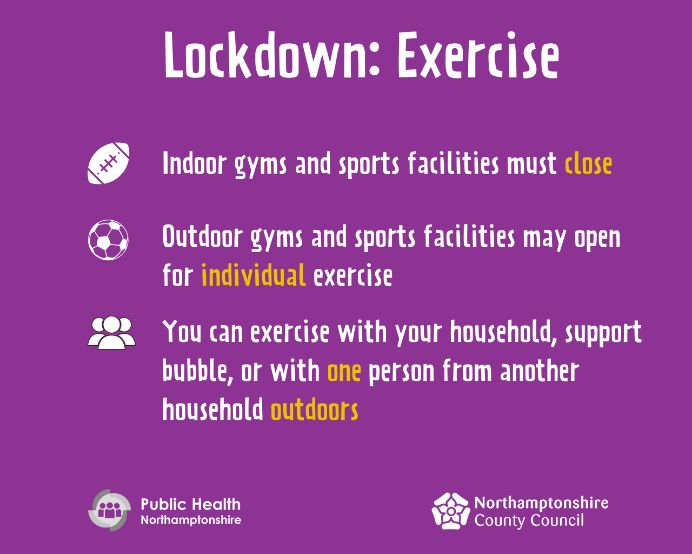
Rate of Weekly Lab Confirmed Cases
                                                                                                               This graph includes all testing data. It shows
                                                                                                               that Northamptonshire’s rate of cases in the
                                                                                                               last seven days is below the England average,
                                                                                                               however the gap between the
                                                                                                               Northamptonshire average and England
                                                                                                               average has narrowed in recent days.
                                                                                                               With the exception of Northampton, all
                                                                                                               districts and boroughs have weekly total rates
                                                                                                               below the England average. Northampton’s
                                                                                                               case rate has increased ahead of the
                                                                                                               national average and is currently the highest
                                                                                                               in the county, followed by South
                                                                                                               Northamptonshire.
                                                                                                               All districts and boroughs are currently on a
                                                                                                               rising trend, with the rate for Corby having
                                                                                                               seen the sharpest increase over the past
                                                                                                               week.

* These are 7-day rolling total numbers of cases as a rate per 100,000 population – this is done to even out the fluctuations we see in testing volumes on
weekdays vs weekends.
Source: coronavirus.data.gov.uk.

6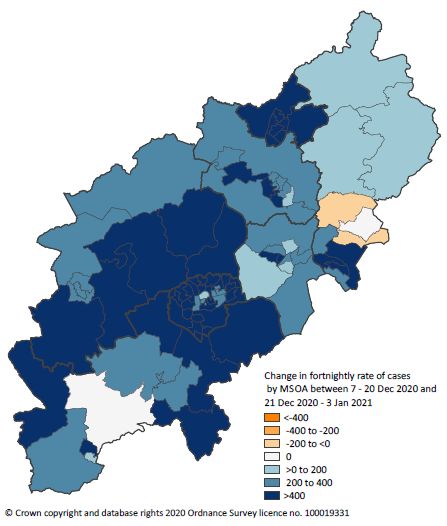
Recent Cases by Age and Gender
                             This graph shows the number of positive test results for
                             COVID-19 in Northamptonshire over the last 28 days by
                             gender and by ten-year age band.
                             Overall, more women than men tested positive for COVID-
                             19 in the last 28 days.
                             The age groups with the most positive tests were 30 to 39
                             year olds for men and 20 to 29 year olds for women. Case
                             numbers are currently highest amongst working age
                             adults.
                             Over the last 4-week period there have been further
                             increases in numbers of cases amongst people aged 60+.
                             This is of particular concern as these age groups tend to be
                             at greater risk of more severe disease and observed
                             hospital admission.

7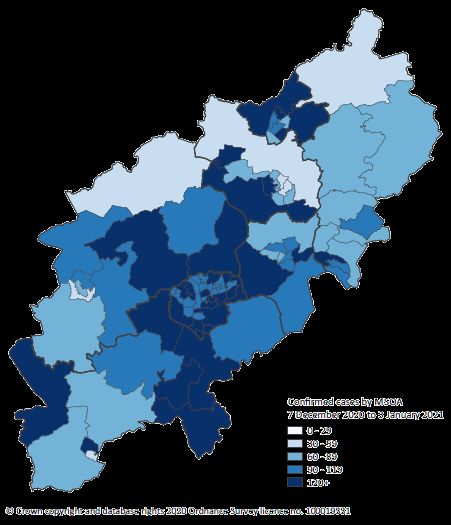
Rate of Weekly Lab Confirmed Cases in
                       Ages 60+
                                                                                                               This graph includes testing data for people
                                                                                                               aged 60+. It shows that the rate of
                                                                                                               confirmed cases for people aged 60+ in
                                                                                                               Northamptonshire has increased during
                                                                                                               the course of December and particularly in
                                                                                                               the days following Christmas.

                                                                                                               Corby and Northampton’s case rates for
                                                                                                               ages 60+ are currently higher than the
                                                                                                               Northamptonshire average.
                                                                                                               Northampton’s case rate for ages 60+
                                                                                                               remains the highest in the county.

                                                                                                               Although South and East
                                                                                                               Northamptonshires have seen decreases in
                                                                                                               rates in recent days, case rate trends for
                                                                                                               ages 60+ have increased in the last week
                                                                                                               across all districts and boroughs.

* These are 7-day rolling total numbers of cases as a rate per 100,000 population – this is done to even out the fluctuations we see in testing volumes on
weekdays vs weekends.

8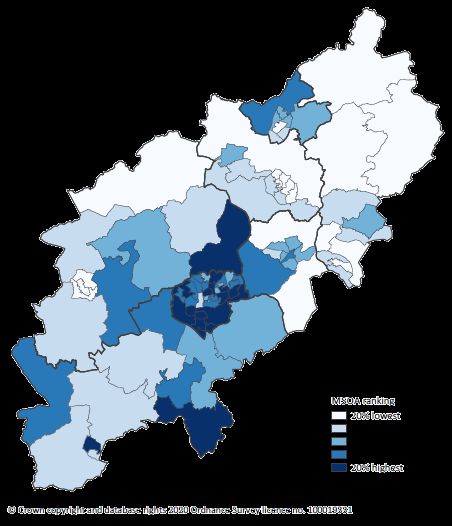
Rates of Cases by District and Borough
                                                                                                         The data in this table shows us what the total and
                                                        Rate per       Compared to      Compared to
                                      Cumulative rate                                                    most recent week’s positive COVID-19 case numbers
                                                       100,000 25     county rate 25   England rate 25
Area                                   per 100,000 to                                                    for our districts and boroughs would look like if each
                                                      Dec to 31 Dec   Dec to 31 Dec     Dec to 31 Dec
                                        31 Dec 2020                                                      area had the exact same population size (100,000).
                                                          2020            2020              2020

    Northamptonshire                      3,202           502.5             -             Sig lower      This helps us to compare geographic areas with
    Corby                                 2,769           524.8          Similar           Similar
                                                                                                         different sized populations more accurately.

    Daventry                              2,592           477.0          Similar          Sig lower      Please note that the word sig means ‘significant’ is a
    East Northamptonshire                 2,669           318.4         Sig lower         Sig lower      statistical term which simply means that the
                                                                                                         research is valid.
    Kettering                             2,800           368.5         Sig lower         Sig lower
    Northampton                           4,176           663.8         Sig higher       Sig higher      Northamptonshire’s infection rate per 100,000
                                                                                                         population for the most recent week is significantly
    South Northamptonshire                2,947           539.7          Similar           Similar
                                                                                                         lower than the national average.
    Wellingborough                        2,951           400.2         Sig lower         Sig lower
    Source: coronavirus.data.gov.uk                                                                      All district and borough infection rates except for
                                                                                                         Northampton’s are significantly lower than or similar
                                                                                                         to the national average. Northampton’s rate is
                                                                                                         significantly higher than the national average.

9
Hospital Beds Occupied by Confirmed
COVID-19 Patients
This chart shows the trend in numbers of beds at
Northampton and Kettering General Hospitals
occupied by COVID-19 patients since 1st August
2020.
It shows that the number of beds occupied due to
COVID-19 remained relatively steady over the late
summer through to mid-October, at which point
numbers of patients in hospital began to increase
sharply.
Although case rates went down during the second
national lockdown, the numbers of patients in
hospital due to COVID-19 continued to rise. There
has been a further sharp rise in hospital bed
occupancy following a brief decline in the run-up
to Christmas. The latest data shows that a total of
342 COVID-19 patients occupied hospital beds in
Northamptonshire on 5th January 2021, the highest
number to date.
10Cases by Community – Last 28 Days The chart shows the local communities within Northamptonshire where COVID-19 infections over the last 28 days are highest. Knowing the areas with the highest case numbers in the last 28 days help us to prioritise and focus our support locally. * Please note that the thresholds for the map’s colour coding categories have been updated, therefore this map cannot be directly compared against previous reports. 11
Case Rates by Community – Last 28 Days per 100,000
  population

   These graphics show
   what positive COVID-
   19 case numbers over
   the last 28 days would
   look like if each local
   community had the
   exact same size
   population (100,000).

   The map illustrates the
   28-day infection rate
   per 100,000
   population across the
   whole county.

* Please note that the numbers shown on this page represent the best possible estimate we can make from a wider range of numbers, because there is always a
margin of error when calculating cases per 100,000 population – particularly where actual case numbers are small.

  12
Change in Case Rates by Community – Fortnightly
  per 100,000 population

  If each community had the exact             1.   Walgrave & Moulton (Dav)
  same size population (100,000) in           2.   Little Billing (Nton)
  Northamptonshire, this graphic              3.   Brackley North (SN)
  shows how COVID-19 case numbers             4.   Long Buckby West & Weedon (Dav)
  in the last 14 days would have              5.   Wootton & Collingtree (Nton)
  changed in each community                   6.   New Duston East (Nton)
  compared to the previous 14 days.           7.   Delapre (Nton)
                                              8.   New Duston West (Nton)
  The 15 areas with the greatest
                                              9.   East Hunsbury (Nton)
  increases in case rates are listed
                                             10.   Rowlett, Gretton & Cottingham (Cor)
  next to the map.
                                             11.   King's Heath & Spencer (Nton)
  Areas with the greatest increases in       12.   Upton & West Hunsbury (Nton)
  rates of infection show us where           13.   Corby Lodge Park (Cor)
  we need to prioritise and focus our        14.   Cogenhoe, Hackleton & Denton (SN)
  support locally.                           15.   Long Buckby East & Ravensthorpe (Dav)

* Please note that the numbers shown on this page represent the best possible estimate we can make from a wider range of numbers, because there is always a
margin of error when calculating cases per 100,000 population – particularly where actual case numbers are small.

  13
Summary of Outbreaks and Exposures 04/01/2021
In the last 28 days Corby Daventry East Northants Kettering Northampton South Northants Wellingborough County total Case total
Outbreaks 2 4 3 2 10 1 2 24 212
Care home/service 1 2 1 6 2 12 120
Outbreak Childcare 1 2 3 19
(two or more cases linked Workplace 1 1 1 1 4 57
by place and time to that
setting) Education 1 1 6
Hospital/hospice 1 1 1 1 4 10
Other
In the last 7 days
Clusters
Cluster Care home/service
(two or more cases Childcare
associated with that Workplace
setting but not
“connected by time and Education
place” to that setting) Hospital/hospice
Other
In the last 7 days
Exposures 1 4 4 1 10 19
Care home/service 1 2 1 1 5 12
Exposure
(single case where there Childcare
has been (or potentially Workplace 1 2 3 3
been) exposure to Education 1 1 2 4
contacts in that setting) Hospital/hospice
Other
Total active situations 34 231
• Please note that this summary covers all situations classified as ‘active’. An active situation has had at least 1 positive case within the previous 28 days.
• Although outbreaks have increased this week and are related to a particular setting - it is important to note that the majority of cases are due to community household transmission.
14Winter Flu - Protecting the Immune System
Winter Flu immunisation uptake up to end of week 52 (27 Dec 2020)
This data represents 91.3% of GP practices uploading their data for week 52. Please note that individuals can appear in more than one
cohort, e.g. pregnant and in risk category.
Number of further
Total Number eligible Number of immunisations
Target Group immunisations required to Target %
people given
meet target
Over 65 120,999 98,112 Target met 75%
Under 65 at risk 85,156 46,136 17,731 75%
Pregnant Women 5,600 2,092 2,108 75%
2 and 3 year olds 17,642 9,413 3,819 75%
The table below shows that the current progress for flu uptake has improved in all eligible categories compared to the same period in
2019/20.
Total Combined At Risk
STP Year 65 and over Population 6months to All Pregnant Women All Aged 2- 3
under 65 years
Northamptonshire STP 2020/21 81.1% 54.2% 37.4% 53.4%
Northamptonshire STP 2019/20 69.4% 40.8% 35.0% 35.1%
Northamptonshire STP Change +11.7% +13.4% +2.4% +18.3%
15Public Health Measures
• Public Health Northamptonshire, Environmental Health departments within District and Borough Councils, Northamptonshire
County Council and Northants Police will use enforcement powers where there is non-compliance in relation to COVID-19
Regulations.
• The Health Protection (Coronavirus, Restrictions) (Tiers 1-3) (England) Regulations 2020 came into force on the 2 December 2020
and amongst a number of new provisions, imposed restrictions on a variety of businesses within our local communities. It was
amended on 6th January 2021 to implement Tier 4.
• There are a number of well established forums within Northamptonshire to discuss and agree a consistent approach to these new
Regulations.
• Although there are a number of different agencies enforcing the relevant Tier restrictions, we have established a Joint Enforcement
Team to target non-compliance which includes multi agency approach to interventions.
• We will continue to engage, explain and encourage within our community to ensure the new provisions are implemented to support
public health with the aim of reducing the transmission rate of COVID-19.
• Notwithstanding this approach, there are a number of existing provisions including wearing face coverings in certain settings,
gatherings, and a failure to self-isolate when required to do so, which will result in the use of proportionate enforcement powers
aimed at protecting public health.
16We Are All In This Together • To find out more information about local testing sites visit: https://www.northamptonshire.gov.uk/coronavirus- updates/Pages/coronavirus-testing-in-northamptonshire.aspx. • Tests can be booked online at nhs.uk/coronavirus or by calling 119. Home testing kits can also be ordered subject to availability. • It is vital that when you leave the house to be tested you must go straight to the testing centre and return home immediately to self- isolate until you get your results. • Advice on how to access a COVID-19 test can be found here: https://www.gov.uk/guidance/coronavirus-covid-19-getting- tested. 17
Partners Working on the COVID-19 Response
PHE – Public Health England
An executive agency of the Department of Health and Social Care (DHSC) which is the expert national public health agency which fulfils
the Secretary of State for Health and Social Care’s statutory duty to protect health and address inequalities, and executes his power to
promote the health and wellbeing of the nation. We work with the Midlands PHE Office.

Local Public Health Teams
Part of Local Authorities (Upper tier and unitary) since 2013, led by Directors of Public Health with a number of specific statutory
responsibilities, including health protection and local control of infectious diseases including immunisation and related functions.

Joint Biosecurity Centre (JBC)
The JBC aims to provide evidence-based, independent analysis, assessment and advice to inform local and national decision-making in
response to COVID-19 outbreaks. This includes:
• helping to inform action on testing, contact tracing and local outbreak management in England
• informing an assessment of the risks to UK public health from inbound international travel
• advising on the COVID-19 alert level
• acting as the main point of liaison between Local Authorities and the Chief Medical Officer and Secretary of State.

Environmental Health Officers
Work within District and Borough Local Authorities and are responsible for monitoring and enforcing health and hygiene legislation.
They are working closely with Public Health Northamptonshire on COVID-19 workplace outbreaks, with the COVID-19 Schools Cell and
Northamptonshire County Council’s Test and Trace service.

18
Government Help, Guidance and Fines

     • Financial support is now available for eligible individuals who have to self-isolate for
       up to 14 days. Details of financial support can be found here.

     • Those who do not follow Test and Trace guidance, or those who breach self-isolation,
       or lockdown legislation will be fined.

19
You can also read