SECOND INTERGOBERNMENTAL REGIONAL CONFERENCE ON AGEING - Brasilia, Brazil, 4 to 6 December, 2007 Social Security Panel: Advances in coverage ...
←
→
Page content transcription
If your browser does not render page correctly, please read the page content below
SECOND INTERGOBERNMENTAL REGIONAL
CONFERENCE
ON AGEING
Brasilia, Brazil, 4 to 6 December, 2007
Social Security Panel: Advances in coverage, quality and
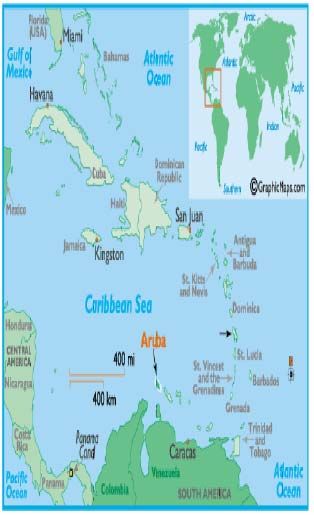
financing countries of the region: the Aruban experience(Slide 2)
LOCATION : 14 miles north of the coast of Venezuela
POPULATION : 106.000 (end 2006)
POLITICAL SYSTEM : autonomous part of the Kingdom of the Netherlands with a
parliamentary democracy
Introduction:
Aruba is a small island state with a population of just over 100.000 about 14 miles
north off the coast of Venezuela. Aruba was until 1985 part of the Netherlands
Antilles, which was comprised of the islands of Aruba, Bonaire, Curacao, Saba, Saint
Eustatius and Saint Martin. Aruba attained its so called ‘’Status Aparte” in January
1986 and became an autonomous part of the Kingdom of the Netherlands with full
autonomy on internal affairs within a parliamentary democratic system. International
affairs and defence resort under the Kingdom and we do have a joint high court of
justice appointed by the monarch.
(Slide 3)
GDP Growth in Afl. millions (US$=Afl. 1,80)
5,000
4,000
3,000
Afl.
2,000
1,000
0
1994 1995 1996 1997 1998 1999 2000 2001 2002 2003 2004 2005 2006
Year
GDP (nominal) GDP (Real)Aruba enjoyed throughout the 1990’s a prosperous economic period with an average
annual (real) economic growth of circa five percent (5.25%). This development was
driven by the expansion of the tourist industry. During this period, the nominal GDP
more than doubled. In 2006, the nominal and the real GDP per capita were
respectively US$ 22.3 thousand and US$ 16.6 thousand. This economic
development caused a need to import foreign workers at such a rate that at the
moment the 2000 Population and Household census was taken, almost one-fourth
(23.2%) of the total population is foreign-born who has settled in Aruba since the year
1990.
The Social Protection System in Aruba: (Slide 4)
I will elaborate next on the social protection in Aruba. The social welfare system in
Aruba is based on:
• a private-public partnership at the implementation level,
• social Policy definitions are in the hands of the government, with participation
of line directorates such as Education, Public Health, Labour and Social
Affairs,
• the social welfare system (safety net) prevailing in Aruba has many features
usually found in the so-called welfare-states, especially in the way public
services and benefits are financed. Most of them are paid for and/or
warranted by state funds,
The Aruban welfare system is essentially a residual welfare system, where the state
has a subsidiary role, as opposed to an institutional welfare system. Although, some
segments are institutionalized and universally available to all residents, such as the
general old age and bereavement’s pensions and curative healthcare. Also
universally accessible are in principle social support services (social work, psycho-
social, community work) delivered by line-ministries’ directorates and publicly
subsidized NGO’s. Following the Dutch model, social services and care are being
delivered primarily by NGOs that are mostly fully or partially subsidized through
public funds. In fact, delivery of social services is perceived as a primary function of
the NGO sector.
On the other hand, public assistance programs are only available after one has
passed a means test. These include (relief checks) welfare, free legal services, public
housing subsidy, etc. In other words, services are received only upon evidence of
established financial needs and qualification for a particular program, nationality and
period of residency.
The next table depicts an overview of the social security programs and their shares of
the GDP over a period of time. Income protection programs and access to healthcare
are in place via compulsory social insurance programs. Within the social security
program framework, illness and work related disability insurances are mandatory for
those workers who qualify. So is also included insurance against work termination
due to employer’s bankruptcy (see also table 6).
(Slide 5)Tabel 3: Overview of revenues and expenditures of social insurance programs and
welfare program by yeat and proportion of GDP
Verzekering 1997 1998 1999 2000 2001 2002 2003
INCOME/TOTAL PREMIUM PAID
Old age 103.746 96.530 114.336 118.759 123.688 120.930 135.136
% GDP (3,8%) (3.2%) (3.7%) (3.6%) (3.6%) (3.5%) (3.8%)
Survivors 18.308 17.035 20.311 20.952 21.827 22.540 22.848
% GDP (0,7%) (0.6%) (0.7%) (0.6%) (0.6%) (0.7%) (0.6%)
Sickness 43.466 53.848 47.870 38.640 16.858 34.091 29.719
% GDP (1.6%) (1.8%) (1.7%) (1.2%) (0.5%) (1.9%) (0.3%)
Work accident 10.559 11.945 14.334 11.909 7.297 5.773 7.063
% GDP (0,4%) (0.5%) (0.5%) (0.4%) (0.2%) (0.2%) (0.3%)
Cessantia 1.400 200 1.400 700 1.600 600 900
% GDP (0.05%) (0.05%) (0.02%) (0.05%) (0.02%) (0.03%)
Univ H. Care 200.062 204.051
% GDP (5.9%) (5.7%)
Total 17.479 179.558 198.251 190.960 171.270 383.996 399.717
% GDP (6.5%) (6.0%) (6.4%) (5.7%) (5.0%) (11.2%) (11.1%)
EXPENDITURES/ENTITLEMENTS
Old age 102.690 110.954 113.501 117.205 127.232 128.187 130.724
% GDP (3.7%) (3.7%) (3.7%) (3.5%) (3.7%) (3.8%) (3.6%)
Survivors 8.591 9.269 9.322 9.983 10.211 10.266 9.698
% GDP (0.3%) (0.3%) (0.3%) (0.3%) (0.3%) (0.3%) (0.3%)
Sickness 48.315 55.317 51.968 56.582 12.947 12.178 15.845
% GDP (1.8%) (1.8%) (1.7%) (1.7%) (0.4%) (0.4%) (0.4%)
Work accident 6.413 4.563 4.473 4.654 2.649 2.395 2.700
% GDP (0.2%) (0.2%) (0.1%) (0.1%) (0.1%) (0.1%)
Cessantia 500 600 500 700 900 900 900
% BBP (0.02%) (0.02%) (0.02%) (0.02) (0.03%) (0.03%) (0.02%)
Univ, H.Care 245.366 249.102
(8.9%) (9.1%)
% GDP
Welfare check 20.022 19.567
% GDP (0.6%) (0.5%)
Total 166.509 180.703 179.764 189.824 153.939 419.314 428.536
% GDP (6.1%) (6.1%) (5.9%) (5.7%) (4.5%) (12.3%) (11.9%)
Bron: Algemeen Verslag van de directeur van het U.O. AZV over het boekjaar 2005; ILO 2005; Government Sector Account,
CBS Aruba, 2005.In addressing the present state of the Aruban social protection and the challenges it faces, I will refer next to the two most important social insurance programs, namely, the national universal healthcare insurance scheme and the general old age pension scheme, both which are critical for the welfare of the local elderly population. Social protection has been perceived in Aruba in general as a matter of citizens’ right. The absence of the present social protection programs is unimaginable. But it is also eminent that we face important challenges due to the changing demographic, epidemiological and economic realities. For example, when the old age pension scheme was designed and implemented in 1960, we had an industrial-based economy as opposed to the present tourism driven economy, a young population structure and a population size that was about 50% smaller. Moreover, the population is ageing rapidly. The population of 60 years old and over has grown in absolute terms with 47% between 1991 and 2000 comprising 11,2% of the total population in 2000. By the year 2018, one out of every five residents will be an older individual and by 2023 there will be more older persons than children under the age of 15 years old. General Old Age Pension Next I will elaborate a bit more on the old age pension’s scheme. The old age pension insurance is a (partially funded) PAYG non-contributory scheme. The present retirement age is 60. Its coverage is estimated around 95% and is the only income for more than two third of the population age 60 and over. At present time, the individual pension amounts to an equivalent of US$. 550 and the pension for a married couple equals US$ 927. Periodic indexations maintained a rather favourable individual pension benefit to minimum wage ratio of around 70% in passing years. The legal contributions paid by both employers (8.25%) and employees (3.25%) are collected on the basis of wages and there are flat benefits for everyone independent of contributions paid. The self-employed do contribute on basis of their profits. According to a report by the International Labour Organization (ILO) issued in 2005, this financial logic is, on the long term, in danger of violating the principle of equivalency between contributions paid and benefits received. Hence, the concerned report recommended the government to consider introducing a component on top of the existing scheme in order to provide additional old-age pension income based on individual (additional) contributions. Within this context, it should be noted that an important recent development has occurred. In the year 2005 the legal framework that allows the civil-workers’ pension scheme to introduce a voluntary-based second-tier contributory pension program for non-civil workers, has been formalized. At present time, the majority of the workers in Aruba are not covered by a second-tier pension. It should also be noted at this point that according to calculations made in a recent actuarial report by ILO in 2004, the Old Age Pension/survivors funds’ reserves will be exhausted by 2025 if no corrective measures are taken. In this light, the ILO report recommended further the following steps as the most efficient within a given scenario: (Slide 6)
-   increase normal retirement from age 60 to 62;
       -   Individualization of the pension (it is now based on one working head of
           household in a conventional nuclear family);
       -   Increase the legal contribution rate gradually from 12.5% to 16.5%. The latter
           is based on indexation through the national average wage index as opposed
           the presently applied consumer price index method. This is proposed to
           provide pension coupled to the real economic development instead of just
           maintaining purchasing power of the elderly. The same is applicable to the
           minimum wage and the insured wage ceiling.

The growing misbalance in solidarity mentioned earlier is evident both for the old-age
pension and the universal healthcare scheme. This pattern is worrisome considering
the expanding tourist-based economy is producing mostly relatively low added value
jobs. The paying jobs, particularly for women, are concentrated at or around the
minimum wage level (see graph 2). – Slide 7 -

Graph 2: Income distribution for the year 2005

25.00

20.00

15.00

10.00

5.00

SLIDE 7
0.00
  7501,2501,550
              1,8502,150
                       2,4502,7503,050
                                     3,3503,650
                                              3,9504,2504,550
                                                            4,8505,1505,450
                                                                          5,7506,050
                                                                                   6,3506,6506,950
                                                                                                 7,2507,5507,8508,150
                                                                                                                    8,4508,7509,050
                                                                                                                                  9,350
                                                                                                                                      9,6509,950

                                                                 Mannen               Vrouwen

From the data in the next slide/table 3 we learned that in the national healthcare
insurance scheme, almost six out of every 10 economic active residents require
some subsidies in 2005. In terms of the old age pension’s program, about half of the
7workers would receive more benefits than they contributed to the funds, therefore
requiring some solidarity. This situation is the reverse of the expected. A scenario
where 60% helps pay for the remaining 40% is deemed an adequate solidarity
support ratio. (Slide 8)
Table 4 Breakeven-point of the Universal Healthcare Insurance (UHI) and Old-
age pension: extent of required solidarity in practice (2005)
Fund BEP ( Afl.) %
NHI 2.650 58.6
Old Age 2.150 48.2
TOTAL 2.450 54.7
As a result, the government’s subsidies to the funds will have to increase if
everything remains equal, jeopardizing the sustainability of the respective funds as it
would place further strain on an already stretched out public budget.
(Slide 9)
Table 5 Mix of Financing Mechanisms and Health Services in Aruba
SERVICES-ACTIVITIES FINANCING
Public health- disease control, Taxes
health promotion
Ambulatory care – preventive and Taxes, Univ. health insurance, Out of
curative the pocket
Hospital care Univ. health insurance,
Complementary private health
insurance
Institutional long-term care Taxes and Out of the pocket
Drugs and diagnostics Universal health insurance,
Complementary private health
insurance, Out of the pocket
Research and training Taxes, Grants, Out of the pocket
National Healthcare Insurance (NHI):
Subsequently, I will explain some aspects of the universal national healthcare
insurance scheme, which was introduced in 2001. This scheme applies a flat rate
irrespective of age or health condition. The scheme covers a basic package of mostly
curative medical and paramedical services and benefits, medications and aids. Long-
term care is financed mainly through public subsidies.
In all, the proportion covered by public revenues of the total NHI’s costs during the
period of 2001-2006, reached a high of 62.5% in the year 2002 and a low of 34.7% in
the year 2006. This occurred through recurrent annual grants and respective
supplementary budgetary support to cover the program’s deficit. It aims to be a self-
supporting and risks spreading scheme, but is being financed through general tax
revenues, grants and contributory solidarity. It is therefore, contended to be a quasi-
insurance scheme.(Slide 9)
Table 6 : Mix of Financing Mechanisms and Health Services in Aruba
SERVICES-ACTIVITIES FINANCING
Public health- disease control, health Taxes
promotion
Ambulatory care – preventive and curative Taxes, Univ. health insurance, Out of the
pocket
Hospital care Univ. health insurance, Complementary
private health insurance
nstitutional long-term care Taxes and Out of the pocket
Drugs and diagnostics Universal health insurance,
Complementary private health insurance,
Out of the pocket
Research and training Taxes, Grants, Out of the pocket
According to the data of the National Health Account 2001-2004, the total healthcare
expenditure per capita in 2004 was US$ 1,914. For the sake of comparison, Spain’s
per capita healthcare expenditure was US$1.556 in 2001, Netherlands
SLIDE 10
Some important advantages of the NHI scheme include:
• broad non contributory coverage,
• more transparency in terms of healthcare expenditures,
• enhanced accessibility to healthcare by the needy, foreigners and the elderly,
• more targeted funds for healthcare,
• provides a mechanism for cost control,
• more choices for the patients and better incentives for the providers of
healthcare.
To conclude, I argue that we are in pressing need to critically evaluate and adapt the
present schemes to the present economic structure and demographic developments
in order to maintain the present level of coverage and quality of services and benefits
rendered.Table 6: Types of entitlement programs by mandate, benefits and coverage
Type of entitlement Objective/mandate Narrative and coverage per 2003
Compulsory not- Is designed to provide a safety net Contributions paid by both employers and
contributory old age for (guaranteed) income in third employees are collected on the basis of wages
pensions (social security). age. It is a compulsory pension Contrib. rate: Employer 8,25%, Employee
insurance for all residents. 3,25%.
Contributions paid by both employers and
employees are collected on the basis of wages
Total coverage per 31 December 2003: 63.733
insured and 10.640 beneficiaries
Maximum entitlement: Individual: Afl. 900
Couple: Afl. 1,500 (In 2007: Afl. 990 and 1668)
Compulsory The compulsory survivors’ pension Contr. rate: Employer: 1,25%, Employee: 0,75%.
survivors’/bereavement protects the total population against Total insured population per 31 December
benefits lost of income due to the passing of 2003: 83.414
(social security). a married partner or parent(s) via Beneficiaries: 1.309
the provision of a basic income. Entitlement: Widow(er): Afl.438 – 758 (2007)
Orphan: Afl.316 - 446 (2007)
Insurance against sickness This insurance scheme is The employer pays the annual insurance’s
(employees’ insurance) compulsory for those employed i premium. The employee has right to income
the private sector (and registered by protection up to a maximum period of two years.
the Social Insurance Bank) and Premium: Employer 4,0%, Employee 0%.
whose employers do not provide Total insured population per 31 December
similar insurance coverage, up to a 2003: 29.310.
stipulated income category (Afl. )
It protects against loss of income as
result of sickness invalidity during a
limited period of time.
The employer pays an annual premium in
Insurance against work- It aims to protect all employees in accordance to the risk factor of the type of work
related disability/ the private sector earning up to a that the employee is exercising. The employee is
employment injury benefit certain annual wage against loss of entitled to work-related disability compensation as
(employees’ insurance) income as result of work-related long as the injuries suffered limit his/her working
accident. again.
Premium: Employer 0,7% at average. Employee:
0%.
Total population insured per 31 December
2003: 38.377.
The employer pays an annual premium to the
Cessantia (Employees’ The objective of the so-called Social Security Bank.
nsurance) Cesantia program is to compensate Premium: Employer: Afl. 40 per year for each
the workers in the private sector employee.
who lost their jobs due to reasons Total insured population per 31 December
beyond their control (i.e. company 2003: 34.423
went bankrupt, etc.). it is in the form Total beneficiaries: 59.
of a lump sum based on the number
of years of service rendered.
This compulsory program insures The premium is partly paid by the employer and
Universal Healthcare all residents against (curative) the employee..
Insurance (Social security) medical costs and medications. It Premium: Employer: 6,5%, Employee: 1,0
seeks to meet the following % (as of 2007 7,5% and 1.0%)
objectives:: (1) guarantee Independents (including pensioners) pay 7.5%
accessibility to medical care, (2) Total coverage: Per 31 December 2003 were
qualitative medical car, (3) circa 96.105 persons insured.
uniform/centralized processing of
the concerned costs and (4) cost
curtailing or management.
One US$ = Afl. 1,80You can also read