Does Relative Deprivation Condition the Effects of Social Protection Programs on Political Support? Experimental Evidence from Pakistan - World ...
←
→
Page content transcription
If your browser does not render page correctly, please read the page content below
Does Relative Deprivation Condition the Effects of
Social Protection Programs on Political Support?
      Experimental Evidence from Pakistan

        Katrina Kosec (IFPRI and Johns Hopkins University)
       Cecilia Hyunjung Mo (University of California, Berkeley)

               Annual Bank Conference on Development Economics
                                  June 2021

Kosec and Mo (2021)                                              June 2021   1 / 20
Introduction

Research Question

   Why might citizens fail to reward policymakers for providing targeted
   social protection?

   Kosec and Mo (2021)                                       June 2021   2 / 20
Introduction

Research Question

   Why might citizens fail to reward policymakers for providing targeted
   social protection?
   Does perceived income inequality moderate the relationship between
   social protection and political support?

   Kosec and Mo (2021)                                       June 2021   2 / 20
Introduction

Motivation

   Economic trend: while income inequality across countries is declining,
   there has been a simultaneous rise in income inequality within
   countries—particularly in the developing world (Ravallion 2014)

   Kosec and Mo (2021)                                       June 2021   3 / 20
Introduction

Motivation

   Economic trend: while income inequality across countries is declining,
   there has been a simultaneous rise in income inequality within
   countries—particularly in the developing world (Ravallion 2014)
   Political trend: governments are increasingly addressing poverty
   through social protection programs, including cash transfers (Fiszbein
   et al. 2009; Garcia and Moore 2012; Beegle et al. 2018)
   Mixed literature on how social protection affects political attitudes
          ↑ support for government: Diaz-Cayeros et al. 2009; Chen 2013;
          Manacorda et al. 2011; Pop-Eleches and Pop-Eleches 2012; Labonne
          2013; De La O 2013; Blattman et al. 2018; Conover et al. 2018;
          Evans, Holtemeyer, and Kosec 2019

   Kosec and Mo (2021)                                          June 2021    3 / 20
Introduction
Motivation
Economic trend: while income inequality across countries is declining,
there has been a simultaneous rise in income inequality within
countries—particularly in the developing world (Ravallion 2014)
Political trend: governments are increasingly addressing poverty
through social protection programs, including cash transfers (Fiszbein
et al. 2009; Garcia and Moore 2012; Beegle et al. 2018)
Mixed literature on how social protection affects political attitudes
↑ support for government: Diaz-Cayeros et al. 2009; Chen 2013;
Manacorda et al. 2011; Pop-Eleches and Pop-Eleches 2012; Labonne
2013; De La O 2013; Blattman et al. 2018; Conover et al. 2018;
Evans, Holtemeyer, and Kosec 2019
Null or negative impacts: Green 2006; Ellis and Faricy 2011; Correa
and Cheibub 2016; Imai, King, and Velasco Rivera (2020); Lyall, Zhou,
and Imai (2020)
Literature Review
Kosec and Mo (2021) June 2021 3 / 20Introduction Background Classic economic voting theory: Citizens reward the government for good economic outcomes and punish it for bad ones (e.g., Nadeau, Belanger, and Didier 2013; Lewis-Beck, Nadeau, and Foucault 2013) Kosec and Mo (2021) June 2021 4 / 20
Introduction

Background

   Classic economic voting theory: Citizens reward the government for
   good economic outcomes and punish it for bad ones (e.g., Nadeau,
   Belanger, and Didier 2013; Lewis-Beck, Nadeau, and Foucault 2013)

   Existing explanations for selective increases in support for government
   following social protection (mixed findings):
      1   Attribution challenges
      2   Partisan targeting
      3   Timing and duration

   Kosec and Mo (2021)                                        June 2021   4 / 20
Introduction Our Hypothesis Behavioral economics, sociology, and psychology: reference points (Kahneman and Tversky 1979; Levy 2003; Bendor 2010), which are affected by perceived relative welfare, influence attitudes toward both the state (Healy et al. 2017) and non-state actors (Fair et al. 2018) Kosec and Mo (2021) June 2021 5 / 20
Introduction

Our Hypothesis

   Behavioral economics, sociology, and psychology: reference points
   (Kahneman and Tversky 1979; Levy 2003; Bendor 2010), which are
   affected by perceived relative welfare, influence attitudes toward both
   the state (Healy et al. 2017) and non-state actors (Fair et al. 2018)

   We argue: citizens’ perceptions of their relative economic position
   moderate the effects of social protection on attitudes:
          When a citizen does not feel relatively deprived, social protection has
          minimal sustained effect on attitudes toward government
          Relative deprivation being salient causes beneficiaries to increase
          support for government, and non-beneficiaries to feel politically
          disgruntled

   Kosec and Mo (2021)                                                 June 2021   5 / 20
Introduction
Benazir Income Support Program (BISP)
Stated Goals: (1) eradicate extreme poverty; (2) empower women; and (3)
achieve universal primary education by providing unconditional cash
transfers to poor women (Ambler and De Brauw 2019)
Oct. 2010 – Dec. 2011: Poverty census carried out to identify
prospective beneficiaries
Jul. 2011: Use of wealth scores to distribute transfers begins
Kosec and Mo (2021) June 2021 6 / 20Empirical Strategy
Data
Administrative Data: Benazir Income Support Program (BISP)
Database
Poverty score and eligibility dummy for the BISP, Pakistan’s national
unconditional cash transfer program
Matched with our survey data on CNIC (national identity card) number
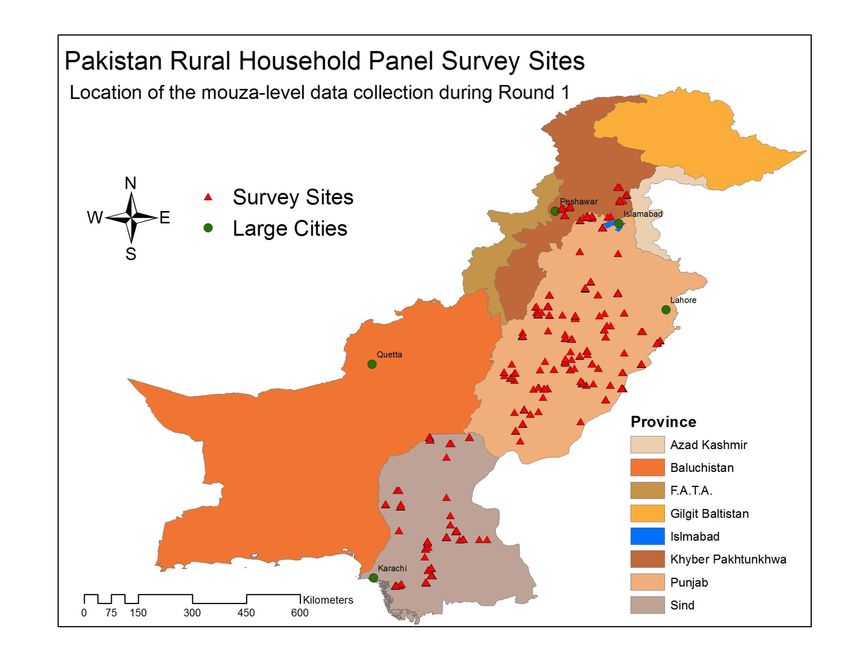
Household Survey Data: Pakistan Rural Household Panel Survey,
Round 2, April–May 2013
Governance module: survey experiment + seven questions about
support for/ satisfaction with Pakistani government
76 rural villages in Punjab, Sindh, and Khyber-Pakhtunkhwa (KPK)
N = 2,639 (that overlaps with the administrative data)
Kosec and Mo (2021) June 2021 7 / 20Empirical Strategy Map of Household Survey Villages (N=76) Kosec and Mo (2021) June 2021 8 / 20
Empirical Strategy

Identification of Effects of the BISP: Fuzzy Regression
Discontinuity Design (RDD)

Need to overcome selection bias.
    Exploit a threshold rule in the BISP selection process
           Assignment Variable X : Wealth Score
           Cutoff c: Standardized to be 0 (cutoff = 16.17)
           Treatment Receipt D = 1[X ≥ c ∗ ]

    Kosec and Mo (2021)                                      June 2021   9 / 20
Empirical Strategy
Identification of Effects of the BISP: Fuzzy Regression
Discontinuity Design (RDD)
Need to overcome selection bias.
Exploit a threshold rule in the BISP selection process
Assignment Variable X : Wealth Score
Cutoff c: Standardized to be 0 (cutoff = 16.17)
Treatment Receipt D = 1[X ≥ c ∗ ]
Fuzzy rather than sharp cutoff because households could appeal and
receive transfers if their score was between 16.17 and 21.17 and the
household had:
at least one disabled member;
at least one senior citizen (65 years of age or older) and less than three
total household members; or
have four or more children under age 12
Kosec and Mo (2021) June 2021 9 / 20Empirical Strategy
First Stage Results
1
BISP Beneficiary Rate
.5
0
-2 0 2 4 6
Wealth Score
Sample average within bin Polynomial fit of order 4
Notes: β = 0.593 (p < 0.001).
Kosec and Mo (2021) June 2021 10 / 20Empirical Strategy
Balance on Pre-Treatment Characteristics
Social Status
Female
Age 18−25
Age 25−35
Age 35−45
Age 45−55
Married
Dependent Variable
Received Primary Education
Received Intermediate Education
Received Secondary Education
Received Post−Secondary Education
Mother's Years of Education
Father's Years of Education
Punjabi
Sairaiki
Sindhi
Other Ethnicity
CNIC Unfair
−0.5 0.0 0.5 1.0 1.5
Difference at the Cutoff
Notes: The 95 percent (two-tailed) confidence intervals surround point estimates.
Kosec and Mo (2021) June 2021 11 / 20Empirical Strategy
Experiment: Poverty Prime
“Annual income is the amount of CASH income you earn from all
agricultural and non-agricultural activities, and money from Benazir
Income Support Programme (BISP) or other programs. How much
income did your family earn last month?”
Individuals are asked to select their income level from one of five
brackets (50 percent of individuals are in each of two groups):
Control Group Relatively Poor Group
(No Poverty Prime) (Poverty Prime)
0-2,000 Rs. 0-12,500 Rs.
2,001-4,000 Rs. 12,501-25,000 Rs.
4,001-6,000 Rs. 25,001-45,000 Rs.
6,001-10,000 Rs. 45,001-60,000 Rs.
More than 10,000 Rs. More than 60,000 Rs.
Baseline Test: Relative Poverty Prime Assignment Baseline Characteristics at Threshold by Prime
Distribution
Kosec and Mo (2021) June 2021 12 / 20Empirical Strategy
Key Outcome Measure: Government Support Index (GSI)
Index of seven questions (Cronbach’s alpha score = 0.88), which we
will call the Government Support Index (GSI):
To what extent to you ...
... think the courts in Pakistan guarantee a fair trial?
... respect the political institutions of Pakistan?
... think citizens’ basic rights are protected by the political system of
Pakistan?
... proud of living under the political system of Pakistan?
... think that one should support the political system of Pakistan?
... trust the political system of Pakistan?
... feel your leaders are doing the best job possible for Pakistanis?
Answer Choices: 0 (Not at all), 0.25 (A little), 0.5 (Somewhat), 0.75
(A lot), and 1 (A great deal)
Kosec and Mo (2021) June 2021 13 / 20Results
Manipulation Check: Effect of BISP on Economic Welfare
2SLS Robust p-value Obs.
Total Food Expenditures per Month (Rupees) 2,596*** 0.003 2,610
Total Expenditures per Month (Rupees) 3,107.5** 0.014 2,610
Cash Loans as Share of Yearly Expenditure -0.109*** 0.001 2,639
Total Savings as a Share of Monthly Expenditure 0.403** 0.016 2,610
Household Earns Income from Outside Agriculture 0.382*** 0.000 2,608
Notes: Standard errors appear in parentheses. * pResults
Effect of BISP on Government Support
2SLS Robust p-value Obs.
Government Support Index 0.080* 0.134 2,636
Courts Guarantee Fair Trial 0.125* 0.088 2,637
Respect for Political Institutions 0.104* 0.151 2,637
Citizens’ Basic Rights Protected 0.116** 0.058 2,636
Proud of Political System 0.008 0.932 2,636
Others Should Support Political System 0.038 0.501 2,637
Trust Leaders 0.072 0.303 2,637
Leaders Doing the Best Job Possible 0.096 0.224 2,637
Notes: Standard errors appear in parentheses. * pResults
Effect of BISP on Attitudes Toward Government by
Poverty Prime (2SLS)
BISP, Poverty Prime BISP, No Poverty Prime
Coefficient Robust p-value Obs. Coefficient Robust p-value Obs.
Government Support Index 0.155** 0.021 1,303 0.015 0.791 1,333
Courts Guarantee Fair Trial 0.203** 0.045 1,303 0.034 0.819 1,334
Respect for Political Institutions 0.196** 0.035 1,303 -0.002 0.911 1,334
Citizens’ Basic Rights Protected 0.195** 0.036 1,303 0.042 0.715 1,333
Proud of Political System 0.117 0.270 1,303 -0.064 0.679 1,333
Others Should Support Political System 0.118 0.177 1,303 -0.023 0.904 1,334
Trust Political System 0.116 0.283 1,303 0.050 0.507 1,334
Leaders Doing the Best Job Possible 0.155* 0.121 1,303 0.061 0.630 1,334
Notes: Standard errors appear in parentheses. * pResults
Effect of BISP on Attitudes Toward Government by
Perceived Income Standing Pre-Treatment Among Primed
Individuals (2SLS)
Didn’t Feel Relatively Poor Pre-Treatment Felt Relatively Poor Pre-Treatment
Coefficient Robust p-value Obs. Coefficient Robust p-value Obs.
Government Support Index 0.239*** 0.001 758 -0.047 0.505 545
Courts Guarantee Fair Trial 0.159 0.151 758 0.042 0.879 545
Respect for Political Institutions 0.345*** 0.000 758 -0.079 0.467 545
Citizens’ Basic Rights Protected 0.258** 0.012 758 0.008 0.803 545
Proud of Political System 0.196* 0.061 758 -0.017 0.767 545
Others Should Support Political System 0.225** 0.016 758 -0.044 0.754 545
Trust Political System 0.215** 0.025 758 -0.120 0.447 545
Leaders Doing the Best Job Possible 0.284*** 0.009 758 -0.145 0.312 545
Notes: Standard errors appear in parentheses. * pResults Which Group is Being Affected by the Poverty Prime? The group that got the BISP (feeling relatively poor means the BISP buys even more of their support)? Or Kosec and Mo (2021) June 2021 18 / 20
Results

Which Group is Being Affected by the Poverty Prime?

       The group that got the BISP (feeling relatively poor means the BISP
       buys even more of their support)? Or
       The group that did not get the BISP (feeling relatively poor means
       that not getting the BISP stings / generates anger toward
       government even more)?

                                           Estimates to Left of Cutoff (Eligible)        Estimates to Right (Ineligible)
 Variable                             µnotprimed     µprimed        Difference      µnotprimed    µprimed         Difference

 Government Support Index               0.371         0.388            0.017          0.360         0.300          -0.060
 Courts Ensure Justice                  0.439         0.428           -0.010          0.415         0.314          -0.101
 Respect for Political Institutions     0.501         0.507            0.006          0.502         0.397          -0.105
 Citizens’ Basic Rights Protected       0.414         0.401           -0.013          0.386         0.292          -0.094
 Proud of Political System              0.334         0.368           0.034           0.378         0.302          -0.075
 Support of Political System            0.355         0.383            0.028          0.371         0.317          -0.054
 Trust Leaders                          0.313         0.338            0.026          0.279         0.273          -0.006
 Leaders Doing Best Job Possible        0.240         0.295           0.055           0.198         0.207          0.009
 Source: Pakistan Rural Household Panel Survey (RHPS), Round 2 (2013) and Benazir Income Support Program Database
 (2013).

      Kosec and Mo (2021)                                                                                   June 2021       18 / 20
Conclusions Conclusions We use a quasi-experiment (RDD) to assess the impact of a social protection program in Pakistan on support for government We overlay a survey experiment that made half of the sample feel relatively poor and like the distribution of income is relatively wide Kosec and Mo (2021) June 2021 19 / 20
Conclusions

Conclusions
   We use a quasi-experiment (RDD) to assess the impact of a social
   protection program in Pakistan on support for government
   We overlay a survey experiment that made half of the sample feel
   relatively poor and like the distribution of income is relatively wide
   We find that:
          Citizens’ evaluations of government can be altered by social protection
          programs
          Reactions to the provision of social protection are sensitive to
          individual beliefs about their own relative poverty level

   Kosec and Mo (2021)                                              June 2021   19 / 20
Conclusions
Conclusions
We use a quasi-experiment (RDD) to assess the impact of a social
protection program in Pakistan on support for government
We overlay a survey experiment that made half of the sample feel
relatively poor and like the distribution of income is relatively wide
We find that:
Citizens’ evaluations of government can be altered by social protection
programs
Reactions to the provision of social protection are sensitive to
individual beliefs about their own relative poverty level
Has important implications for our understanding of the political
ramifications of rising inequality, and how positive overall effects of
social protection programs on trust in government should be
interpreted
Kosec and Mo (2021) June 2021 19 / 20Conclusions
Thank you
Katrina Kosec
Interntional Food Policy Research Institute
Johns Hopkins University
k.kosec@cgiar .org
Kosec and Mo (2021) June 2021 20 / 20Appendix
Balance Test: Relative Poverty Prime Assignment
Demographic (3) Difference (4) Test of Balance
(1) µNotPrimed (2) µPrimed
Characteristic in Means (P-Value)
Social Status 4.084 4.012 -0.072 0.238
Female 0.505 0.504 -0.001 0.924
Age 18-25 0.105 0.107 0.002 0.869
Age 25-35 0.254 0.260 0.006 0.663
Age 35-45 0.252 0.243 -0.009 0.520
Age 45-55 0.208 0.218 0.01 0.447
Married 0.897 0.899 0.002 0.874
Received Primary Education 0.159 0.151 -0.008 0.472
Received Intermediate Education 0.077 0.067 -0.01 0.238
Received Secondary Education 0.104 0.108 0.004 0.698
Received Post-Secondary Education 0.018 0.015 -0.003 0.462
Mother’s Years of Education 0.171 0.174 0.003 0.919
Father’s Years of Education 1.009 1.034 0.025 0.780
Punjabi 0.359 0.364 0.005 0.738
Sairaiki 0.209 0.219 0.01 0.448
Sindhi 0.131 0.113 -0.018 0.098
Other Ethnicity 0.301 0.304 0.003 0.880
CNIC Unfair 0.225 0.233 0.008 0.612
Proportion 0.501 0.499 . .
Notes: For each of the observable demographic characteristics, Columns (1) and (2) report means by the exper-
imental condition. Column (3) reports the difference in means (µPrimed -µNotPrimed ), and Column (4) reports
the p-value when conducting a difference in means test by experimental condition. The proportion row indicates
what share of the total sample was assigned to each of the two conditions.
Experiment: Poverty Prime
Kosec and Mo (2021) June 2021 1/7Appendix
RD Estimate by Bandwidth Selection Procedure
(1) (2) (3)
Bandwidth Selection Procedure Full Sample No Poverty Prime Poverty Prime
(a) MSE-Optimal Bandwidth 0.080* 0.015 0.155**
(Calanico, Cattaneo, and Titiunik 2014) (0.044) (0.072) (0.065)
(b) MSE Minimizing Bandwidth 0.077 0.007 0.152**
(Imbens and Kalyanaraman 2011) (0.051) (0.048) (0.065)
(c) 1/2 the MSE Minimizing Bandwidth 0.071 -0.005 0.108
(Imbens and Kalyanaraman 2011) (0.067) (0.068) (0.086)
(d) 2X the MSE Minimizing Bandwidth 0.064* 0.015 0.093**
(Imbens and Kalyanaraman 2011) (0.036) (0.033) (0.043)
N 2636 1333 1303
Notes: Standard errors are in parentheses, and * pAppendix
Attitudes Toward Government by Poverty Prime
Effect of BISP by Poverty Prime
Kosec and Mo (2021) June 2021 3/7Appendix
Attitudes Toward Government by Perceived Income
Standing Pre-Treatment Among Primed Individuals
Effect of BISP by Perceived Income Standing Pre-Treatment
Kosec and Mo (2021) June 2021 4/7Appendix
Baseline Pre-Treatment Characteristics at Threshold by
Poverty Prime
Poverty prime sample No poverty prime sample
Social Status Social Status
Female Female
Age 18−25 Age 18−25
Age 25−35 Age 25−35
Age 35−45 Age 35−45
Age 45−55 Age 45−55
Married Married
Dependent Variable
Dependent Variable
Received Primary Education Received Primary Education
Received Intermediate Education Received Intermediate Education
Received Secondary Education Received Secondary Education
Received Post−Secondary Education Received Post−Secondary Education
Mother's Years of Education Mother's Years of Education
Father's Years of Education Father's Years of Education
Punjabi Punjabi
Sairaiki Sairaiki
Sindhi Sindhi
Shina Shina
Pakhtoon Pakhtoon
0 1 2 −1 0 1
Difference at the Cutoff Difference at the Cutoff
Experiment: Poverty Prime
Kosec and Mo (2021) June 2021 5/7Appendix
Attitudes Toward Government by Perceived Income
Standing Pre-Treatment Among Primed Individuals
No poverty prime Poverty prime
80
60
Percent
40
20
0
1 2 3 4 5 1 2 3 4 5
How much income did your family earn last month?
Histogram by poverty prime condition
Experiment: Poverty Prime
Kosec and Mo (2021) June 2021 6/7Appendix
Table A.1: Evidence Review of the E↵ect of Cash Transfer Programs on Political Attitudes
Author (Year) Country Context Dataset Population Gini Index Outcome(s) E↵ect
Lyall, Zhou, and Imai (2020) Afghanistan Pre-baseline enrollment form (2015), baseline survey (2015), Individuals who were young, 27.8 (2013) 1. Relative support for the Taliban versus the Mixed
and two endline surveys (2016) underemployed, displaced, and shared Afghan government
Pashtun ethnicity with the Taliban 2. Binary and frequency variables of violence
Pop-Eleches and Pop- Romania Gallup public opinion survey of program participants (2007), Comparable eligible and ineligible 28.2 (1994) 1. Dummy for voting Positive
Eleches (2012) Basic information about program participants (2005) applicants 2. Dummy for voting for the incumbent party
3. Trust in government
Bechtel and Hainmueller Germany Flood report (2002), State election and constituency data All voters 29.2 (1994) Vote share for the incumbent party Positive
(2011) (1994, 1998, 2002, 2005, 2009)
Lee, Jensen, Arndt, and United Kingdom Polling data for government support in United Kingdom British and Danish poll respondents 30.5 Mean percentage of support for governing parties Positive
Wenzelburger (2017) and Denmark (1946-2014) and Denmark (1957-2014)
Kweon (2018) 18 European European Social Survey (1999-2015) Representative sample of Europeans 30.7 Dummy for having voted for leftist parties Mixed
countries
Cole, Healy, and Werker India Election and rainfall data (1977-1999) Representative sample of Indian voters 32.1 (1983) Vote share for the ruling coalition Positive
(2012)
Healy and Malhotra (2009) United States Presidential election results, natural disaster, and government All voters 34.6 (1979) Presidential vote share for the incumbent party Positive
spending data (1984-2004)
Brazys, Heaney, and Walsh Malawi Malawian Welfare Monitoring Survey (2008), Election data All voters 39.9 (2004) Vote share for the incumbent party Positive
(2015) (2004, 2009)
Dionne and Horowitz (2016) Malawi Panel survey of rural Malawians (2008, 2010) Representative sample of rural 39.9 (2004) Dummy for supporting the incumbent party Positive
Malawians
Margalit (2011) United States Data of applications for compensation for trade-related job loss Representative sample of workers hurt 40.2 (1994) Change in Republican presidential vote share Positive
(1996-2004) by trade
Evans, Holtemeyer, and Tanzania Survey on beneficiaries and would-be beneficiaries (2009, 2011, Representative sample of rural 40.3 (2007) Dummy for trusting political leaders Positive
Kosec (2019) 2012) households with vulnerable children
and elderly individuals
Chen (2013) United States Data on hurricane disaster aid awards (2004), Election data Applicants to hurricane disaster aid 40.4 (2000) Voter turnout for the incumbent party Positive
(2002, 2004)
Clinton and Sances (2018) United States Dave Leips Atlas of US Presidential Elections (2010, 2012, Representative sample of residents in 40.4 (2010) 1. Voter registration Positive
2014, 2016) Medicare expansion and 2. Voter turnout
non-expansion states
Mettler and Stonecash United States Maxwell Poll (2005) Poll respondents 40.5 (2004) Voter turnout Mixed
(2008)
Labonne (2013) Philippines Precinct-level electoral data (2007, 2010), Poverty statistics All voters 41.5 (2003) Vote share for incumbent Positive
(2003, 2007)
Lü (2014) China Chinese Attitudes toward Inequality and Distributive Injustice Representative sample of rural and 42.1 (2002) 1. Trust in central government Positive
(2004, 2009) urban Chinese 2. Trust in local government
Marschall, Aydogan, and Turkey Mayoral election data (2004, 2009, 2014), Data of housing All voters 42.2 (2003) # of times ruling party won mayoral election Positive
Bulut (2016) projects (2003-2014) over last three elections
Manacorda, Miguel, and Uruguay Baseline and 2 follow-up survey amongst applicants for the Applicants to the cash transfer 42.4 (1989) Support for the current government Positive
Vigorito (2011) cash transfer program (2005-2008) program
Blattman, Emeriau, and Fi- Uganda Baseline and two follow-up survey (2008, 2010, 2012) Representative sample of applicants to 45.2 (2008) Index of presidential support Mixed
ala (2018) the program
Layton and Smith (2015) 24 countries in AmericasBarometer survey (2012) Representative sample of Latin 47.3 Dummies of voting for the incumbent in a Positive
Latin America Americans hypothetical voting
and Caribbean
Imai, King, and Ve- Mexico Presidential election data (2000, 2006), Baseline and follow-up Representative sample of poor 48.9 (1984) 1. Voter turnout in presidential election Null
lasco Rivera (2020) survey (2005, 2006) of the SPS program, Poverty data of Mexicans 2. Vote share of incumbent party
Progresa (1990, 1995)
De La O (2013) Mexico Precinct level election data (2000), Poverty data (1990, 1995) Representative sample of poor 48.9 (1984) 1. Voter turnout Positive
Mexicans 2. Vote share of the incumbent party
Linos (2013) Honduras Presidential and mayoral election data (1993-2005), Survey of All voters 51.8 (1992) 1. Vote share for incumbent mayor Positive
targeted municipalities (2000, 2002) 2. Vote share for incumbent president
Cerda and Vergara (2008) Chile Election data (1989, 1993, and 1999), Survey of Socioeconomic All voters 56.2 (1987) Vote share for the incumbent Positive
Characteristics of the Chilean Population (1990, 1992, 1998)
Conover, Zarate, Camacho, Colombia Electoral census and booth-level electoral results (2010), the All voters 57.2 (2001) 1. Turnout Positive
and Baez (2018) CCT’s management information system of beneficiaries 2. Vote share of incumbent party candidate
(2001-2010) 3. Margin of victory
Zucco (2013) Brazil National household survey on program enrollment (2000), All voters 59 (1999) 1. Vote share for incumbent Positive
Municipal election data (2002, 2006, 2010) 2. Vote share for incumbent party candidate
Notes: Papers are ordered according to the value of the Gini index for the study context (lowest to higher). The Gini index is taken from the first year in the data set used, the closest year that pre-dates the first year of the data set, or
the earliest year that the Gini index is available. For studies involving multiple countries, the Gini index is calculated by averaging the Gini indices of all countries.
Motivation
Kosec and Mo (2021) June 2021 7/7You can also read