Serving shoppers a little better every day - 8 April 2020 Dave Lewis - CEO Alan Stewart - CFO - Tesco PLC
←
→
Page content transcription
If your browser does not render page correctly, please read the page content below
Serving shoppers
a little better
every day.
8 April 2020

Dave Lewis – CEO
Alan Stewart – CFO
Agenda

• Full year results
• COVID-19 update
• Q&A

FY results.
Group performance

                     Sales1                                                   Profit2                                   Retail free cash flow3                                                   Dividend

Note: For UK & ROI our reported statutory performance is for the 53 weeks ended 29 February 2020. For all other operations, these results are for the calendar year ended 29 February 2020. To aid comparability,
headline results are shown on a 52 week basis.
1. Sales exclude VAT and fuel. Sales change shown at actual rates on a comparable days basis for Central Europe and Asia.
2. Operating profit before exceptional items and amortisation of acquired intangibles; change shown at actual rates.
3. Retail free cash flow excludes the impact of Tesco Bank.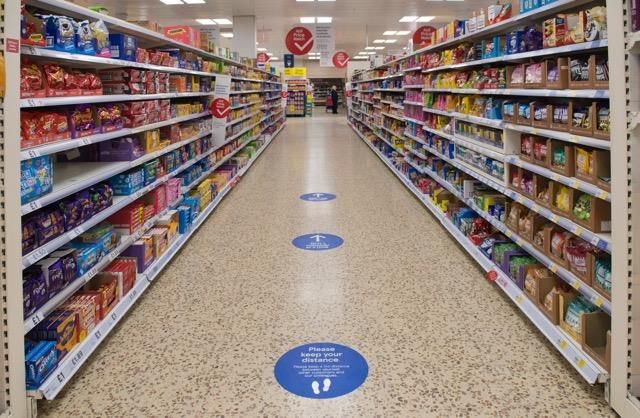
Segmental performance

                                                                                UK & ROI                    Central Europe    Asia     Total Retail   Tesco Bank

Sales1                                                                          £44,909m                       £5,332m       £5,218m   £55,459m        £1,068m
   change at constant exchange rates %                                              0.2%                        (10.1)%       0.1%       (0.9)%         (2.6)%

Operating profit2                                                                £2,184m                        £156m        £426m      £2,766m         £193m
   change at constant exchange rates %                                              16.9%                      (27.6)%       24.8%        13.9%         (3.0)%
   Margin (%)                                                                       4.2%                        2.8%          8.2%        4.4%          18.1%

1. Sales exclude VAT and fuel. Sales change shown on a comparable days basis for Central Europe and Asia.
2. Operating profit before exceptional items and amortisation of acquired intangibles.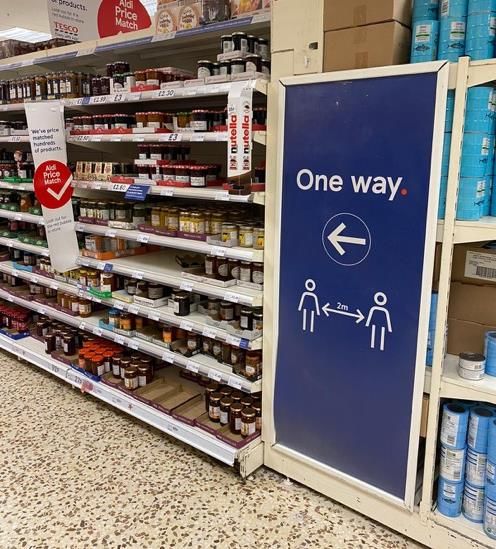
Retail performance

                            Sales:                                                                        Sales:                                                                        Sales:
                      +0.2%                                                                        (10.1)%                                                                         +0.1%

          Operating profit:                                                             Operating profit:                                                             Operating profit:
                     +16.9%                                                                       (27.6)%                                                                       +24.8%

                           UK & ROI                                                               Central Europe                                                                            Asia
Sales exclude VAT and fuel; change shown at constant rates on a comparable days basis for Central Europe and Asia. Operating profit before exceptional items and amortisation of acquired intangibles, change shown at constant rates.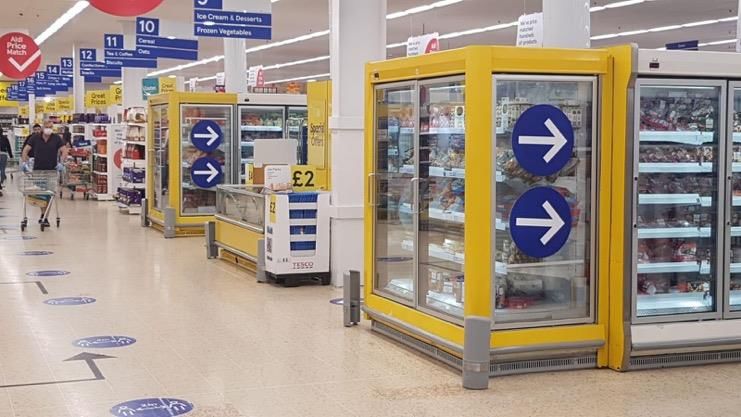
Booker

               EPS                                              Buying Optimise
Synergies accretive                                             Better  supply
 £207m    in second year       +£1.1bn       Completed         Together  chain
                                Sales         7 March
          ROIC                                                     Portfolio
     in excess of cost of
       capital in Year 2                                           of brands

 Merger benefits delivered   Best Food Logistics acquisition    Further opportunities
                                      completed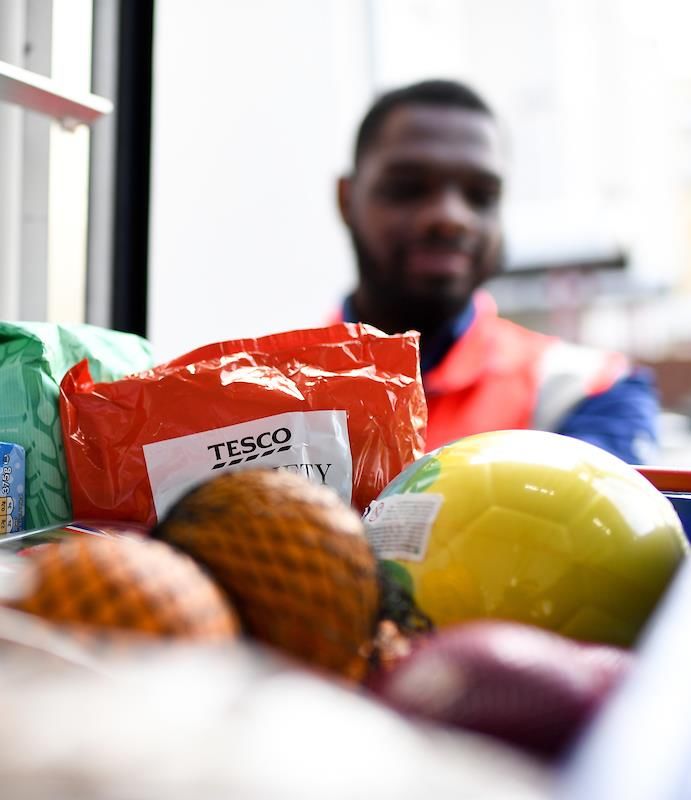
Tesco Bank
                                                                                       FY 19/20   Change
• Focus on simple banking and insurance       Lending to customers                     £8,451m     (32.0)%
  products for Tesco customers
                                                  Secured lending                         Nil       (100)%
  • Sale of mortgage portfolio completed
  • Current accounts closed to new                Unsecured lending                    £8,451m      (2.6)%
    customers
                                              Bad debt: asset ratio                      1.6%       (0.3)%
• Strong balance sheet, with a total
  capital ratio of 23.1%                      Operating profit pre exceptional items    £193m       (3.0)%

  • Capital adequacy under stress scenarios       Cost: income ratio                    53.7%        1.9%
                                                                                                  improvement
    regularly assessed
                                                  Net interest margin                    4.1%       0.3%
• Material impact from COVID-19
                                              Tier 1 capital ratio                      20.6%       4.4%
  • Reduction in income from all activities
  • Provisions for potential bad debts        Total capital ratio                       23.1%       4.8%

  • Likely to result in a loss in 2020/21
Sources and uses of cash

1. Exceptional cash items comprise £(197)m of restructuring activity (of which £(133)m relate to prior year activity), £(23)m integration costs and £(10)m corporate costs.
Liquidity and debt profile

• Significant cash liquidity available
• £3.0bn of committed facilities undrawn
• Investment grade credit ratings with all three agencies
• Re-paid £1.3bn of outstanding debt during FY19/20, including £0.5bn bonds repaid early
• Issued 6 year GBP £0.4bn (2.5%) and 6.5 year EUR €0.75bn (0.875%)

                                    5.500%/1.375%

                                                                 5.000%

                                                        6.125%
                                                                              2.500% & 0.875%                                                 6.150%
                                                                                 (New Issues)

                                               2.125%

                                                                                                   6.000%                            5.500%
                                                                                                                                                       4.875%

1. Amortising debt relating to purchase of Atrato Property JV now on balance sheet after obtaining full control in September 2019.
Total indebtedness
Total indebtedness1 Total indebtedness ratio2
TARGET
TARGET 3.0x to 2.5x
c.2.5x
1. Total indebtedness post-IFRS 16 comprises Net debt (inc. lease liabilities) plus the IAS 19 deficit in the pension schemes (net of tax).
2. Total indebtedness ratio pre-IFRS 16: Net Debt + defined pension deficit (net of tax) + discounted operating lease commitments / EBITDAR. Post-IFRS 16: Net Debt + defined pension deficit (net of tax) / EBITDA.
Periods FY 15/16 to FY 16/17 inclusive are presented on a pre-IFRS 16 basis with subsequent periods presented on a post-IFRS 16 basis.A simpler, stronger business
Central Europe:
£167m
£277m 58% 60%
proceeds
of £258m
proceeds
China JV disposal Realising value from property Increased freehold proportion1
1. Represents Group freehold ownership by value for FY18/19 and FY19/20.Proposed sale of businesses in Thailand & Malaysia • Proposed sale to CP Group: • $10.6bn enterprise value, hedged on announcement • Implies 12.5x EV/EBITDA multiple • Effective use of proceeds: • £2.5bn to eliminate pension funding deficit • c.£5bn special dividend • c.£0.5bn for general corporate purposes • Broadly cash flow neutral: • Loss of operating cash flow from businesses in Thailand and Malaysia • Offset by £260m benefit as pension deficit contributions cease
Guidance

Capex                                                                        £0.9bn-£1.2bn per annum
Net finance costs1                                                           Less than 4% of long-term debt per annum
Tax                                                                          Effective tax rate c.24% for 2020/21; c.21% over medium term
                                                                             Not taken option to defer VAT payments
Dividend                                                                     Full year dividend pay-out ratio of 50%
                                                                             Interim dividend 35% of prior year full year dividend
Debt metrics                                                                 Targeting leverage of c.2.5x Total indebtedness/EBITDA
Pension deficit contribution                                                 Payments cease following lump sum payment from Asia
                                                                             disposal
Asia segment                                                                 Treated as a discontinued operation for FY 2020/21
Note: All guidance assumes completion of disposal of Thailand and Malaysia businesses during 2H 2020, which is subject to shareholder and regulatory approval.
1. Before exceptional charges, IAS 19 net pension finance costs and IAS 39 fair value remeasurements.
Turnaround: customers
14/15 19/20 Change
Customer NPS1 10 29 +19 pts
Brand perception2 6.8 26.1 +19.3 pts
Quality perception3 12.2 27.4 +15.2 pts
Value perception3 6.1 21.0 +14.9 pts
1. Reflects % of fans minus critics answering the question “Based on your most recent experience, how likely is it that you would recommend this store to a friend or colleague?”
2. Based on YouGov Brand Index which is a score based upon 6 component questions covering quality, value, reputation and satisfaction; 12 week rolling data.
3. Reflects YouGov Brand perception measures of quality and value on a 12 week rolling basis.Turnaround: colleagues
14/151 19/201 Change
Great place to work2 70% 82% +12% pts
Great place to shop3 23 44 +21 pts
Inclusive culture4 73% 81% +8% pts
Engagement in purpose5 64% 86% +22% pts
1. 14/15 data based on our 2014 “What Matters to You” survey and 19/20 data based on our 2020 “Every Voice Matters” survey.
2. % of colleagues recommending Tesco as a great place to work.
3. The net promoter score for colleagues recommending Tesco as a great place to shop.
4. % of colleagues agreeing that “Treat people how we like to be treated is practiced at Tesco” (2014) and “I feel I can be myself at Tesco without fear of judgement” (2020).
5. % of colleagues agreeing that “I can see a clear link between my work and the Tesco vision” (2014) and “The link between my team’s work and Tesco’s purpose is clear” (2020).Turnaround: suppliers
14/15 19/20 Change
Overall satisfaction1 55% 80% +25% pts
Simple, transparent and easy
36% 71% +35% pts
to deal with1
Treats me fairly1 55% 82% +27% pts
1. Reflects % of suppliers responding positively to the statements, “Overall satisfaction of working with Tesco”, “Tesco is simple, transparent and easy to deal with”, “Tesco treats me fairly”, as part of the Supplier Viewpoint survey.Turnaround: shareholders
14/151 19/201 Change
Operating profit2 £940m £2,959m +£2,019m
Free cash flow3 £(1,340)m £2,063m +£3,403m
Total indebtedness3 £(21.7)bn £(14.7)bn down 32%
Dividend 1.16p 9.15p +689%
Market capitalisation4 £13.7bn £23.2bn +£9.5bn
1. These figures reflect Tesco’s performance based on accounting standards applicable at the time of publication. Korea was first classified as a discontinued operation during FY15/16 and Turkey during FY16/17.
Booker was consolidated from FY18/19.
2. Group operating profit before exceptional items and amortisation of acquired intangibles.
3. Free cash flow and total indebtedness exclude the impact of Tesco Bank.
4. Market capitalisation as at the end of 1H 2014/15 and end of 1H 2019/20.Looking ahead • Strong operational and financial position to deal with COVID-19 challenges • Initial plan: • 2020/21 to be a year of investment • Profit shape to be more weighted to 2H • Current view: • Increased level of uncertainty due to COVID-19 • Range of scenarios and potential outcomes
Summary

• Strong financial performance in FY 19/20
• Robust liquidity and funding position
• Continuing to operate within capital allocation framework
• Proposed sale of businesses in Thailand and Malaysia1
• Well-placed in the short-term to support colleagues and customers, and in the long-term, to
  reinvest into the customer offer

1. Subject to shareholder and regulatory approval.
COVID-19.
Initial impact – sales shape
Food sales
   growth

                                First known   Government
                               UK domestic    issues ‘stay at
                               transmission   home’ guidance
Initial impact – stockpiling
Stockpiling driven by small % of customers Strongest sales uplift in virus epicentre
40%
70%
30%
20%
30%
10%
Customers Sales volume
Source: dunnhumby - measuring loyal customers who bought at least 20% more per week of stockpiled sub-groups than in a typical week, over weeks 1-4; and year-on-year sales growth by region for weeks 2-3.Initial impact – stockpiling
Sales
volume +119% +83%
6m
+76%
+115% +363%
4m +101%
2m
Typical week Stockpiling weekInitial impact – sales mix
Channels Products Booker
Stores Online Food Clothing GM Fuel Catering RetailScenarios – sales drivers
Further Longer-term
Base case restrictions restrictions
Stockpiling +
Shift from eating out of home + + +
Holiday cancellations + + +
GM/Clothing - - -
Fuel - - -Scenarios – sales shape
Government
issues ‘stay at
UK sales % home’ guidance
Week 1 Week 14 Week 27 Week 40 Week 52
Base case Further restrictions Longer-term restrictionsScenarios – UK costs
Further Longer-term
Base case restrictions restrictions
Payroll £(280)m £(335)m £(405)m
Distribution £(135)m £(155)m £(175)m
Store expenses £(105)m £(110)m £(200)m
Property £(65)m £(75)m £(80)m
Other (technology, communication) £(65)m £(65)m £(65)m
Total incremental costs £(650)m £(740)m £(925)m
Business Rates Relief
c.£585m c.£585m c.£585m
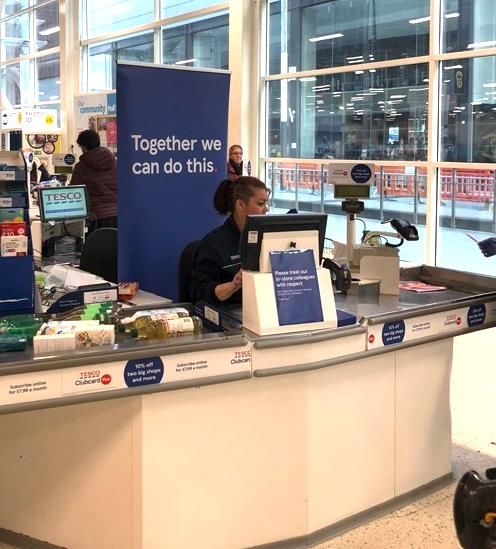
(England & Scotland)Together, we can do this
1 Food for all
2 Safety for everyone
3 Supporting our colleagues
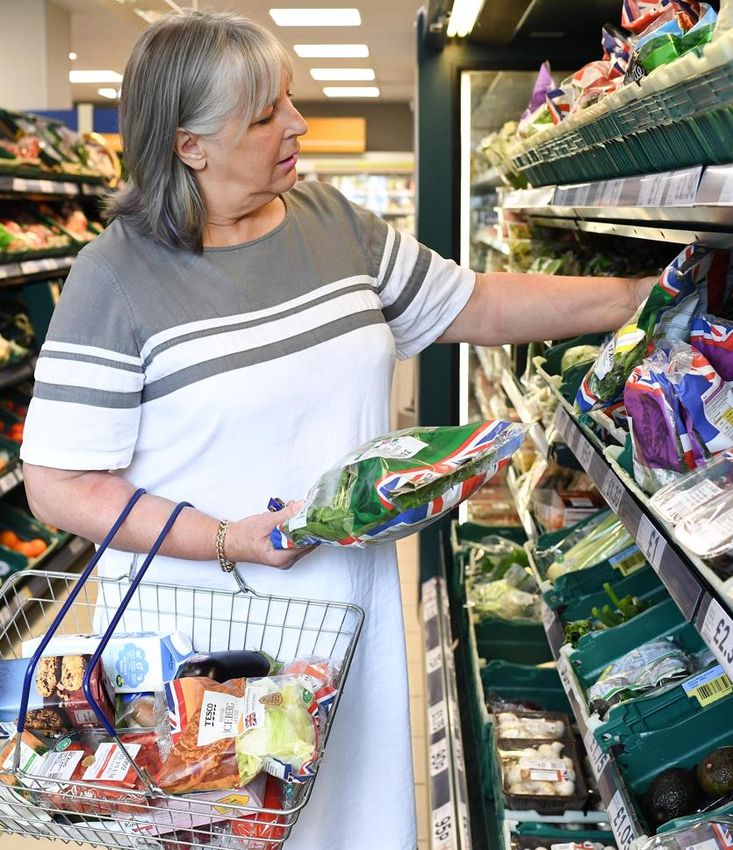
4 Supporting our communitiesFood for all • 3 items per customer per product; now removed on majority of products • Removing many multi-buy promotions • Special hours in store for both NHS workers and vulnerable and elderly customers • Online capacity expanded by 20%, adding 145,000 delivery slots • Working with Government to prioritise delivery slots for vulnerable people • Temporarily closed cafes, counters and phone shops • Maintained store opening hours • Office colleagues working in store where possible • Working with supplier partners to simplify our range
Grocery Home Shopping

                                                                                                                                                                                            list of
                                                                                                                                                                                   110,000
                                                                                                                                                                                          people
                660,000                                                                        805,000
               weekly slots                                                                     weekly slots
                                                                                                                                                                                      75,000
                                                                                                                                                                                        matched

                Capacity before                                                                     Capacity now                                                               Supporting the most
                                                                                                                                                                                   vulnerable1

                                                                           120 deliveries per minute
1. Initial list from the Government of 110,000 clinically vulnerable and isolated people, of whom we have matched 75,000 to existing customers and let them know we are making home delivery slots available to them immediately.
Safety for everyone • New social distancing measures, summarised in a colleague advert • Created one-way aisles and ‘one-in, one-out’ system to help limit flow • Using directional floor markings to help everyone keep a safe distance • Protective screens at checkouts • Enhanced cleaning routines and new cleaning stations • Encouraging payment by card
Option 2: full screen of
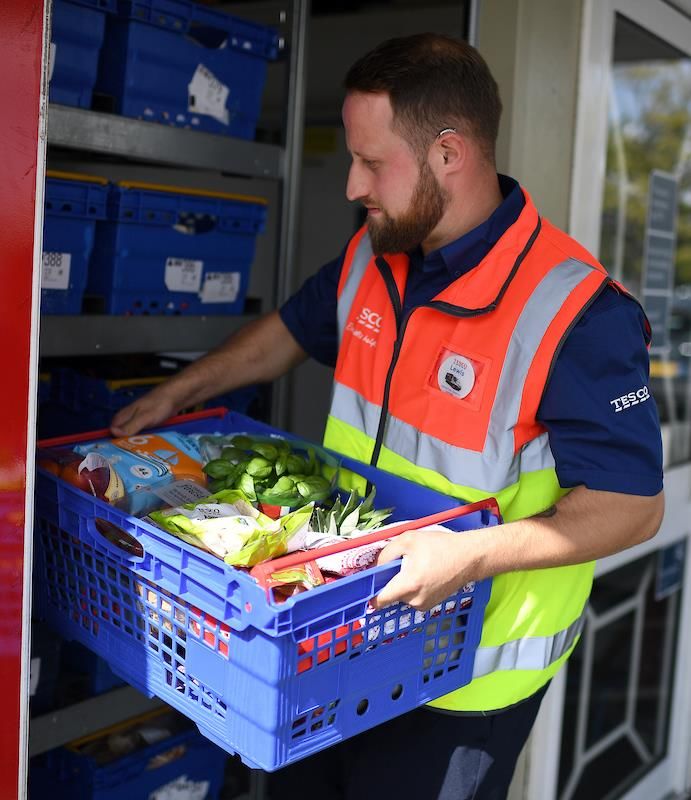
picturesSupporting our colleagues • Colleagues receiving full pay from first day of absence • 12 weeks’ fully paid absence for colleagues over 70, vulnerable or pregnant • 10% bonus to colleagues across stores, distribution and customer engagement centres • New school closure leave policy • >45,000 new colleagues have joined us since 20 March, including pickers and drivers • Colleague discount increased to 15%
Supporting our communities

• £3m ongoing monthly food donations via Community Food Connection & distribution centres
• £15m food and £1m funding over the next 12 weeks for FareShare and the Trussell Trust
• Focusing £2m funding from Bags of Help to charities helping the most vulnerable
• Building on partnership with the British Red Cross, donating £2m to support those in need
• >£1m of funding for stores to support local causes
• Donating food for 1m meal parcels for NHS workers, supporting ‘SaluteTheNHS.org’ initiative
• Constructing our first dedicated NHS Nightingale Hospital pop-up store
Food donations

                                                                       £1m
        £3m               +          £15m                 +            £1m
     per month                                                       donation

 Continuing with normal        Boost over next 12 weeks       Additional funding to support
       donation                                                     operational costs

                              Over £50m this year
Looking ahead • Material impacts from COVID-19 • Incurring significant additional costs, particularly payroll • Precise impacts hard to predict • Range of scenarios considered • Not prudent to provide profit guidance for 2020/21 • Based on scenario of return to normal customer behaviour by August, retail impacts could be broadly offset by: • Food volume increases • Twelve months’ business rates relief in the UK • Prudent operations management
Summary

• Over the last five years we have focused on:
  • Serving customers better
  • Re-engaging with colleagues
  • Resetting supplier relationships
  • Creating value for shareholders
• We are in a strong operational and financial position to deal with COVID-19
• Significant extra costs in feeding the nation partially offset by business rates relief
• Seen an outstanding colleague contribution
• Together, we can do this
Q&A.
Appendix.
Proposed sale of businesses in Thailand & Malaysia

9 March 2020             Sale agreed
As soon as practicable   Circular and notice convening first general meeting
                         First general meeting
                         Competition approval
2H 2020                  Sale completion
                         Notice convening second general meeting
                         Second general meeting
                         Share consolidation and special dividend paid
Capital expenditure
£1.1bn £1.1bn
by region by typeExceptional items
Net restructuring & redundancy costs £(107)m
Net property disposals£193m £44m
Booker integration
£102m costs £120m £(23)m
Acquisition of property joint venture £(136)m
Net impairment loss of non-current assets
Business- 2°C TBC
£(15)m
Impairment of investment in India joint venture £(47)m
Profit on disposal of Gain Land
as-usual trajectory £37m
£(263)m
Other corporate activity costs £(22)m
£(421)m
Tesco Bank mortgage disposal £(5)m
Closure of Tesco Bank current accounts to new customers £(56)m
Provision for customer redress £(45)m
Total exceptional items in statutory operating profit £(375)mImpact of week 53
YoY 53 week change YoY 52 week change
2019/20 Exclude: 2019/20
(actual exchange (actual exchange
53 week basis week 53 52 week basis
rates) rates)
Group sales (exc. VAT, exc. fuel) £57,370m £(843)m £56,527m 1.1% (0.7)%
Group operating profit before exceptional items
£3,005m £(46)m £2,959m 15.3% 13.5%
and amortisation of acquired intangibles
Exceptional items and amortisation
£(487)m £34m £(453)m n/a n/a
of acquired intangibles
Group statutory operating profit £2,518m - n/a (4.9)% n/a
Adjusted diluted EPS 18.23p (0.31)p 17.92p 30.1% 27.9%
Dividend per share 9.15p - n/a 58.6% n/a
Capex £1.1bn - n/a n/a n/a
Net debt £(12.3)bn £0.2bn £(12.1)bn 6.9% 8.4%
Retail free cash flow £1.9bn £0.2bn £2.1bn 109.9% 132.1%You can also read