FY16 full year results and FY17 outlook presentation Supplier meetings - September 2016
←
→
Page content transcription
If your browser does not render page correctly, please read the page content below
FY16 full year results and FY17 outlook presentation
Supplier meetings
September 2016

Introduction
Agenda

 1. Current situation

 2. Milk Supply Support Package

 3. Trends impacting FY17

 4. FY16 results

 5. Actions being taken

 6. Investing for the future

 7. Outlook

Page 3
Current situation

•        Global dairy prices have been at historically low prices for 24 months which have impacted
         and continue to impact export-facing dairy companies globally – none have been immune

•        This situation impacted our FY16 farmgate milk price (FMP) and continues to impact the FY17
         FMP

•        We deeply regret the lateness of the notification of this impact in FY16 and the devastating
         effect it had on our suppliers

•        In FY17, we have put forward a forecast and opening price that reflects these current market
         conditions

•        Early indications are that global dairy prices are starting to recover – we will keep suppliers
         informed and once price recovery is confirmed, any upside will be passed onto suppliers in the
         FMP

•        In addition, we have taken measures to remove costs from the business in order to mitigate
         the challenges that current dairy prices present

Page 4
Farmgate milk pricing and the Milk Supply Support Package

•        The MSSP was intended to protect MG’s milk supply in the long term and support suppliers’
         cash flow in the near term by not requiring them to incur a full reduction in the FMP during the
         months of May and June 2016

•        At the close of the year, MSSP support totalled $183 million

•        With the MSSP included, we delivered an average cash price in FY16 of $5.53 per kgms

•        The Board acknowledges that the MSSP is impacting the FY17 FMP, especially given
         continuing low commodity prices

•        It has become very clear to the Board that the MSSP has not achieved the purpose for which it
         was intended

•        The Board and management are actively reviewing all options to deal with this issue with a view
         to provide a better solution to support suppliers in the long-term interest of suppliers and MG

•        This issue is complex but the Board expects to be able to make an announcement by the AGM

Page 5
Trends impacting FY17 FMP of $4.80
                                                                                                              Early indications
                          Assumptions
                                                                                                               for FY17 FMP

     Commodity
                          • Flat prices from 1 July 2016 in 1H17, ~6% improvement across basket in 2H17           Positive
     prices1

     Australian
                          • AUD:USD exchange rate of approximately $0.74                                          Negative
     dollar

     Milk intake          • Manage manufacturing cost base inline with lower milk intake                           Neutral

                          • Stable domestic market
     Dairy Foods                                                                                                   Neutral
                          • Continued growth in export markets

                          • Improvements in manufacturing from new Cobram consumer cheese plant and SAP
     Efficiencies         • ~$100m to $110m sustainable working capital release in FY17                           Positive
                          • ~$10m to $15m net cost savings above budget to be delivered in FY17

     Farm input           • Grain and fodder significantly reduced compared to FY16
                                                                                                                  Positive
     costs                • Higher than average rainfall in catchment areas resulting in lower water prices

Page 6     1. Refer to MG’s Opening Price announcement, 28 June 2016, for further detail.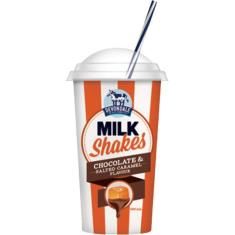
Presentation
Focus on safety
Our TRIFR reduced by 12% in FY16

Total Recordable Injury Frequency Rate (TRIFR) (FY12 to FY16)   •   Continue to focus on
                                                                    improving the safety
                                                                    standards within our
                                                                    business
                                                                •   Committed to continued
                                                                    improvement across our
                                                                    business – further
                                                                    improvement to go
                                                                •   Goal Zero: Working
                                                                    safely is our first choice

Page 8
Key outcomes
Total milk intake Revenue Available farmgate milk
price delivered1
3.5 billion litres $2.8 billion
Down 2.5% from FY15 Includes $1.1 billion in export sales $4.80 per kgms
$ $ $ $
Fully franked dividend Growth in Dairy Foods New consumer cheese facility
3.91 cents per share $1.3 billion construction completed
Payable 29 September 2016 Up 17.2% on FY15
Milk Supply Support Closing net debt Successful implementation
Package (MSSP) $480 million of SAP
$183 million Gearing of 29% Efficiencies expected to flow
from FY17
Page 9 1. For the purposes of the Profit Sharing Mechanism the Actual Weighted Average Southern Milk Region FMP $4.76 per kilogram milk solids (kgms) is used. The Actual Weighted
Average Southern Milk Region FMP does not include the add-back of quality adjustments accrued from the supply of non-premium milk.Global dairy commodity markets remained at low levels in FY16
Full Cream Milk Powder Commentary
(Oceania FOB USD / MT – 10 year to June 2016)1
• Current downturn longest in 10 years
– FCMP experiencing an extended period
below US$3,000 2
– Far longer than previous downturns
$US3,000
– Ingredients impacted with 26% lower
revenue at $886 million down from
$1,203 million in FY15
• European supply ex-quota remains key driver
– Russia embargo continues
Jul16
• Milk remained in surplus globally throughout
Average prices across key commodities the year
(Oceania FOB nominal prices)1
Commodity FY15 FY16 Variance • Average observed prices across key
commodities fell in FY16
FCMP US$2,796 US$2,161 (22.7%) • Observed prices closed FY16 well below long
term averages
SMP US$2,710 US$1,836 (32.2%)
Butter US$3,303 US$2,873 (13.0%)
Cheddar US$3,809 US$2,938 (22.8%)
1. Source: US Department of Agriculture, Dairy Australia. Prices are observed, not MG’s achieved prices.
Page 10
2. Rabobank.Commodity prices and cost increases impacted FY16 FMP
A comparison of FY15 to FY16 demonstrates the factors leading to a lower Available Southern
Milk Region FMP per kgms
$6.02 Uncontrollable
drivers
PSM
Rise in controllable costs unacceptable
adjustment
Small saving from actions announced in April
$5.71
$0.03
$0.19 $0.07 ($0.06) $4.80
$0.02
($0.03)
$0.35
($0.13)
($1.35)
FY15 Ingredients Weaker A$ Dairy Nutritionals Other Cost Wage and One-off MSSP FY16
Available FMP contribution in FY16 Foods contribution Segment1 growth labour gain on impairment Available FMP
and contribution savings DTS sale provision
PF15 for PSM announced
application April 2016
Page 11 Note: See appendix for FY15 and FY16 SMR milk solids, Distributable Milk Pool, Segment price movements include milk revaluation expense. 1. Contains contribution from MG Trading,
Milk Broking and other one off costs.Decisive actions to address market conditions
Management has taken decisive action to release cash and reduce overheads in light of
prevailing conditions for suppliers and investors
Sustainable working capital release Cost efficiencies – overhead reduction
Annualised target: $50 to $60 million
Target
Target: $150 to 160 million
Completion: FY18
Completion: June 2017
One off costs: $10 million
impact
FY17
FY17 target: $100 to 110 million Net FY17 target: $10 to 15 million
• $51 million reduction in trade receivables in FY16 • Head office organisational review complete
• Significant, permanent, head count reduction
• Further $100 to $110 million of sustainable • FY17 impact by timing of efficiencies
Considerations
inventory reduction targeted for FY17
• Procurement opportunities
– Sell production ‘to the curve’
• One-off costs largely related to redundancy
– Sell down of existing adult milk powder expenses
inventory • SAP implementation provides an end to end
solution across a number of areas including
financials, manufacturing, logistics, and distribution
and is a key facilitator to delivering efficiencies
Page 12Ingredients and Nutritionals
Commodity price declines impacting ingredients, somewhat offset by continued strong
demand for Australian nutritionals product
Ingredients and Nutritionals revenue of $1,093 million, Ingredients revenue
down 18.5% on FY15
● Ingredients revenue down 26% to $886 million
• Driven by global dairy commodity prices, which saw declines in FY16
• Revenue from TDP of $79 million included in FY16, prior year TDP
included in Other segment
• B2B Nutritionals revenue growth of 50% to $206 million
• Excellent growth in B2B business
• Some pricing pressure as commodity prices fell
• Positioned to continue to grow in advance of new nutritionals plant
Nutritionals Revenue
Page 13Dairy Foods
Dairy Foods business continued solid growth in FY16. Challenging domestic conditions
were offset by pleasing growth in demand in international markets.
Dairy Foods revenue up 17.2% on FY15 to $1,327 million Domestic Dairy Foods Revenue
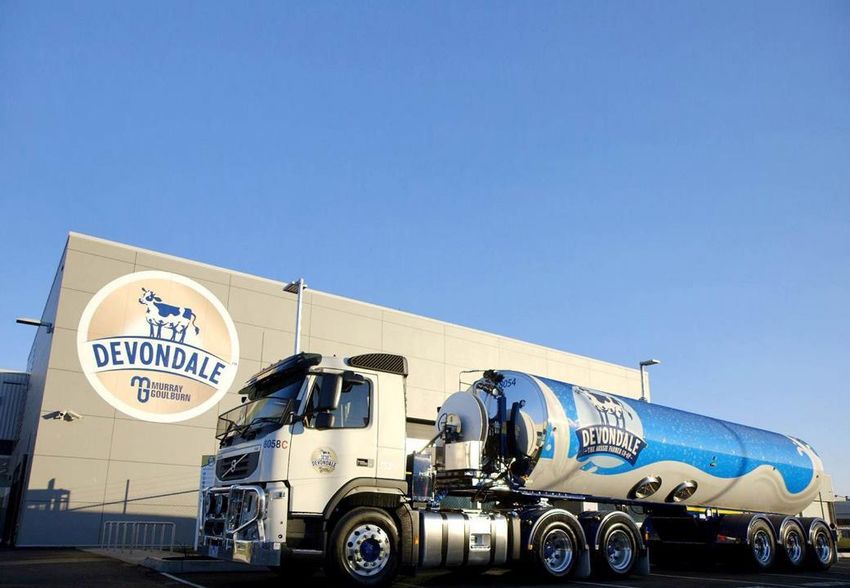
● Devondale branded sales of $580 million, up 45%
● Domestic sales up 10.6% to $1,106 million
• Pricing environment remains challenging across all categories
• Pleasing response from MasterChef promotion
• New 8 Bar iced coffee and Devondale Milkshakes performing well
• Sales of adult milk powders up 95% to $146 million, largely consumed
offshore
● International sales up 67.6% to $221 million
International Dairy Foods Revenue
• Dairy beverages up 8% despite competitive pricing
• Adult milk powders direct sales of $85 million
• Cheese revenue up 73%
● China sales in FY16 of $267 million
• Across UHT, adult milk powders and existing infant formula brands
• Includes management estimates of $126 million in outbound sale revenue
• Cheese growth driven by food service in China as Italian style food and
bakery continue to grow
• Additional EU milk channelled into China placing pressure on margins
(particularly UHT)
Page 14Our Devondale brand is building scale
$580m in global
sales
UHT Daily Butter Instant Block Flavoured and
milk milk blends milk cheese iced coffee
4Q
#1 #2 #1 #2 Award winning design
market
market market market market Convenience channel
share
share share share share roll-out occurring
up 125%
Page 15 Note: Market share and revenue data to 17 July 2016. All market share data is for Australian market, excluding private label product brands.
Source: IRI MarketEdgeProduction and manufacturing
FY16 was a year of continuous improvement for MG’s manufacturing footprint
FY16 production1 Operational highlights
Laverton and Erskine Park daily pasteurised plants operating
efficiently
Milk use by end use
Over 250 improvement initiatives implemented across the
manufacturing and supply chain in FY16
Major cost improvement in quality was achieved – up 28% on
prior year
Waste and yield improvements largely offset rising non-milk
input costs
SAP implementation across manufacturing footprint
successful
Continued reduction in CO2 footprint
• Condensate recovery systems, boiler economisers
Milk use by segment
and LED lighting upgrades
Page 16 1. Represents manufacturing output for FY16. Excludes milk attributable to Milk Broking.Balance sheet strong
FY16 cash flows and “core debt”
$171
$635
$183 $480 • Cash flows reflect inventory build up and
support to suppliers in the form of MSSP
($86)
$183 MSSP • Adjusting for balance sheets items
intended to be liquidated to cash “core
debt” stands at $236 million
($423)
$61
Inventory
build-up
• Total debt of $480 million represents a
gearing ratio of 29%
“Core
$236
debt”
FY15 Op Investing Financing MSSP FY16
net debt cash cash cash net debt
flow flow exc. flow
MSSP
Page 17Building track record of major project delivery
MG substantially delivered two strategic projects in FY16, which will both contribute to
greater efficiencies within the business
Consumer cheese facility SAP implementation
• $91 million capex spent in total • Total capex spend of $72 million
– $86 million spent to date – Key enabler to reduce overhead costs throughout
– Includes spend over-run of 2 to 3% the business in the future
• 12-week commissioning commenced • 24 month development process replacing an aging and
fragmented set of bespoke applications
• Delivers significant uplift in capability
• Key enabler of planned efficiencies
• Run-rate savings of ~$10 million p.a.
• Delivers significant benefits and capability
– Additional efficiencies as volumes ramp up
– Automated and real-time tracking of milk to
– One-off cash costs of ~$12 million in FY17 products to customers
• Highly utilised from outset – Improved real time end-to-end reporting
– Coles supply commences end-January – Ability to generate accurate forecasts in
significantly shorter time periods
1 August 2016 May 2016 – Automates many existing manual processes
Commissioning Testing of – Greater governance with system authorisation
successfully started robotic
with first bag of de-palletising controls
cheese achieved at and de-boxing
correct weight and
rate
Page 18Investing for the future
• We remain committed to investing across Consumer cheese
three key dairy growth categories • 12-week commissioning underway
• Each investment will be tested to ensure • Coles supply commence mid-January 2017
capital is deployed appropriately to generate
acceptable returns
Nutritional powders Dairy beverages
Good progress made in FY16 on MG’s planned Proposed brownfields investment ensures we
nutritionals investments, including negotiations remain a low-cost manufacturer of high quality
with Kalbe and Mead Johnson UHT and other dairy beverages
Page 19Strategy – refocusing on execution
We have refocused attention on executing three key priorities in FY17
1
• Cost efficiency program
Operational excellence • Manage manufacturing costs inline with milk intake
• Optimise mix and drive returns from recent investments
2
• Continue to build Devondale branded platform
• Consistently achieve premiums to commodity through
Innovation
consumer, nutritional and value add ingredients products
• Focus on sustainable growth in China
3
• Inventory selldown and overall working capital focus
Maintain prudent
• Sustainable working capital efficiency program
balance sheet
• Tailor capex plans to prevailing market conditions
Page 20Outlook
• We continue to face a challenging environment with global markets in over supply and a higher
than expected Australian dollar
• Commodity prices have shown some upward momentum in August, with recent GDT results
showing recovery across most commodities. Only a sustained recovery through the peak in
Australia and New Zealand will add meaningfully to milk price returns.
• Lower grain, water and fertiliser prices helping on farm costs of production
• On the milk losses to date, MG has clear plans to manage manufacturing costs in line with milk
intake to best insulate the FMP
• Impacts from retirements from the dairy industry and farm productivity remain the key risks to
MG’s milk intake and we will keep our supplier/shareholders updated
Page 21Thank you
You can also read