Trend and Outlook for Construction Tender Prices in Ireland 2020

Page created by Mildred Washington
 
CONTINUE READING
Trend and Outlook for Construction Tender Prices in Ireland 2020
Trend and Outlook for Construction Tender Prices in
Ireland 2020
Construction Tender prices continued to increase through 20191 - with increases noted of 10-12 percent
from early 2018 to late 2019. The ongoing tender price increase raises the estimated outturn cost of
projects in planning. Projects on site are not immune with continued cost increases on account of greater
than allowed for contracted inflation provision (4 percent) being experienced on projects such as the
National Children’s Hospital2.

The quantum of increase in tender prices experienced emphasises the importance of providing for future
tender inflation in feasibility studies and development cost planning – calculation of an appropriate
allowance needs to be a key part of financial risk planning for a project. This allowance should be based
on four things:

     1.   The estimate of project costs (including contingencies) at current market prices;
     2.   The pre-construction and construction period for the project;
     3.   The procurement and expenditure profile over the design and construction life of the project;
     4.   Anticipated market conditions.

Amounts provided for tender inflation should be identified separately in a budget and should be
incorporated into the individual cost components and adjusted as necessary at various project review
stages. This article looks at the current trends in material and labour costs and, based on an assessment of
the level of competition, demand and supply in the market, lays out a prediction for future tender inflation.

Construction Market & Ireland Economy Outlook
The Irish economy looks set to register strong growth again3 in with GDP likely to increase by almost 6
percent in 2019. The economy is expected to grow by a slower rate in 2020 of 3.3 percent according to
current forecasts.

The output of the Irish construction industry peaked in 2007 at over €38 billion, representing almost 24
percent of GNP. In 2019 it was estimated4 that the output of the industry was valued at €26.8 billion
(equivalent to c. 9,75 percent of GNP) – this level is still below the sustainable European level of 10 – 12
percent of GNP.

Right sizing construction output would imply a construction output range of €28.4 - €34.0 billion5 in 2020.

1
  Source: SCSI
2
  Source: Irish Times: https://www.irishtimes.com/news/health/chairman-of-national-children-s-hospital-gobsmacked-by-pac-
questions-1.4105689
3
  Source: ESRI Quarterly Economic Commentary, Winter 2019. December 12, 2019.
4
  Source: ESRI Quarterly Economic Commentary Winter 2019
5
  Source: Keogh Consulting calculation based on ESRI GNP data
ãCopyright Keogh Consulting 2020
This work is licensed under the Creative Commons Attribution-NonCommercial 4.0 International License. To view a copy of this license, visit
http://creativecommons.org/licenses/by-nc/4.0/ or send a letter to Creative Commons, PO Box 1866, Mountain View, CA 94042, USA.

This Document is for general information purposes only and does not constitute financial or other professional advice. Specific financial
advice should be sought on any particular matter. Any and all information is subject to change without notice. No liability whatsoever is
accepted by Keogh Consulting for any action taken in reliance on the information in this Document.
350.0                                                                                                  140.0
    Value or Volume Index. Employment ('000)

                                               300.0                                                                                                  120.0

                                                                                                                                                              Construction Tender Index
                                               250.0                                                                                                  100.0

                                               200.0                                                                                                  80.0

                                               150.0                                                                                                  60.0

                                               100.0                                                                                                  40.0

                                                50.0                                                                                                  20.0

                                                 0.0                                                                                                  0.0

                                                                                                                                             e
                                                       07

                                                            08

                                                                  09

                                                                          10

                                                                                11

                                                                                      12

                                                                                              13

                                                                                                    14

                                                                                                             15

                                                                                                                  16

                                                                                                                        17

                                                                                                                                 18

                                                                                                                                      19

                                                                                                                                           20
                                                   20

                                                        20

                                                              20

                                                                       20

                                                                               20

                                                                                     20

                                                                                           20

                                                                                                   20

                                                                                                         20

                                                                                                               20

                                                                                                                       20

                                                                                                                             20

                                                                                                                                   20

                                                                                                                                           20
                                                                  Value        Volume          Employment ('000)             Tender Index
Figure 1 - Trends in Construction Output Volume, Output Value, Employment v Tender Index6

                                               40.0%

                                               30.0%

                                               20.0%
    Annual % change

                                               10.0%

                                                0.0%
                                                        20
                                                             20
                                                                  20
                                                                       20
                                                                            20
                                                                                 20
                                                                                      20
                                                                                           20
                                                                                                20
                                                                                                     20
                                                                                                          20
                                                                                                               20
                                                                                                                    20
                                                                                                                         20
                                                                                                                              20
                                                                                                                                   20
                                                                                                                                        20
                                                                                                                                             20
                                                                                                                                                  20
                                                                                                                                                       20
                                                                                                                                                             20
                                                        00
                                                             01
                                                                   02
                                                                          03
                                                                               04
                                                                                    05
                                                                                         06
                                                                                              07
                                                                                                   08
                                                                                                        09
                                                                                                             10
                                                                                                                  11
                                                                                                                       12
                                                                                                                            13
                                                                                                                                 14
                                                                                                                                      15
                                                                                                                                           16
                                                                                                                                                17
                                                                                                                                                     18
                                                                                                                                                          19
                                                                                                                                                                 20
                                                                                                                                                                          e

                                          -10.0%

                                          -20.0%
                                                                                Tender          Cost         GDP         GNP
Figure 2 - Economic Growth Trend v Tender Price Changes7

6
  Source: CSO statistical release, 06 December 2019, Production in Building and Construction Index. Keogh Consulting estimates
of tender index.
7
  Source: GNP, GDP - CSO. Tender, Cost Indices - Keogh Consulting

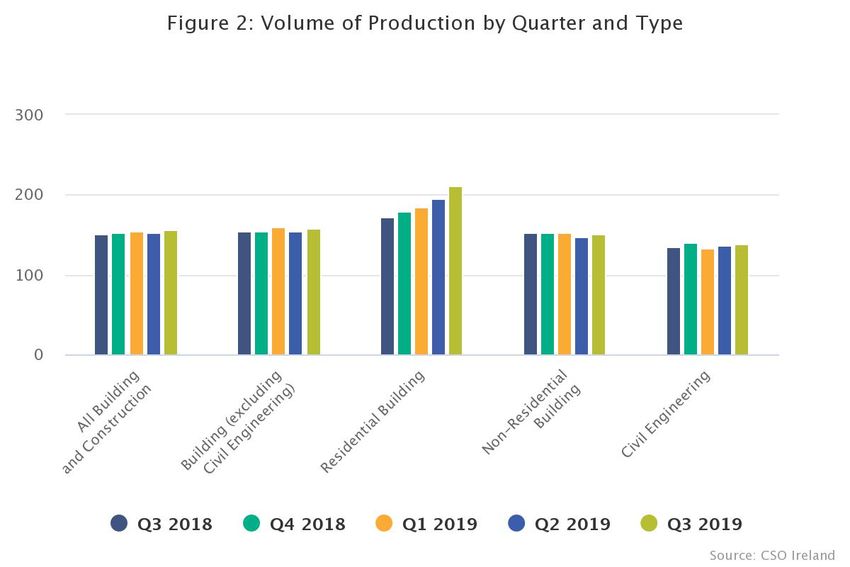
                                                                                         info@keoconsult.com +353 (0)86 3679322                                                           2
The volume of output in building and construction increased by +2.5 percent in the third quarter of 2019
when compared with the preceding period8. This reflects increases in the volume of output in civil
engineering work +1.7 percent and non-residential building work +2.2 percent. Output in residential
building work increased by +8.2 percent in the quarter. The change in the value of output in building and
construction in the same period was +2.8 percent. On an annual basis, the volume of output in building
and construction increased by +3.1 percent in the 12 month period to Q3 2019. There was an increase of
+4.6 percent in the value of output in building and construction in the same period. This is reflective of the
rising delivery cost in the market.

Based on ESRI data regarding rate of fixed capital formation9 Keogh Consulting estimate that construction
output is forecast to grow to €29.0 billion10 in 2020 (+€2.2 billion, +8 percent) at constant prices.

Figure 3 - Volume of Construction Production by Quarter and Type11

Market sentiment returns to expansion
Expansion sentiment though is strong with the latest results of the Ulster Bank Construction PMI survey12
signalled a return to expansion in Irish construction activity in December. Indeed, following a three-month
sequence of falling activity, the headline PMI index rose sharply in December 2019 to get back to above
the 50 breakeven level for the first time since August. Reduced Brexit uncertainty was cited as a source of
support for the increase in overall activity at the end of 2019, while the improvement also reflected better
performance across the three main sub-sectors. Notably, a welcome pick-up in Housing activity saw it
return to expansion in December, offering some support for the view that the recent weakness in the
Housing PMI was perhaps more reflective of large, adverse, Brexit-related moves in business sentiment
than of marked weakness in actual underlying housing activity.

8
  Source: CSO December 2019
9
  Source: ESRI Quarterly Economic Commentary Winter 2019
10
   Source: Keogh consulting estimate based on ESRI forecast growth in fixed capital formation of +8.3%
11
   Source: CSO. 6th December 2019.
12
   Source: Ulster Bank Construction PMI® Report (RoI), January 13th 2020

                                            info@keoconsult.com +353 (0)86 3679322                          3
Commercial activity saw a further acceleration in its rate of expansion in December 2019, in the process
remaining the fastest-growing sub-sector. “Overall, following disappointing readings over the previous
three months, the pick-up in the December PMI is an encouraging sign that construction growth regained
some growth momentum as 2019 drew to a close”. However, with political and trade concerns (including
China coronavirus outbreak slowing the Chinese economy) impacting on business activity globally Ireland
may have to work harder to retain a flow of foreign direct investment (FDI) in a reduced size FDI pool.

Generally, public sector projects have been impacted by the overspend on the National Children’s
Hospital with the lack of fiscal headroom constraining the funding of new projects in many sectors.
Projects that have been recently announced have been announced previously – there is currently limited
growth in public spend. The February general election will give clarity and a new government with new
spending policies and priorities.

Other details within the survey offered encouragement. A notable pick-up in new orders left the
December reading back in positive growth territory, while respondents also indicated faster growth in
demand for construction workers, with the pace of job creation rising to a six-month high in December.
Moreover, the Future Activity Index rose to a six-month high in December, as confidence about the
sector’s future prospects is being underpinned by expectations for availability of new projects in early
2020, while reduced uncertainty around Brexit was also cited as a source of support for the outlook.
However, the previous trend13 in the overall Construction PMI may point to downside risks to the
construction outlook as 2020 approaches.

Election brings uncertainty
However, the general election called for February 8th may give rise to uncertainty and unintended
consequences in the construction market as we wait and see who gains power and what policies are put in
place – particularly in relation to the residential sector – some of the solutions being proposed across the
political parties are likely, at best, to have no beneficial impact. And some of them may make things
worse.

Supply Chain Profitability & Competition.
The top 10 contracting organisations typically achieve an average pre-tax profit margin of 2-3% (Sisk –
2017 2.8%, 2018 2.4%14, Walls – 2017 2.15%, 2018 2.56%). This is a meagre profit margin relative to other
industries and the huge risks taken. The precarious state of contractors’ finances drives risk aversion and
restricts the supply chain’s ability to reduce or hold pricing.

Given these risks and market conditions, contractors are being more selective in what projects they are
bidding for with higher margin work targeted. This selectivity, possible on account of the capacity
constraints in the industry, is driving margin recovery through higher tender prices as illustrated by several
contractors reporting reduced turnover but increased net pre-tax profits.

While current commercial activity levels within the M50 are high, as indicated by the number of cranes and
active construction sites, the start date of some new projects has been pushed out of with some firms now

13
     Source: Ulster Bank Construction PMI® Report (RoI), December 9th, 2019.
14
     Source: www.johnsiskandson.ie

                                              info@keoconsult.com +353 (0)86 3679322                         4
having capacity in their pipeline for a 2020 start on site. Any delays in converting pipeline into turnover
mean that contractors, may need to bid for more work. This is increasing competitive pressure in some
sectors and project sizes. This trend is highly sector specific with some markets, such as data centres,
being very busy.

Material Prices Increasing
Material prices are increasing with the wholesale prices of building and construction materials15 have
shown an annual price increase of 1.6% on average in the 12-month period to December 2019. Transport
and site machinery operating costs have been relatively flat with a slight increase in petrol, and diesel
costs. Wholesale electricity costs have fallen by c.21% in 2019.

Figure 4 - Wholesale Construction material Changes 2020

Due to significant dependency on imports any imposition of tariffs or currency movements following Brexit
will lead to an increase in material costs – however, early negotiating positions laid out would seem to
indicate that this would not end up being the case. The overall outlook for material costs is inflationary as
with material costs being expected to rise on the back of strengthening sterling euro exchange rates and
increases in energy prices16. There have been widespread reports of greater raw material prices (notably
steel, insulation and fuel), with a consequent sharp rise in input costs during November.

15
  Source: CSO December 2019
 On the demand side, oil prices have been kept subdued due to the ongoing trade war between the US and China. Any
16

escalation in trade tensions is likely to see a slowdown in economic activity which in turn will lead to a downturn in demand for
energy.

                                              info@keoconsult.com +353 (0)86 3679322                                                5
Affordability & viability impacting on residential sector despite
demand
Although sentiment is improving with an increase in activity noted at the end of 2019 residential
construction activity levels have moderated with residential construction not accelerating at the pace
required to meet the latent demand present – residential projects are obtaining planning permission and
stopping. This is backed up by the recent review of the strategic housing planning process noting that, “of
the 49 SHD permissions granted between January 2018 and 30 June 2019, only 18 (37 percent) had been
activated in some way, either through enabling works or commencement of housing construction.”17 Our
view is that this is possibly a consequence of ongoing viability and funding issues with residential property
development (despite the need for c. 30,000 new homes annually) due to an affordability ceiling and
borrowing constraints.

                       35,000

                       30,000

                       25,000
     New Home Demand

                       20,000

                       15,000

                       10,000

                        5,000

                           0
                                 2018    2019e     2020e    2021e    2022e   2023e    2024e   2025e     2026     2027
                           Indigenous growth     Migration flows    Headship change   Replacement of obsolete units

Figure 5 – Predicted Components of Housing Demand                   18

17
   Conclusions of the Minister for Housing, Planning and Local Government on the Review of the Strategic Housing Development
process. October 2019.
18
   Source: Keogh Consulting Estimates based on CSO data

                                                            info@keoconsult.com +353 (0)86 3679322                             6
500,000
     Viable Delivery Cost/Affordable Purchase

                                                450,000                                                                                   439,997
                                                                                                                               421,126
                                                                                                        403,498
                                                           379,167    387,013
         Price. 102.02 sq m GIFA House

                                                400,000                                                                                     430,406
                                                                                                                     412,171
                                                                                              395,114
                                                350,000    371,569

                                                300,000

                                                250,000

                                                                                                                                                183,375
                                                200,000                                                   173,798               178,523
                                                                                   169,199
                                                                                                                     176,145                180,933
                                                150,000                                       171,483
                                                                       166,945

                                                100,000

                                                 50,000

                                                     -
                                                          20

                                                                     20

                                                                                 20

                                                                                             20

                                                                                                        20

                                                                                                                    20

                                                                                                                               20

                                                                                                                                          20

                                                                                                                                                      20
                                                          19

                                                                     20

                                                                                  20

                                                                                             21

                                                                                                         21

                                                                                                                    22

                                                                                                                               22

                                                                                                                                          23

                                                                                                                                                      23
                                                             H

                                                                        H

                                                                                     H

                                                                                                H

                                                                                                            H

                                                                                                                       H

                                                                                                                                  H

                                                                                                                                             H

                                                                                                                                                         H
                                                              2

                                                                         1

                                                                                      2

                                                                                                 1

                                                                                                             2

                                                                                                                        1

                                                                                                                                   2

                                                                                                                                              1

                                                                                                                                                          2
                                                                  Viable Delivery Cost            Affordable Purchase Price

Figure 6 - Viable Delivery Cost v Affordable Purchase Price For Median Household Income

Employment growing moderately but costs increasing
On account of ongoing increased activity, CSO figures19 released in November 2019 shows that
employment in construction has increased 2.0% from 147.0K Q3 2018 to 150.0K Q3 2019, still significantly
below the noted peak of c. 400K in 2007.

Output per construction worker has stayed broadly within the range indicated below with minimal
productivity gains since the construction market peak in 2007. This would imply an extra 10,000 – 14,000
workers being required to meet the expected €2.2 billion growth in output in 2020.

There are large projects starting in 2020 – the massive Intel Fab project will absorb a large amount of
industry capacity with the two planning permissions representing a $8 billion (€7.26 billion) investment
which is estimated to employ 6,000 construction workers (4 percent of total construction employment) at
peak and 1,600 full-time jobs on completion. It may be that there is a like for like replacement of industrial
capacity given the completion and commissioning of some recent industrial projects including a number of
data centres and pharmaceutical plants.

Labour costs are rising with the 2018 & 2019 sectoral employment order feeding labour cost inflation – the
October 2019 SEO will increase costs on the back of the +2.7 percent wage increase and an increase in
the working week from 37 to 39 hours. We estimate that this will give rise to a base 5.2 – 7.7 percent
increase in labour costs.

19
     Source CSO: Labour Force Survey November 2018.

                                                                                 info@keoconsult.com +353 (0)86 3679322                                       7
230.0
     Output per construction employee, €'000

                                               220.0

                                               210.0

                                               200.0

                                               190.0

                                               180.0

                                               170.0

                                               160.0

                                               150.0
                                                       20

                                                            20

                                                                  20

                                                                         20

                                                                               20

                                                                                      20

                                                                                            20

                                                                                                     20

                                                                                                          20

                                                                                                                20

                                                                                                                       20

                                                                                                                              20

                                                                                                                                       20

                                                                                                                                            20
                                                       07

                                                             08

                                                                    09

                                                                          10

                                                                                 11

                                                                                      12

                                                                                                13

                                                                                                     14

                                                                                                          15

                                                                                                                  16

                                                                                                                         17

                                                                                                                                  18

                                                                                                                                       19

                                                                                                                                            20
                                                                                                                                               e
                                                            Output €'000 per worker    95% Probability         -95% Probability

Figure 7 - Construction Output per Worker at Fixed Price                                   20

Prices to increase through 2020
Our view is that there will be some further increase in tender prices in 2020 as contractors look to
selectively tender and cover the costs of rising labour and materials prices. The increase in tender prices
emphasises the importance of providing for future construction inflation in feasibility studies and
development cost planning. On this basis estimates regarding tender inflation over the period to 2020
have been forecast using the following assumptions:

                             1. Forecast GNP growth in Ireland of +3.3 percent in 202021 moderating from +6.0 percent in 2019.
                                +€2.2 billion in construction output.
                             2. The general rate of CPI inflation forecast at 1.0 percent in 2020 (0.5 percent 2019) and 1.2 percent
                                in 2021. Thereafter it is assumed that CPI inflation is in line with the 2.0 percent ECB target;
                             3. Inflation in building and construction materials rises by +3.0 percent in 2020 and 2021, unwinding
                                some of the material price reduction experienced at the end of 2018;
                             4. Average labour costs rise by +6.0 percent in 2020 and then by +4.0 percent in 2021 and 2022;
                             5. It is assumed that the weighted building and construction cost inflation rate is made up of 60
                                percent materials and 40 percent labour costs. 30 percent M&E in building22;
                             6. Competitive tendering of projects.

The forecast of cost and tender price indices has been calculated using the following calculations:

                             1. Cost Index Forecast = 60% x Equipment and Materials Inflation + 40% x Labour Cost Inflation

20
   Source: Keogh Consulting Calculations From CSO data.
21
   Source: Quarterly Economic Commentary Winter 2019, ESRI, 4th December, 2019
22
   Buildings with a higher/lower M&E percent may vary from the noted tender increase

                                                                                info@keoconsult.com +353 (0)86 3679322                             8
2. Tender Index Forecast = Cost Index Forecast x Expected Change in Tender Margin
                           3. Average M&E cost at 30% of Total Building Cost

After peaking in 2018 at a rate of 7.2 percent our forecast is for tender inflation to moderate in 2019 &
2020 to c. 6.5 percent & 4.2 percent respectively based on the noted assumptions.

                                              9.0%
  Annual % tender price increase (forecast)

                                              8.0%

                                              7.0%

                                              6.0%

                                              5.0%

                                              4.0%

                                              3.0%

                                              2.0%

                                              1.0%

                                              0.0%
                                                        2017           2018             2019           2020e           2021e

                                                        General Building Index       M&E Index       Composite Index
 Source: Keogh Consulting Calculations

Figure 8 - Historic and Forecast Tender Prices Annual Percentage Change

                                              2015          2016          2017            2018          2019e          2020e      2021e
                                                 3.1%          2.5%          4.2%            3.4%           3.6%           4.2%       3.4%
Table 1 – Historic and Forecast Building Cost Changes

                                              2015          2016          2017            2018          2019e          2020e      2021e
                                                 97.4          102.1         108.5           116.9         124.9          132.3      137.8
Table 2 – Historic and Forecast Building Tender Index

                                                                              info@keoconsult.com +353 (0)86 3679322                     9
150.0

                           145.0
  Estimated Tender Index

                           140.0

                           135.0

                           130.0

                           125.0

                           120.0
                                   2019              2020              2021                2022

                                               Expected     Lower     Upper
Figure 9 - Forecast Tender Index Ranges

Reviewing the sensitivity of tender price to changes in labour and gross margin recovery indicates that
increases above 6.5 percent in tender prices would necessitate a mark-up on costs increase of above 2.5
percent (from current estimated levels) and a minimum wage increase of 6.0 percent in 2020.

                                                                       Labour Cost Increase
                                                     +5.0%                    +6.0%                +7.0%
                                      - 5.0%                   4.0%                    4.4%                4.8%
 cost increase
  Mark-up on

                                      - 2.5%                   5.0%                    5.4%                5.9%
                                        0.0%                   6.1%                    6.5%                6.9%
                                      +2.5%                    7.1%                    7.5%                7.9%
                                      +5.0%                    8.1%                    8.5%                9.0%
                                                                  Estimated 2020 Tender Increase
Table 3 - Sensitivity of Tender Prices to Wage and Margin Increases

Conclusion
Amounts provided for tender inflation should be identified separately in a budget and should be
incorporated into the individual cost components at various project review stages and updated as
necessary. This article has looked at the current trends in material and labour costs and, based on an
assessment of the level of competition in the market, lays out a prediction for future tender inflation
illustrating a clear estimation methodology. After peaking in 2018 at a rate of 7.2 percent our forecast is
for tender inflation to increase by 6.5 percent in 2020 based on the key assumptions noted.

                                                  info@keoconsult.com +353 (0)86 3679322                      10
You can also read