Launch of the Chilling Prospects 2020 report and This Is Cool campaign - Special thanks to the Cooling for All funders: SEforALL
←
→
Page content transcription
If your browser does not render page correctly, please read the page content below

16 July 2020
Launch of the Chilling Prospects 2020 report and
This Is Cool campaign

Special thanks to the Cooling for All funders:
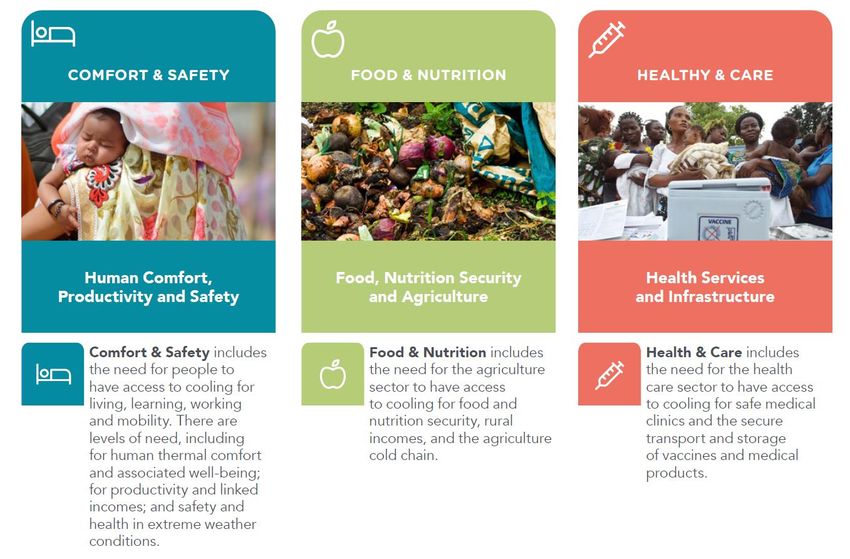
OVERVIEW

•   THIS IS COOL
•   GLOBAL TRENDS IN COOLING ACCESS
    •   INDIA CASE STUDY
•   COOLING FOR ALL AND COVID-19
•   THE PRODUCTIVITY PENALTY
•   SUSTAINABLE COOLING SOLUTIONS & THIS IS COOL
•   Q&A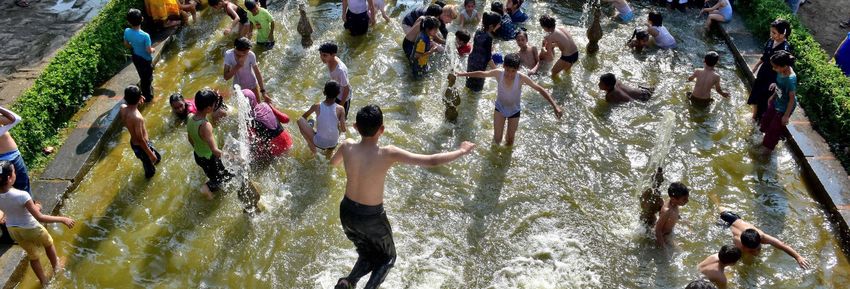
WHO IS PRESENTING | Four members of SEforALL’s Cooling for All team

         Sejla Mehic       Brian Dean        Alice Uwamaliya    Clotilde Rossi di Schio
         Moderator         This Is Cool      Global Trends in     India Case Study
                       Sustainable Cooling   Cooling Access     Cooling and COVID-19
                            Solutions                              The Productivity
                                                                       Penalty
#ThisIsCool
CAMPAIGN
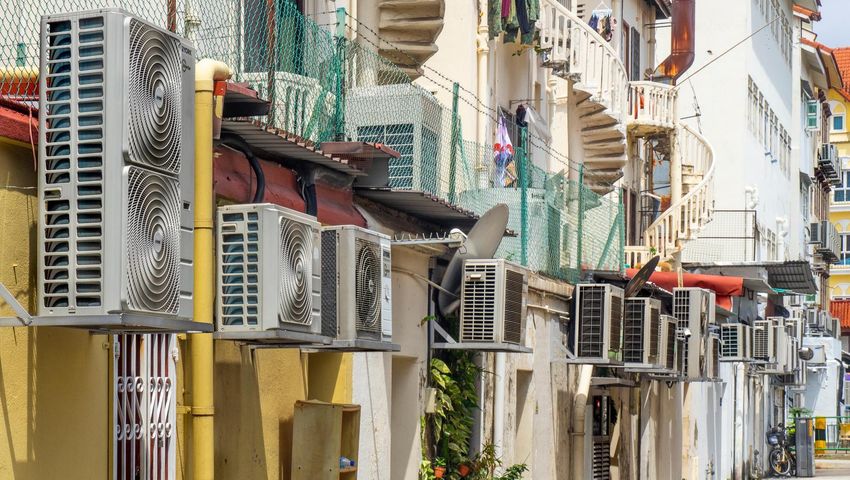
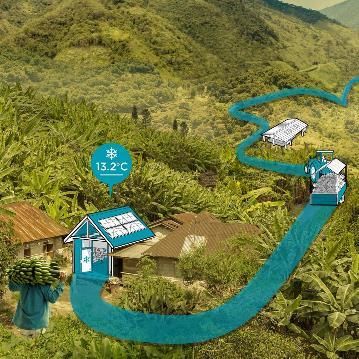
Over 1 billion people lack access to sustainable cooling and a further 2.2 billion have
inefficient cooling. In a warming world, access to sustainable cooling is not a luxury.
It is an issue of equity and a service that must be delivered to everyone.
This Is Cool is a campaign to show what can be done across the world to make
sustainable cooling a reality.
#ThisIsCool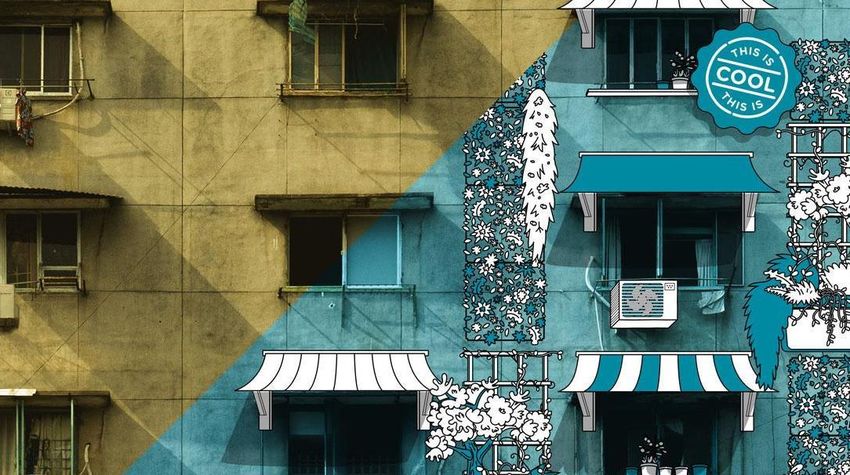
SOCIAL MEDIA CONTENT
We have a bank of social media assets written and formatted to cover a range of topics from health security, productivity
and urban planning to passive cooling, final mile and transportation. Everything has been created to spread the word.

PORTABLE SHADE             PASSIVE COOLING              COOL ROOFS                  COOL SCHOOLS                TRANSPORTATION
Productivity               Transition                   Urban planning              Heat stress                 Food security

thisiscool.seforall.org                                                                                                          #ThisIsCool
IMAGES TELL THE STORY
Each post and topic has a selection of photography and graphics designed to start a conversation about the
importance of sustainable cooling for all.

 URBAN PLANNING                                          HEALTH SECURITY             PASSIVE COOLING         COOL ROOFS
 Heat action plans                                       Final mile                  Simple solutions        Urban design

  thisiscool.seforall.org                                                                                                   #ThisIsCool
GRAPHICS AND STICKERS BRING IT TO LIFE
Use our interactive assets to highlight changes and solutions that can
Implemented easily in your business or community.

thisiscool.seforall.org                                                  #ThisIsCool
SOCIAL POSTS IN ACTION

thisiscool.seforall.org   #ThisIsCool
SIMPLE ACTIONS YOU CAN TAKE TODAY

1.   Rethink your approach to cooling
     Our resources include tools and assets to help you reconsider your cooling choices
     to improve lives, reduce emissions and be more efficient.

2.   Learn why sustainable cooling is so important
     Ensure you know why sustainable cooling matters and understand why it is so
     important to build a stronger, more resilient world.

3.   Spread the word with the campaign
     Use our toolkit to start a conversation about the importance of sustainable cooling
     for all and the impact it will have on high risk communities across the world.

thisiscool.seforall.org                                                                    #ThisIsCool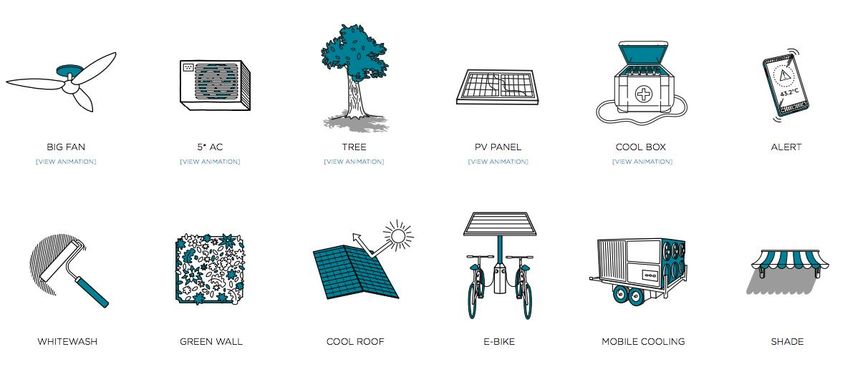
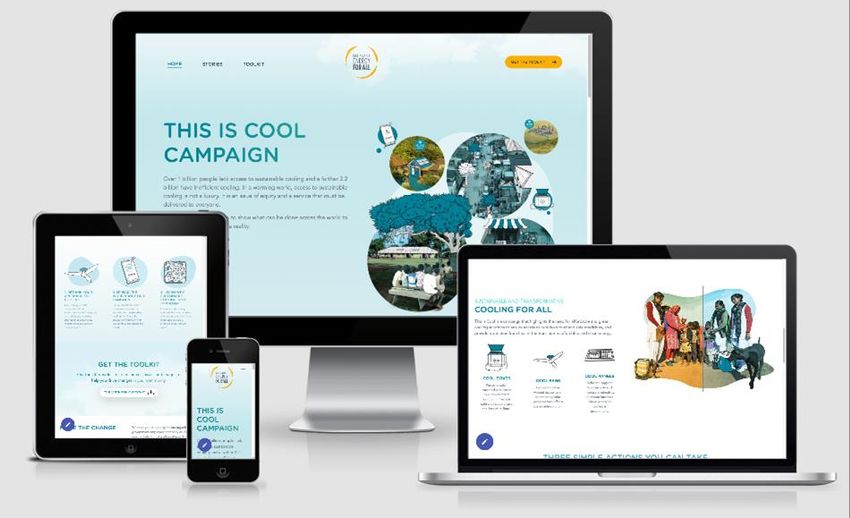
CAMPAIGN
WEBSITE

Our microsite is a great place to access
everything you need to start a conversation
about the importance of sustainable cooling
for all.

  ●    Case studies
  ●    How-to toolkit
  ●    Social media assets
  ●    Image library
  ●    Stickers, gifs and animations

  thisiscool.seforall.org                     #ThisIsCool
#ThisIsCool

Go to
        thisiscool.seforall.org
                                  #ThisIsCool
GLOBAL TRENDS IN COOLING ACCESS
POPULATIONS IDENTIFIED IN CHILLING PROSPECTS | POPULATION AT RISK

                RURAL                                  URBAN                            LOWER-MIDDLE                      MIDDLE
                POOR                                   POOR                                INCOME                         INCOME
• Likely to be subsistence                         • May have some access             • May purchase an            • May be able to afford a
  farmers without access                                to electricity, but live in     affordable thus likely       more efficient air
  to an intact cold chain;                              housing of poor quality;        inefficient air              conditioner or minimize
• may lack access to                               • may have a refrigerator,           conditioner or               its use;
  electricity and properly                              but food often spoils           refrigerator that raises   • may move to energy
  stored vaccines.                                      due to intermittent             energy consumption           efficient housing and
                                                        power.
Source: Chilling Prospect - Providing Sustainable Cooling for All, SEforALL, 2019
                                                                                        and GHG emissions.           working environments.

Source: SEforALL analysis, Chilling prospects 2020
ACCESS TO COOLING | LEVEL OF RISK Source: SEforALL analysis, Chilling prospects 2020
TRENDS IN COOLING ACCESS | POPULATION AT HIGHEST RISK
       RURAL POOR: APPROXIMATELY 318 MILLION

                                        • Likely to be subsistence farmers without access to an intact cold chain
                                        • May lack access to electricity and properly stored vaccines

        2018         385 million
                                                                                                     40
        2019         358 million                                                                   million

        2020         318 million

                     ▪ Significant increase in rural energy access that can provide energy for fans or refrigerators
                     ▪ Positive trend in electrification, with major improvements in India
                     ▪ Increased vulnerability in Bangladesh and Angola
Source: SEforALL analysis, Chilling prospects 2020
All maps were produced by SEforALL and they are based on the UN Map of the World, which can be found here: https://www.un.org/Depts/Cartographic/map/profile/world.pdf
The boundaries, colors, denominations and any other information shown on these maps do not imply, on the part of SEforALL, any judgment on the legal status of any territory or any endorsement or acceptance of such boundaries.
TRENDS IN COOLING ACCESS | POPULATION AT HIGHEST RISK
URBAN POOR: APPROXIMATELY 699 MILLION
• May have some access to electricity, but live in housing of poor quality
• May have a refrigerator, but food often spoils due to intermittent power
2018 662 million
18
2019 681 million million
2020 699 million
▪ Continued urbanization and fast-growing cities in Asia and Africa
▪ Alarming trend in countries where more than 50% of urban population is at risk
(Bangladesh, Cambodia, Yemen)
Source: SEforALL analysis, Chilling prospects 2020
All maps were produced by SEforALL and they are based on the UN Map of the World, which can be found here: https://www.un.org/Depts/Cartographic/map/profile/world.pdf
The boundaries, colors, denominations and any other information shown on these maps do not imply, on the part of SEforALL, any judgment on the legal status of any territory or any endorsement or acceptance of such boundaries.TRENDS IN COOLING ACCESS | POPULATION AT MEDIUM RISK
LOWER-MIDDLE INCOME: APPROXIMATELY 2.2 BILLION
• May purchase an affordable thus likely inefficient air conditioner or
refrigerator that raises energy consumption and GHG emissions
2018 2,263 million
26
2019 2,223 million million
2020 2,197 million
▪ Risk of purchasing less-sustainable cooling devices associated with income growth and lower
prices for entry-level units
Source: SEforALL analysis, Chilling prospects 2020
All maps were produced by SEforALL and they are based on the UN Map of the World, which can be found here: https://www.un.org/Depts/Cartographic/map/profile/world.pdf
The boundaries, colors, denominations and any other information shown on these maps do not imply, on the part of SEforALL, any judgment on the legal status of any territory or any endorsement or acceptance of such boundaries.TRENDS IN COOLING ACCESS | POPULATION AT LOW RISK
MIDDLE INCOME: APPROXIMATELY 1.4 BILLION
• May be able to afford a more efficient air conditioner or minimize its use;
• May move to energy efficient housing and working environments
2018 1,226 million
2019 1,323 million 97
million
2020 1,420 million
▪ Increased purchasing power and growth of an established middle class
▪ COVID-19 may challenge purchasing power in the future
Source: SEforALL analysis, Chilling prospects 2020
All maps were produced by SEforALL and they are based on the UN Map of the World, which can be found here: https://www.un.org/Depts/Cartographic/map/profile/world.pdf
The boundaries, colors, denominations and any other information shown on these maps do not imply, on the part of SEforALL, any judgment on the legal status of any territory or any endorsement or acceptance of such boundaries.TRENDS IN COOLING ACCESS | POPULATION AT RISK
3-Year Trend: High Impact Countries in Asia and the Middle East
Source: SEforALL analysis, Chilling prospects 2020TRENDS IN COOLING ACCESS | DIVERGING PATHWAYS IN CHINA AND INDIA
LOWER-MIDDLE INCOME POPULATION
Source: SEforALL analysis, Chilling prospects 2020TRENDS IN COOLING ACCESS | POPULATION AT RISK
3-Year Trend: High Impact Countries in Africa
Source: SEforALL analysis, Chilling prospects 2020SHARE OF POPULATION AT HIGHEST RISK 2020
Share of urban poor and rural poor combined, 2020
• Of the African countries identified as
high impact, 10 still have over 60
percent of their populations at
highest risk – Angola, Benin, Burkina
Faso, Djibouti, Guinea-Bissau, Liberia,
Malawi, Mali, Mozambique and Togo
• Overall, of the high-impact countries
in Africa, 45 percent of their total
populations are categorized as high
risk
All maps were produced by SEforALL and they are based on the UN Map of the World, which can be found here: https://www.un.org/Depts/Cartographic/map/profile/world.pdf
The boundaries, colors, denominations and any other information shown on these maps do not imply, on the part of SEforALL, any judgment on the legal status of any territory or any endorsement or acceptance of such boundaries.TRENDS IN COOLING ACCESS | POPULATION AT HIGHEST RISK
3-Year Trend: High Impact Countries in Latin America and the Caribbean
Source: SEforALL analysis, Chilling prospects 2020TRENDS IN COOLING ACCESS | POPULATION AT MEDIUM RISK
3-Year Trend: Urban Poor and Lower-Middle Income in Brazil (millions)
Source: SEforALL analysis, Chilling prospects 20201.02 billion remain at While energy access Changes in volume do
highest risk, compared lowers risk exposure, it not necessarily imply a
to 1.05 in 2019 and does not necessarily transition from one
1.1 billion in 2018. imply enhanced access population at risk to
to cooling. another.INDIA CASE STUDY Assessing Sub-national Cooling Vulnerabilities
TRENDS IN COOLING ACCESS | ASSESSING SUB-NATIONAL COOLING VULNERABILITIES IN INDIA

   The estimated annual AC sales is growing and closely follows the per capita income trends in India.

   The rural poor population at risk due to lack of access to cooling has decreased significantly over 5 years, while there is
   a slow but steady growth in both urban poor population and lower middle income.

Source: SEforALL analysis, Chilling prospects 2020
TRENDS IN COOLING ACCESS | ASSESSING SUB-NATIONAL COOLING VULNERABILITIES IN INDIA

     Average Cooling Degree Days (CDDs) in India                                                            •     There are have been 22,383 deaths due to heat wave incidents between
                                                                                                                  1992-2015.
                                                                                                            •     India’s average temperature increased by 0.7 °C between 1901 and 2018
                                                                                                                  and by the end of this century the average temperature is expected to rise
                                                                                                                  by 4.4°C - resulting in and estimated 42% increase in CDD.
                                                                                                            •     Currently only 18 percent of Indian households own a cooling system (air
                                                                                                                  conditioner or cooler) and of these, only 10 percent have an AC unit.

     Cooling Degree Days alone do not indicate risk to heat
     stress, and monthly temperature peaks are important to
     track, particularly in a warming planet.
Source: SEforALL analysis, Chilling prospects 2020
All maps were produced by SEforALL and they are based on the UN Map of the World, which can be found here: https://www.un.org/Depts/Cartographic/map/profile/world.pdf.
For India map, the dotted line represents approximately the Line of Control in Jammu and Kashmir by India and Pakistan. The final status of Jammu and Kashmir has not yet been agreed upon by the parties.
The boundaries, colors, denominations and any other information shown on these maps do not imply, on the part of SEforALL, any judgment on the legal status of any territory or any endorsement or acceptance of such boundaries.
TRENDS IN COOLING ACCESS | ASSESSING SUB-NATIONAL COOLING VULNERABILITIES IN INDIA
Factors used for risk assessment of India States
• The criteria include income, average
maximum temperature and CDDs, with
criteria to indicate the level of risk. Initially, a
Criteria to Determine Risk to Lack of Access to Cooling state is considered high risk if two or more
of the high-risk criteria are met.
• The initial rankings are then adjusted for
ownership of cooling appliances
(refrigerator, ACs and fans) to assess the
overall vulnerability of each state.
• States with fewer cooling appliances, high
average temperatures (or CDDs) and low
income will have a higher risk than states
with more cooling appliances, lower
temperatures (or CDDs) and relatively higher
incomes.
Source: SEforALL analysis, Chilling prospects 2020TRENDS IN COOLING ACCESS | ASSESSING SUB-NATIONAL COOLING VULNERABILITIES IN INDIA
Results of risk assessment:
• 14 states (including 1 union territory) that have over
815 million people at high risk
• 9 states that have over 300 million people at
medium risk
• 7 states (including 1 union territory) that have over
27 million people at low risk
• Bihar, Jharkhand and Uttar Pradesh are 3 states with
highest risk to lack of access to cooling
Source: SEforALL analysis, Chilling prospects 2020
All maps were produced by SEforALL and they are based on the UN Map of the World, which can be found here: https://www.un.org/Depts/Cartographic/map/profile/world.pdf.
For India map, the dotted line represents approximately the Line of Control in Jammu and Kashmir by India and Pakistan. The final status of Jammu and Kashmir has not yet been agreed upon by the parties.
The boundaries, colors, denominations and any other information shown on these maps do not imply, on the part of SEforALL, any judgment on the legal status of any territory or any endorsement or acceptance of such boundaries.COOLING FOR ALL AND COVID-19
CHILLING PROSPECTS 2020 | COOLING FOR ALL AND COVID-19

      Challenges in vaccine delivery before and during the pandemic

                                                                                                        • In 2018, DPT3 vaccine coverage was
                                                                                                          86%, and only 76% in Africa

                                                                                                        • Of the 10 countries that account for
                                                                                                          60% of unvaccinated children, five are
                                                                                                          in the critical nine for access to cooling

Source: SEforALL analysis, Chilling prospects 2020, GAVI, Measles and Rubella Initiative, UNICEF, WHO
CHILLING PROSPECTS 2020 | COOLING FOR ALL AND COVID-19
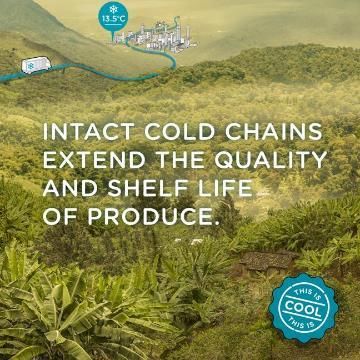
Cold chain to deliver a vaccine
• Only 10 percent of health facilities in Gavi-supported countries were equipped with the recommended cold chain
equipment
• Unreliable electricity access further compounds the challenge of powering cold chain. Across Sub-Saharan Africa
only 28% of healthcare facilities enjoy the reliable electricity supply
• Other challenges include transport and delivery capacity at the last mile and communications challenges with
vaccine campaigns
Source: SEforALL analysis, Chilling prospects 2020, COVID Vaccine Tracker, World BankCHILLING PROSPECTS 2020 | COOLING FOR ALL AND COVID-19
Nutritional preferences
• Nutritional preferences in Asia favour fresh foods
that require cold chain
• In India, for example, 34 percent of households
reported that they now anticipate spending 20
percent of their income or more on fresh food than
they did prior to the pandemic, with that number
increasing to 52 percent after
Malnourishment Nutritional preferences and food loss due to lack of cold chain
Prior to the pandemic, 135 million people, including 73 million in Africa, were facing crisis or emergency levels of food
insecurity
In poor countries, calories from nutritious foods are often as much as 10-times more expensive than cereals or grains in
caloric terms, and vulnerable groups typically prioritize less nutritious foods with higher caloric value when income is
reduced
Should the pandemic produce a reduction on global GDP between 2 percent and 10 percent, the number of
undernourished people in net-food importing countries could increase from 14.4 to 80.3 million
Source: SEforALL analysis, Chilling prospects 2020, McKinsey & Company, Food Security Information Network, FAOCHILLING PROSPECTS 2020 | COOLING FOR ALL AND COVID-19
Finding social distance as temperatures rise
• On 28 April 2020, at the height of the pandemic, Delhi recorded its highest temperature of the year at
43.7°C, eclipsing the previous hottest day of 42.1°C five days earlier on April 23
• Later in May, nearly 80 migrant workers in India died of starvation or heat stress while moving from
crowded cities to their home villages
• Many vulnerable groups are susceptible to both heat stress and COVID-19
• Inhabitants of dense urban centres with limited green space have amongst the worst COVID-19
outcomes due to pre-existing exposure to air pollution and high rates of non-communicable diseases
• Inhabitants of slums and informal urban settlements will not be able to stay indoors during a heatwave
due to an inability to cool their homes
Source: SEforALL analysis, Chilling prospects 2020, Global Heat Health Information NetworkTHE PRODUCTIVITY PENALTY
CHILLING PROSPECTS 2020 | THE PRODUCTIVITY PENALTY

     It will be developing economies, and the sectors that support their growth, that face the most significant
     productivity penalty due to a lack of access to sustainable cooling, in particular:
     • Outdoor and migrant works, who are more vulnerable than others
     • Women, who make up 50% of the agricultural labour force in Sub-Saharan Africa, but face a wage gap of
         15-60%

                                                                                                                                  In 2019 ILO estimated that by 2030 the global
                                                                                                                                  economy would suffer lost productivity worth
                                                                                                                                  USD 2.4 trillion annually due to heat stress,
                                                                                                                                  the equivalent of 80 million full-time jobs.
                                                                                                                                  • 73.7 million jobs will be lost in high impact
                                                                                                                                     countries for access to cooling
                                                                                                                                  • The critical nine countries for access to
                                                                                                                                     cooling account for 57.6 million job losses

Source: International Labour Organization (ILO), Chilling prospects 2020
All maps were produced by SEforALL and they are based on the UN Map of the World, which can be found here: https://www.un.org/Depts/Cartographic/map/profile/world.pdf
The boundaries, colors, denominations and any other information shown on these maps do not imply, on the part of SEforALL, any judgment on the legal status of any territory or any endorsement or acceptance of such boundaries.
CHILLING PROSPECTS 2020 | THE PRODUCTIVITY PENALTY
Productivity losses
• Across 54 high impact countries,
the estimated annual economic
loss due to heat stress is currently
USD 630 billion
• In the critical nine for access to
cooling, the annual economic loss
is USD 517.5 billion
In GDP per capita terms, 23 high-impact countries
already exhibit losses over USD 100
Source: International Labour Organization (ILO), Chilling prospects 2020
All maps were produced by SEforALL and they are based on the UN Map of the World, which can be found here: https://www.un.org/Depts/Cartographic/map/profile/world.pdf
The boundaries, colors, denominations and any other information shown on these maps do not imply, on the part of SEforALL, any judgment on the legal status of any territory or any endorsement or acceptance of such boundaries.CHILLING PROSPECTS 2020 | THE PRODUCTIVITY PENALTY
Case study: Nigeria’s agricultural Indicators of a lack of access to cooling
sector
• Strong preference for sale of crops locally and
through informal channels
• Low energy access rates that enable access to
electrical cooling
• Nigeria relies on agriculture for
66.5% of GDP
• 80% of farmers are smallholder
• 3.36% annual productivity loss
due to heat in the sector
• 31% of rural Nigerians have
access to basic electricity services
Markets and Income for Smallholder Farmers in Nigeria in 2013
Source: Chilling prospects 2020, Sabo et al (2017), Tracking SDG 7, FAOSUSTAINABLE COOLING SOLUTIONS
ACCESS TO COOLING | FROM COOLING NEEDS ASSESSMENT TO SOLUTIONS

                                         COOLING SOLUTION APPROACH FOR OPTIMIZATION

                                                                                      FOUR COOLING FOR ALL - COOLING SOLUTION PILLARS
 THREE COOLING FOR ALL - COOLING NEEDS
ACCESS TO COOLING | COOLING FOR ALL NEEDS
ACCESS TO COOLING | COOLING SOLUTION APPROACH FOR OPTIMIZATION
ACCESS TO COOLING | COOLING FOR ALL SOLUTIONS PILLARS
ACCESS TO COOLING | COOLING FOR ALL TECHNOLOGY SOLUTIONS

 Nature-based and passive technology solutions include a combination of traditional or indigenous low-tech and
 modern high-tech solutions.
ACCESS TO COOLING | COOLING FOR ALL TECHNOLOGY SOLUTIONS

 Active technology sustainable cooling solutions are a much wider group of solutions that range from a simple fan
 to a large district cooling system. Each technology has a range of achievable sustainability, and those technologies
 that are more efficient and have a smaller emissions impact are often more sustainable than others.

 See the Centre for Sustainable Cooling Technology Landscape website for a broader list of technology types.
ACCESS TO COOLING | COOLING FOR ALL SERVICES SOLUTIONS

 Preparational services, including fundamental education, skills development and project services, are key to
 improving behaviour and long-term decision-making on cooling.
ACCESS TO COOLING | COOLING FOR ALL SERVICES SOLUTIONS

 Operational services include the direct operation of cooling services, the management that supports cooling
 services and the maintenance that ensures that cooling services and technologies are operating sustainably.
ACCESS TO COOLING | COOLING FOR ALL POLICY SOLUTIONS

  Regulatory Policies

 Regulatory policies can be one of the most effective measures but are often the hardest to adopt and implement,
 depending on the cultural context and enforcement procedures. While regulatory policies are often difficult to
 enforce when they are initially created, having the policy in place can support common understanding of what is
 more sustainable.
ACCESS TO COOLING | COOLING FOR ALL POLICY SOLUTIONS

 Information policies, including the use of voluntary information disclosure, certification, labels that indicate the
 level of sustainability, voluntary standards, and awareness-raising campaigns that inform people about cost-
 effective sustainable solutions enable more sustainable behaviour and support better decision-making.
ACCESS TO COOLING | COOLING FOR ALL POLICY SOLUTIONS

 Incentive policies can include both financial and non-financial incentives. While many first consider financial
 incentives to encourage people to purchase sustainable technologies or services, it is often the non-financial
 incentives that can be more sustainably delivered and achieve results. These policies should be considered in
 collaboration with the financial solutions that can enable private investment in sustainable solutions.
ACCESS TO COOLING | COOLING FOR ALL FINANCIAL SOLUTIONS
ACCESS TO COOLING | COOLING FOR ALL FINANCIAL SOLUTIONS

 Fiscal solutions enable governments to influence decisions and can entail either income or expense for the
 government.
ACCESS TO COOLING | COOLING FOR ALL FINANCIAL SOLUTIONS

 Funding solutions, such as grants or rebates, can be expensive compared to the total impact received, when
 compared to finance solutions that directly recoup the funds used to support the purchase of more sustainable
 cooling technologies or services.
ACCESS TO COOLING | COOLING FOR ALL POLICY SOLUTIONS

  Regulatory Policies
ACCESS TO COOLING | TOWARDS THE SOLUTIONS ASSESSMENT TOOLKIT

                                         COOLING SOLUTION APPROACH FOR OPTIMIZATION

                                                                                      FOUR COOLING FOR ALL - COOLING SOLUTION PILLARS
 THREE COOLING FOR ALL - COOLING NEEDS
#ThisIsCool
CAMPAIGN
Over 1 billion people lack access to sustainable cooling and a further 2.2 billion have
inefficient cooling. In a warming world, access to sustainable cooling is not a luxury.
It is an issue of equity and a service that must be delivered to everyone.
This Is Cool is a campaign to show what can be done across the world to make
sustainable cooling a reality.
#ThisIsCoolSIMPLE ACTIONS YOU CAN TAKE TODAY
1. Rethink your approach to cooling
Our resources include tools and assets to help you reconsider your cooling choices
to improve lives, reduce emissions and be more efficient.
2. Learn why sustainable cooling is so important
Ensure you know why sustainable cooling matters and understand why it is so
important to build a stronger, more resilient world.
3. Spread the word with the campaign
Use our toolkit to start a conversation about the importance of sustainable cooling
for all and the impact it will have on high risk communities across the world.
thisiscool.seforall.org #ThisIsCool#ThisIsCool
Go to
thisiscool.seforall.org
#ThisIsCoolWITH SPECIAL THANKS TO OUR FUNDERS & SUPPORTERS
Thank you
 Q&A

Vienna Office                                  Washington, D.C. Office      coolingforall@seforall.org
Andromeda Tower, 15th Floor                    1750 Pennsylvania Ave. NW
Donau City Strasse 6 – 1220, Vienna, Austria   Washington, DC 20006, USA
Telephone: +43 676 846 727 200                 Telephone: +1 202 390 0078      www.SEforALL.org
Thank you
 THANK  YOU!

Vienna Office                                  Washington, D.C. Office
Andromeda Tower, 15th Floor                    1750 Pennsylvania Ave. NW
Donau City Strasse 6 – 1220, Vienna, Austria   Washington, DC 20006, USA
Telephone: +43 676 846 727 200                 Telephone: +1 202 390 0078   www.SEforALL.org
You can also read