SHELL MODIFIED AND IMPROVED REDLICH-KWONG (SMIRK) & HENRY'S COEFFICIENTS - A proposed reconciliation between Chemical and Environmental Engineers
←
→
Page content transcription
If your browser does not render page correctly, please read the page content below

SHELL MODIFIED AND IMPROVED
                          REDLICH-KWONG (SMIRK) & HENRY'S
                          COEFFICIENTS

                          A proposed reconciliation
                          between Chemical and
                          Environmental Engineers

                       Steve Bolman P.E.
                       Senior Water Process Engineer

Copyright 2016 Shell Global Solutions (US) Inc.             January 2016   1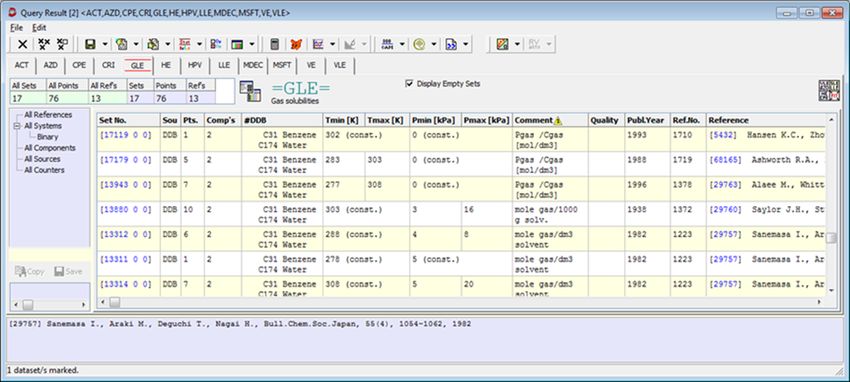
DEFINITIONS & CAUTIONARY NOTE

Reserves: Our use of the term “reserves” in this presentation means SEC proved oil and gas reserves.
Resources: Our use of the term “resources” in this presentation includes quantities of oil and gas not yet classified as SEC proved oil and gas reserves. Resources are consistent
with the Society of Petroleum Engineers 2P and 2C definitions.
Organic: Our use of the term Organic includes SEC proved oil and gas reserves excluding changes resulting from acquisitions, divestments and year-average pricing impact.
Resources plays: Our use of the term ‘resources plays’ refers to tight, shale and coal bed methane oil and gas acreage.
The companies in which Royal Dutch Shell plc directly and indirectly owns investments are separate entities. In this presentation “Shell”, “Shell group” and “Royal Dutch Shell”
are sometimes used for convenience where references are made to Royal Dutch Shell plc and its subsidiaries in general. Likewise, the words “we”, “us” and “our” are also used
to refer to subsidiaries in general or to those who work for them. These expressions are also used where no useful purpose is served by identifying the particular company or
companies. ‘‘Subsidiaries’’, “Shell subsidiaries” and “Shell companies” as used in this presentation refer to companies in which Royal Dutch Shell either directly or indirectly has
control. Companies over which Shell has joint control are generally referred to as “joint ventures” and companies over which Shell has significant influence but neither control nor
joint control are referred to as “associates”. The term “Shell interest” is used for convenience to indicate the direct and/or indirect ownership interest held by Shell in a venture,
partnership or company, after exclusion of all third-party interest.

This presentation contains forward-looking statements concerning the financial condition, results of operations and businesses of Royal Dutch Shell. All statements other than
statements of historical fact are, or may be deemed to be, forward-looking statements. Forward-looking statements are statements of future expectations that are based on
management’s current expectations and assumptions and involve known and unknown risks and uncertainties that could cause actual results, performance or events to differ
materially from those expressed or implied in these statements. Forward-looking statements include, among other things, statements concerning the potential exposure of Royal
Dutch Shell to market risks and statements expressing management’s expectations, beliefs, estimates, forecasts, projections and assumptions. These forward-looking statements are
identified by their use of terms and phrases such as ‘‘anticipate’’, ‘‘believe’’, ‘‘could’’, ‘‘estimate’’, ‘‘expect’’, ‘‘intend’’, ‘‘may’’, ‘‘plan’’, ‘‘objectives’’, ‘‘outlook’’, ‘‘probably’’,
‘‘project’’, ‘‘will’’, ‘‘seek’’, ‘‘target’’, ‘‘risks’’, ‘‘goals’’, ‘‘should’’ and similar terms and phrases. There are a number of factors that could affect the future operations of Royal
Dutch Shell and could cause those results to differ materially from those expressed in the forward-looking statements included in this presentation, including (without limitation):
(a) price fluctuations in crude oil and natural gas; (b) changes in demand for Shell’s products; (c) currency fluctuations; (d) drilling and production results; (e) reserves estimates;
(f) loss of market share and industry competition; (g) environmental and physical risks; (h) risks associated with the identification of suitable potential acquisition properties and
targets, and successful negotiation and completion of such transactions; (i) the risk of doing business in developing countries and countries subject to international sanctions; (j)
legislative, fiscal and regulatory developments including potential litigation and regulatory measures as a result of climate changes; (k) economic and financial market conditions
in various countries and regions; (l) political risks, including the risks of expropriation and renegotiation of the terms of contracts with governmental entities, delays or
advancements in the approval of projects and delays in the reimbursement for shared costs; and (m) changes in trading conditions. All forward-looking statements contained in
this presentation are expressly qualified in their entirety by the cautionary statements contained or referred to in this section. Readers should not place undue reliance on forward-
looking statements. Additional factors that may affect future results are contained in Royal Dutch Shell’s 20-F for the year ended 31 December, 2015 (available at www.shell.com/
investor and www.sec.gov ). These factors also should be considered by the reader. Each forward-looking statement speaks only as of the date of this presentation, 27 January,
2016. Neither Royal Dutch Shell nor any of its subsidiaries undertake any obligation to publicly update or revise any forward-looking statement as a result of new information,
future events or other information. In light of these risks, results could differ materially from those stated, implied or inferred from the forward-looking statements contained in this
presentation. There can be no assurance that dividend payments will match or exceed those set out in this presentation in the future, or that they will be made at all.

We use certain terms in this presentation, such as discovery potential, that the United States Securities and Exchange Commission (SEC) guidelines strictly prohibit us from
including in filings with the SEC. U.S. Investors are urged to consider closely the disclosure in our Form 20-F, File No 1-32575, available on the SEC website www.sec.gov. You
can also obtain this form from the SEC by calling 1-800-SEC-0330.

Copyright 2016 Shell Global Solutions (US) Inc.                                                                                                                    January 2016
AGENDA

§      Why Henry’s – Why SMIRK, Why care?
§      Dortmund Data Bank (DDB) – A brief introduction
§      Fit for Purpose Equation of State (EoS) selection, analysis using
       Henry’s Constants and Comparison with Dortmund Data Bank
       (DDB)
     §           Extract data from UniSim
     §           Plot with DDB Data and, available model or curve fit.
     §           Roberto Fernandez-Prini, Jorge L. Alvarez, Allan H. Harvey
§      Summarize and work and example
§      Discuss results

Copyright 2016 Shell Global Solutions (US) Inc.                          January 2016   3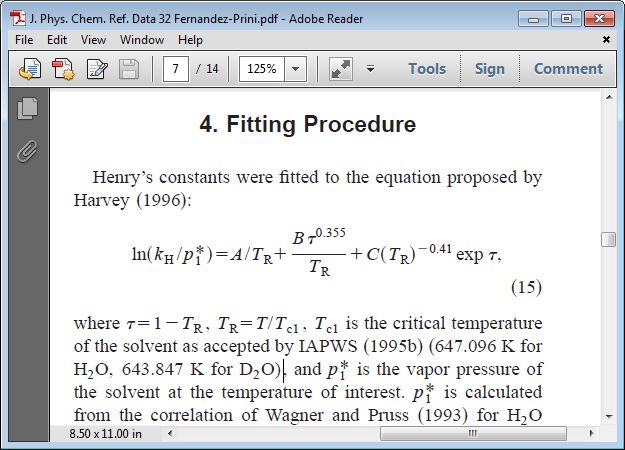
WHY HENRY’S – WHY SMIRK (PROBLEM STATEMENT)

§      OLI is frequently the only available thermodynamic model (EoS)
       that adequately addresses electrolytic species in aqueous solutions.
§      Upstream facilities design is concerned with partitioning of
       components across phases (water/oil/vapor). It is proposed to use
       Henry’s Law to bridge the gap between, “Best of Breed” models.
       Here SMIRK will be presented, but any available EoS could be used
       to model the other phases.

§      Example: 250 mg/L H2S in a Produced Water at 85°C, pH = 7.8
§      Model the aqueous system to determine partial pressure via
       Henry’s; then align the mass balance such that the EoS for the oil
       and vapor may partition the remaining H2S between them...

§      We will start our discussion by reviewing the body of experimental
       data as this should serve as the final arbiter of ‘performance’.
Copyright 2016 Shell Global Solutions (US) Inc.                  January 2016   4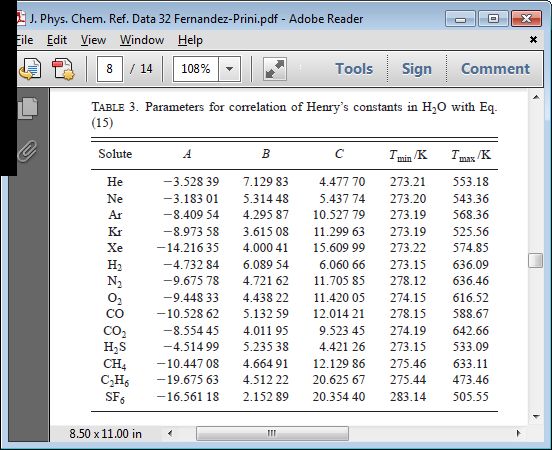
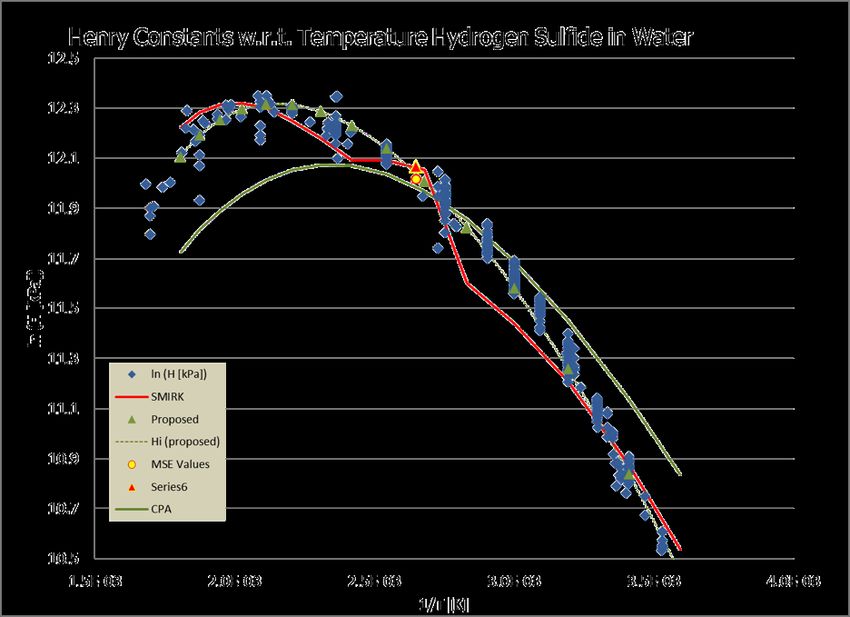
SMIRK + EXPERIMENTAL DATA + PROPOSED MODEL

                                                        Plotting alongside
                                                        experimental data
                                                     (Dortumund Data Bank)
                                                    Allows the SMIRK (or any
                                                  EoS) and “Proposed” model
                                                   to be reviewed for ‘best fit’

Copyright 2016 Shell Global Solutions (US) Inc.                    January 2016   5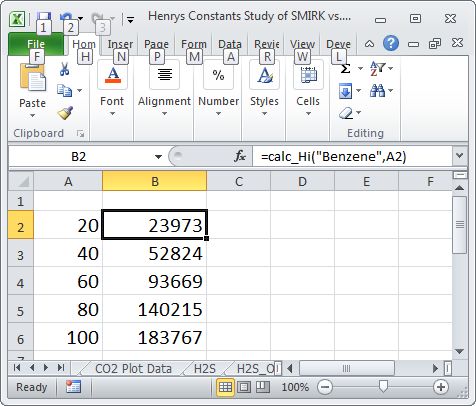
1.0
                            SECTION ONE

                            Dortmund Data Bank (DDB)
                            An Excellent and Under Utilized Tool

Copyright 2016 Shell Global Solutions (US) Inc.                    January 2016   6
DORTMUND DATA BANK (DDB)
Anyone who had to visit the “Chemical Abstracts” room in their
University should LOVE this.
Enter the Species…
Water
Benzene
Select Databases
Run Search (Exact Match)
For information contact:
DDBST GmbH
http://www.ddbst.com/
Copyright 2016 Shell Global Solutions (US) Inc. January 2016 7DDB - QUERY RESULT
Simplicity Itself!
Note the tabs separate query results by database
ACT | AZD | CRI | GLE (we are interested in GLE “Gas Solubility”)
A full discussion of DDB is for and worth another day
Copyright 2016 Shell Global Solutions (US) Inc. January 2016 8DATA MAY BE PLOTTED WITHIN DDB
§ Super Simple
§ Select Results
§ Click Print
MIND the
UNITS
NOTE “H12” should be
read; the “H” for
component (1) Benzene
& (2) water per à
Copyright 2016 Shell Global Solutions (US) Inc. January 2016 92.0
SECTION TWO
Fit for Purpose EoS Selection and Analysis using Henry’s
Constants and Dortmund Data Bank (DDB)
Copyright 2016 Shell Global Solutions (US) Inc. January 2016 10EQUATIONS OF STATE
§ Many EoS to choose from in the UniSim Package:
BWRS GCEOS Glycol Specific EOS
Kabadi-Danner Lee-Kesler-Plocker MBWR
Peng-Robinson PR-Twu PRSV
Sour PR Sour SRK SRK
SRK-Twu Twu-Sim-Tassone Zudkevich-Joffee
§ “Shell Modified Redlich Kwong” (SMIRK) is a Shell specific EoS,
included as part of SPPTS_USD Fluid Property Package.
§ Electrolyte modelling may be performed using the OLI Electrolyte
Fluid Package, within this Package there are two models AQ and
MSE.
§ One of the objectives of this discussion is to provide tools to aid
assessing which of the above are the MOST “fit for purpose”.
Copyright 2016 Shell Global Solutions (US) Inc. January 2016 11STRIKING A BALANCE IN EOS SELECTION As a Water Process Engineer, I am interested primarily in aqueous phase composition and properties, and less concerned with prediction of vapour or hydrocarbon phase composition resulting from a specific process. For this reason I would like to select a model that will yield the most realistic and reliable results for the water phase. EoS models must address all phases and all components to be modelled; this comprehensive nature requires compromises in the quality of the prediction across phases. Henry’s “law” sits on the other side of this Complexity Balance, specific to a binary (i.e. solvent, solute) with only two phases (i.e. liquid and vapour) and one “condition” -- equilibrium. When these conditions may be assumed; it may well be that a Henry’s model outperforms EoS models. Copyright 2016 Shell Global Solutions (US) Inc. January 2016 12
HENRY’S “LAW” – MORE LIKE A GUIDELINE
§      Applies to binary systems of low solute concentrations.
§      Henry’s constants are dimensioned and this causes many errors
§      Variation in published values requires critical assessment and
       selection
§      Strongly dependent on Temperature
§      The Henry’s concept – “Concentration of solute in solution is
       linearly proportional to its partial pressure or concentration in the
       vapor phase”
§      There’s no constancy in
           Henry’s “Constants”!

Copyright 2016 Shell Global Solutions (US) Inc.                    January 2016   13
THE UNISIM INTERFACE AND THE MODEL USED
§ The temperature of each stream (Blue Arrow) is shown (e.g. 040 =
40°C).
§ A series of Heat Exchangers (E-100..E104-3) has been used to
affect temperature change from stream to stream.
§ Each stream is specified at “Bubble Point” and the EoS sets the
pressure.
§ Liquid Phase concentration of solute is everywhere 1.0 ppm (molar)
Copyright 2016 Shell Global Solutions (US) Inc. January 2016 14EOS CALCULATED VALUES ARE IMPORTED INTO UNISIM “SPREADSHEET” OBJECT An internal “Spreadsheet” object is used to complete the calculation of Henry’s Constants from “Imported Values” (Binary System) § Total Pressure “A” § Mole Fraction Water in Vapour Phase = “B” § Partial Pressure of species “ i “ is calculated “C” = A * (1 - B) Copyright 2016 Shell Global Solutions (US) Inc. January 2016 15
EOS CALCULATED VALUES ARE IMPORTED INTO
UNISIM “SPREADSHEET” OBJECT (CONTINUED)

§ Henry’s “Constant” calculated as kPa “D”

§ Stream Temperature is imported for reference, shown Blue because
     it is a “Specified” property for the UniSim Stream Object.
§ Temperature will be plotted as 1/T[K] “F” (convention) and allows
     best visual representation of data vs. natural log of Henrys “G”
§ Molar concentration of Solute in vapour “H” is calculated (1-B)

Copyright 2016 Shell Global Solutions (US) Inc.                   January 2016   16
HENRY’S CONSTANTS AND VAPOR–LIQUID DISTRIBUTION CONSTANTS FOR GASEOUS SOLUTES IN H2O HIGH TEMPS Paper by: Roberto Fernandez-Prini Jorge L. Alvarez Allan H. Harvey Equation 15 is used, with coefficients A, B and C resulting from a Curve Fit from excel based on SMIRK (or any other EoS) in UniSim. Copyright 2016 Shell Global Solutions (US) Inc. January 2016 17
PUBLISHED TABLE FOR PARAMETERS

The above referenced paper
Includes Parameters for use in
Equation 15.

The interest here is to align with
SMIRK and the DDB database,
we will be obtaining modified
parameters and obtaining
parameters for species not studied
in the reference (benzene).

Copyright 2016 Shell Global Solutions (US) Inc.   January 2016   18
CURVE FITTING THE DATA IN EXCEL –
IMPORT THE SMIRK DATA INTO A NAMED RANGE

             Benzene                              Ethylbenzene                 Toluene                    p-Xylene
       yi (T)   Hi (T) [kPa]                  yi (T)    Hi (T) [kPa]    yi (T)     Hi (T) [kPa]    yi (T)     Hi (T) [kPa]
      1.41E-02     12396                     4.05E-02      36770       2.43E-02       22653       4.22E-02       38620
      1.06E-02     25134                     0.028175      68300       1.72E-02       42813       2.79E-02       67527
      7.04E-03     52774                     1.98E-02     150708       1.01E-02       78808       0.016854      127622
      4.43E-03     89436                     1.28E-02     261794       6.18E-03      128425       9.33E-03      189473
      2.89E-03 138530                        7.90E-03     380153       3.65E-03      178768       5.06E-03      242744
      1.79E-03 183257                        4.61E-03     472300       2.21E-03      228553       2.75E-03      280769
      1.09E-03 217204                        2.71E-03     540867       1.28E-03      257440       1.49E-03      298264
      6.48E-04 234639                        1.54E-03     557109       7.36E-04      266476       8.13E-04      294176
      3.81E-04 235443                        8.56E-04     528781       4.16E-04      257007       4.40E-04      271500
      2.24E-04 223883                        4.68E-04     467633       2.35E-04      234468       2.36E-04      236372
      1.33E-04 205576                        2.52E-04     390593       1.33E-04      205619       1.27E-04      196398
      8.01E-05 185047                        1.36E-04     313269       7.62E-05      176048       6.85E-05      158201
      4.95E-05 164996                        7.36E-05     245576       4.47E-05      149115       3.77E-05      125735
      3.13E-05 146642                        4.08E-05     191226       2.69E-05      126195       2.14E-05      100198
      2.92E-05 187324                        2.33E-05     149821       1.67E-05      107407       1.26E-05       81052
Copyright 2016 Shell Global Solutions (US) Inc.                                                                January 2016   19
CURVE FITING THE DATA IN EXCEL Currently an Excel Solver is used to produce the 3 parameter curve fit using the Harvey model (Equation 15, above). Parameters are then manually tweaked to provide a “best fit” in Visual Basic (VBA). Copyright 2016 Shell Global Solutions (US) Inc. January 2016 20
VISUAL BASIC FOR APPLICATIONS (VBA)
FUNCTION FOR EXCEL
    ‘You may recognize the code below as “Eq’n 15”

    calc_Hi = Exp(A / TsubR + B * tao ^ 0.355 / TsubR + C * (TsubR ^ -0.41)
             * Exp(tao) + Log(calc_VaporPressure(T_K)))

Species Name Array                                Parameter “A” Array (B & C similar)
arrayName(0) = "Benzene"                          arrayA(0) = -20.3847017802832
arrayName(1) = "Toluene“                          arrayA(1) = -20.7150855508872
:                                                 :
:                                                 :
arrayName(11) = "Nitrogen"                        arrayA(11) = -9.67578
arrayName(12) = "Oxygen"                          arrayA(12) = -9.44833
arrayName(13) = "Carbon Monoxide"                 arrayA(13) = -10.52862
arrayName(14) = "Carbon Dioxide"                  arrayA(14) = -8.55445
arrayName(15) = "Hydrogen Sulfide"                arrayA(15) = -4.51499

Copyright 2016 Shell Global Solutions (US) Inc.                            January 2016   21
USAGE IN EXCEL VBA “Function” callout… Function calc_Hi(name As String, T As Double) 'T is in °C Lookup value in arrayName to find index = “i” arrayName(0) = "Benzene“ Here index – i = 0 Then use A = arrayA(i) B = arrayB(i) C = arrayC(i) Use A, B & C in equation, Function returns result! Copyright 2016 Shell Global Solutions (US) Inc. January 2016 22
SMIRK – Dortmund Data Bank (DDB) and Proposed
 Model

                                   TC = 100.4 °C

                                                   TC = 31.1 °C
Copyright 2016 Shell Global Solutions (US) Inc.                   January 2016   23
AN EXAMPLE OF WHERE SMIRK HAS NOT BEEN
TUNED
AMMONIA
TC = 132.2 °C
Copyright 2016 Shell Global Solutions (US) Inc. January 2016 24PUTTING IT ALL TOGETHER IN A ‘MANUAL CALCULATION’ AND COMPARISON WITH “BEST OF BREED”. Example: 250 mg/L H2S in a Produced Water at 85°C, pH = 7.8 13.3 mg/L volatile H2S (M.W. 34.1 ) + 236.8 mg/L sodium bisulfide Henry’s PPi = Hi xi HH2S = 143,658 (kPa) xH2S = 7.0 ppm PPH2S = 1.01 (kPa) USim-PR = 1.05 (kPa) SMIRK = 0.79 (kPa) Copyright 2016 Shell Global Solutions (US) Inc. January 2016 25 OLI-MSE = 0.87 (kPa)
Thank you for your kind
                            attention

                            Q&A

Copyright 2016 Shell Global Solutions (US) Inc.       January 2016   26
SUMMARY
n Validating EoS data against real experimental data is a check
against;
n Misconfigured EoS, or incorrectly selected EoS.
n Provides supporting justification if (when) EoS parameters are
‘updated’ by others. This can cause significant variance in results.
n A tool (DDB) is available to make data gathering a simple,
pleasurable and highly time efficient activity.
n Henry’s “Law” can present challenges, but if WE work together, the
tools and knowledge can be expanded and deepened. Henry’s
provides an intuitive framework that enlightens us as to (if this
changes, that will…).
n We expect EoS equations to predicts all phases, all conditions, rates,
speciation… We want it all! Then we are shocked when we were
Copyright 2016 Shell Global Solutions (US) Inc. January 2016 27
lied to.You can also read