GLOBAL FREIGHT FLOWS AFTER COVID-19: WHAT'S NEXT? - MCKINSEY
←
→
Page content transcription
If your browser does not render page correctly, please read the page content below
Travel, Logistics & Transport Infrastructure Practice

            Global freight flows
            after COVID-19:
            What’s next?
            COVID-19 will likely affect trade more profoundly than any other
            recent crisis. Leaders with a well-informed perspective on potential
            trade scenarios can begin their recovery from a position of strength.

            by Jeff Condon, Sven Gailus, Florian Neuhaus, and Maite Peña-Alcaraz

                                                                                   ©ake1150sb/Getty Images

July 2020
As we witness the global health community’s A deeper, more prolonged impact on
remarkably determined response to COVID-19, trade than previous crises
we have also observed actors in every area of Our recent research with the McKinsey Global
the economy react to the current challenges with Institute estimates that global unconstrained
innovation. Global logistics is no exception. The trade demand could drop by as much as 13 to
pandemic will very likely hit global trade deeper and 22 percent in the second and third quarters of
for longer than we have seen in other crises of the 2020. By contrast, the largest quarterly decline
recent past. The extent of the disruption will vary in trade volumes during the global financial crisis
by commodity, trade lane, and mode of transport, of 2008 was around 5 percent. The estimates
and it will be steered by local differences in the for global trade development are rooted in nine
crisis’s severity. The nuanced nature of the crisis scenarios, developed by McKinsey in partnership
yields opportunities for logistics and supply-chain with Oxford Economics, that model the different
companies: to enter new markets, innovate on new paths the global economy may follow,1 based on
service offerings, and position themselves against assumptions around the efficacy of both public-
competitors. A detailed understanding of the impact health and economic-policy responses as well as
of the crisis is vital for companies as they shift from how businesses and households react to these
thinking about emergency resolve and resilience to initiatives. Detailed supply-and-demand modeling
planning for the return. by commodity indicates that the effect on global
trade will be substantially larger than on global GDP
Using granular trade-flow modeling, companies (which, for comparison, is estimated to decline by
can understand their market position and risk 3 to 8 percent in 2020) and considerably longer. In
exposure in the context of how trade lanes and the scenarios modeled, trade volumes will take 15
commodities develop in the crisis. This approach to 48 months to recover to fourth-quarter 2019
should be combined with macroeconomic scenarios levels, and the value lost will be equivalent to 8 to
to develop and test strategies for crisis response, as 49 percent of total 2019 trade volume (Exhibit 1).
well as next steps after the crisis. Thinking through Trade and logistics companies are already feeling
the most likely scenarios and deducing which the consequences, with several road, air, and ocean
shifts in operational and commercial strategy are transport companies reporting large dips in volumes
therefore required will put companies ahead of the versus the same period last year.
curve as we go into the “next normal.”
1
For more on these scenarios, Sven Smit, Martin Hirt, Kevin Buehler, Susan Lund, Ezra Greenberg, and Arvind Govindarajan, “Safeguarding our
lives and our livelihoods: The imperative of our time,” March 23, 2020, McKinsey.com.
Using granular trade-flow modeling,
companies can understand their
market position and risk exposure
in the context of how trade lanes and
commodities develop in the crisis.
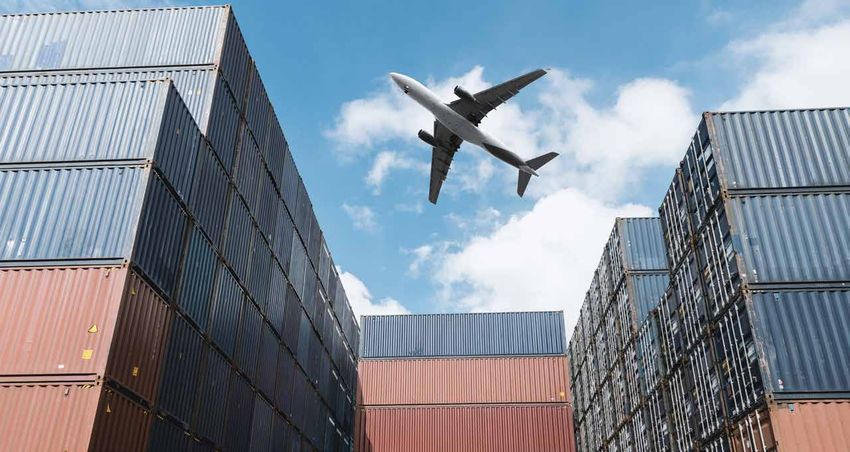
2 Global freight flows after COVID-19: What’s next?Exhibit 1
Global unconstrained trade demand could decline by 13 to
to 22
22 percent
percentin
in Q2
Q2 or
Q3Q3
or 2020, depending
2020, on macroeconomic
depending scenario.
on macroeconomic scenario.
Global unconstrained trade demand by macroeconomic scenario, tons, index (100 = Q4 2019)
Historical No COVID A32 A12 B22 Economic Depth of Length Total
scenario1 largest of demand
120
quarterly recovery loss,
decline, to 2019
% Q4 2019, volume,
110 ~months %
100 A3 –13 15 8
90 A1 –16 36 30
80
B2 –22 48 49
70
Global –5 18
2007 08 09 10 11 12 13 14 15 16 17 18 19 20 21 22 23 24
financial crisis
of 2008
Note: Preliminary results, as of June 1, 2020.
1
Include trade between countries, excluding intra-European (Central Asia, Eastern Europe, European Union, United Kingdom) trade.
2
A3: public health responses with rapid and effective control of the virus and partially effective economic interventions; A1: partially effective public health inter-
ventions and partially effective economic interventions; B2: partially effective public health interventions and ineffective economic interventions.
Source: IHS World Trade Service data; McKinsey COVID-19 Trade Flow Recovery Model; McKinsey analysis, in partnership with Oxford Economics
Differing impact by commodity, spending by consumers. On the other hand, the
geography, and mode trade volume of cereals (basic consumer staples) is
The impact of the crisis will vary significantly by likely to decline by no more than 5 percent. Supply
commodity, with the shape and duration of the will decrease only slightly because of the high
disruption determined by both supply shocks as degree of production automation and dispersed
economies undergo lockdowns and demand shocks supplier landscape, and the increase in demand for
due to the global economic downturn (Exhibit 2). at-home food consumption will make up for a fall in
out-of-home consumption.
For instance, in an effective health response and
partially effective economic interventions scenario The degree to which each mode of transport and
(scenario A1), the short-term trade volume of trade lane is affected depends on their particular
automobiles (expensive, durable goods) is expected commodity mix. When planning for the future,
to decline by more than 50 percent because of industry players should thus use insights from
factory shutdowns and decreased discretionary commodity-based modeling.
Global freight flows after COVID-19: What’s next? 3Exhibit 2
The size
The size of
of impact
impact and
and path
path of
of recovery could vary
recovery could varygreatly
greatlyacross
across commodity
commodity
groups, depending
groups, depending onon supply and demand
supply and demand shocks.
shocks.
Global unconstrained trade demand by commodity groups,
tons, index (100 = Q4 2019), Scenario A1
Highest impact
120
Agriculture and
food
110
Chemicals
100 Paper and forestry
products
90
Energy (especially
coal)1
80
Metals and mining
70 Other manufacturing
Machinery and
60 equipment
50 Apparel and textiles
Automotive and
40 transportation
2019 2020 2021 2022 2023 2024
Lowest impact
Share of sectors across modes, 2019
Contain- Dry bulk, Air Contain- Dry bulk, Air
erized sea, tons, % cargo, erized sea, tons, % cargo,
TEU,2 % tons, % TEU,2 % tons, %
Agriculture and 22 14 32 Other 7 2 16
food manufacturing
Chemicals 18 4 9 Machinery and 13 0 25
equipment
Paper and forestry 16 2 2
products Apparel and textiles 8 0 6
Energy (especially 1 32 0 Automotive and 5 0 3
coal)1 transportation
Metals and mining 12 47 7
Note: Analysis based on granular commodity breakdown; aggregation to groups of commodities illustrative; Preliminary results, as of June 1, 2020.
1
Oil and gas products not considered in sectors by their degree of disruption.
2
Twenty-foot equivalent units.
Source: IHS World Trade Service data; McKinsey COVID-19 Trade Flow Recovery Model; McKinsey analysis, in partnership with Oxford Economics
4 Global freight flows after COVID-19: What’s next?In scenario A1, for example, global unconstrained volumes, respectively. Within containerized cargo,
demand for air cargo will fall by 14 percent of pre- twenty-foot equivalent units (TEUs) will take a
crisis volumes in the second quarter of 2020 and will larger hit than tonnage, falling by 19 percent of pre-
not rebound to 2019 levels until around mid-2022. crisis volumes; this will likely result in both a larger
revenue impact and higher-than-average fuel cost
The demand drop for ocean transport will be about as containers are heavier on average than before
the same size, though the recovery may take slightly COVID-19.
longer. Within ocean transport, the drop will be
smaller for dry bulk than for containerized cargo, as The effect of the crisis on individual trade lanes
dry bulk carries commodities that are less affected will also vary significantly by country-specific
by the current crisis, such as agricultural goods. We COVID-19 development and by which commodities
expect dry bulk and containerized cargo tonnage are transported on that trade lane (Exhibit 3). In
to fall by 14 percent and 16 percent of pre-crisis containerized ocean trade, for example, the fall in
Exhibit 3
Original for
Demand equipment manufacturers
major containerized should
ocean provide convenient
twenty-foot equivalentsolutions forto
units (TEU)
public and private charging.
decline by 6 to 20 percent in Scenario A1.
Unconstrained trade demand change for ocean container,
2020 TEU, % of 2019 (Scenario A1)
Highest impact Lowest impact
Direction of trade (arrow
thickness indicates relative
volume of trade)
–13
–13
–20 –13
–20
–14
–8 –8
–13 –16 –14
–12
–6
–17
–12 –9 –9
–9
–18
–8
Key insights
For Asia-related trades, Asia exports to Europe North–south trade lanes
headhaul is impacted more and North America are are less impacted than
than backhaul. hardest hit. east–west ones.
Note: Preliminary results, as of June 1, 2020.
Global freight flows after COVID-19: What’s next? 5Bottom–up supply and demand models
can be used to adjust capacity and
focus commercial teams rapidly as the
shape of the recovery becomes clear.
demand in scenario A1 will vary from 6 percent on need to plan for and what playbooks would be
South American exports to Europe (which consist appropriate in each case.
mostly of agricultural products) to 20 percent on
some Asian exports (which predominately consist — Commercial strategy. Granular data can form the
of machinery and equipment). If public-health basis of an early-indication system that provides
responses allow for the rapid and effective control a real-time assessment of the most relevant
of the virus (scenario A3), then these declines scenario at any given time and flags short-term
may be limited to around 2 to 11 percent; they opportunities around sales-force focus, product
may be as high as 8 to 27 percent in the case of offerings, and pricing strategies.
ineffective economic interventions (scenario B2).
Across scenarios, the impact on Asian exports is — Operational strategy. Bottom–up supply and
likely to be larger than on Asian imports, and the demand modeling can be used to adjust capacity
impact on east–west trade lanes is likely to exceed and capital expenditure rapidly as the shape of
that on north–south lanes. This variance may be the recovery becomes clear.
founded both in the importing economies’ projected
recovery—for example, China’s economy, and An air or ocean freight forwarder that wants to
therefore its demand, is expected to recover faster position itself as strongly as possible for the
than that of Europe and the United States—and in recovery, for example, will need to know its own
the commodity mix. market share and performance against the market
for each trade lane and the shift in trade demand.
Its responses should be tailored accordingly:
Defining winning strategies where appropriate, it should scale back capacity
with granular trade insight commitments in hard-hit trade lanes in which it has
Now that most companies have managed many a large market share but redeploy sales teams to
of the crisis’ immediate challenges, they need to grow market share in resilient trade lanes where its
think about their return to the next normal. Data presence is currently small.
on the impact of the crisis for each commodity
and country—feeding up into impact per mode The same granular trade lane and commodity
of transport and trade lane—would be a hugely approach should also be used by ports to project
beneficial input into three processes that are crucial throughput to support capacity planning and
in navigating a path through the crisis: commercial strategy. For selected impact scenarios,
a port operator could model the projected impact
— Scenario development. A detailed, grounded of the crisis for both the top ten countries of origin
understanding of the factors that affect overall for trade imports and the top commodity groups
supply and demand would enable companies to for trade exports (Exhibit 4), and use this data to
develop their own view on which scenarios they formulate its commercial and operational strategy.
It may decide, for example, to manage capacity and
6 Global freight flows after COVID-19: What’s next?Exhibit 4
Ports can project throughput to support capacity planning and
Ports can project throughput to support capacity planning and
commercial strategy.
commercial strategy.
Trade import, top ten origins, tons, index (100 = Q4 2019), Scenario A1 Country 2020 vs
of origin 2019, %
100 India –27
South Korea –27
Japan –26
Turkey –25
China –24
Vietnam –22
Spain –19
Germany –18
Brazil –13
Indonesia –13
2019 2020 2021 2022 2023 2024
Trade export, by commodity, tons, index (100 = Q4 2019), Scenario A1 Commodity 2020 vs
group 2019, %
Automotive and trans-
portation equipment –26
Apparel and textiles –25
100
Machinery and
equipment –23
Other manufacturing –19
Metals and mining –14
Paper and
forestry products –13
Agriculture and food –12
Chemicals –10
2019 2020 2021 2022 2023 2024
Note: Preliminary results, as of June 1, 2020.
introduce flexible workforce planning until demand While business leaders are managing the disruption
recovers—or to use the slow periods for capital to their lives and livelihoods from the pandemic, they
expenditure or maintenance projects. Alternatively, must think about how to shape—and thrive within—
it could reach out to liners that offer a superior the next normal. The data, tools, and techniques
commodity or origin mix and offer attractive pricing discussed above offer a head start. Embedding a
to increase throughput. real-time (near-to-real-time) awareness of demand
Global freight flows after COVID-19: What’s next? 7trends in business planning processes is the COVID-19 will have a significant and lasting impact
surest way to generate the timely insights needed on the economy, but trade volumes will recover.
to reshape core business, seek out strategic
opportunities, and find new ways of working. For The companies that will emerge with a competitive
instance, global logistics companies (such as advantage in the next normal will be those that
carriers or forwarders) can make informed decisions develop granular scenarios on how demand will
about deploying assets and talent or refocusing evolve, appropriate playbooks to use in each case,
their sales force to commodities or trade routes and mechanisms that recognize—live—which
that are less impacted or recover faster from the scenario becomes reality.
crisis. Firms such as infrastructure providers and
operators can also quickly and accurately evaluate
their capital investment plans under alternative
scenarios, and industry participants could assess
and optimize their portfolios or M&A strategy by
geography or mode.
Jeff Condon is a specialist in McKinsey’s Atlanta office, Sven Gailus is a partner in the Hamburg office, Florian Neuhaus is a
partner in the Munich office, and Maite Peña-Alcaraz is a consultant in the Boston office.
The authors wish to thank Philipp Rau, Sal Arora, Steve Saxon, Dilip Bhattacharjee, Ezra Greenberg, John Murnane, Isabell
Scheringer, Michael Hopf, Dhruv Piyush Shah, Fabio Seifert, Hao Li, Robert Parker, and the McKinsey Trade Flow Model team
for their contributions to this article.
Copyright © 2020 McKinsey & Company. All rights reserved.
8 Global freight flows after COVID-19: What’s next?You can also read