System Status Briefing - BRIAN MOLEFE Group Chief Executive - Eskom
←
→
Page content transcription
If your browser does not render page correctly, please read the page content below
System Status Briefing
(April – June 2016)

BRIAN MOLEFE
Group Chief Executive

July 2016

                         CONFIDENTIAL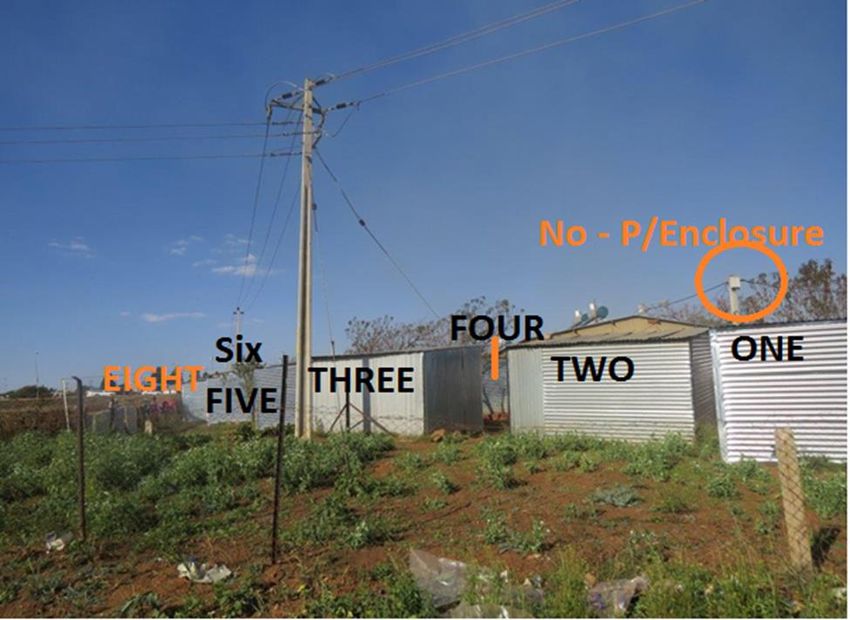
Contents

     1 Operational highlights

     2     Distribution Overview

     3 Generation Performance

     4 Outlook

     5 New build update

     6 Majuba power station silo & Duvha unit 3 updates

     7 Conclusion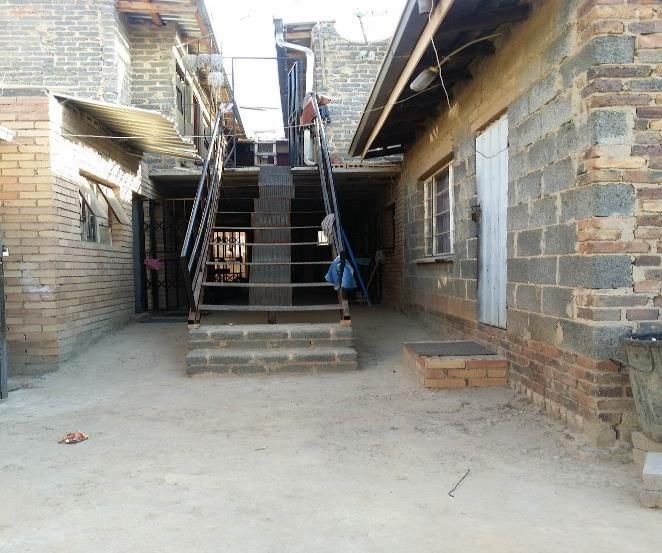
Overview of Eskom’s electricity value chain

                                                                   Distribution challenges

                                                    Generation     Stable, no load
                                                                   shedding

                                                    Transmission   Stable, no major
                                                                   incidents

                                                                   Stable with localised
                                                    Distribution   faults
                        Mining, Metros and large
                        industry                 Total
                                                 Distribution      5,689 million
                                                 Customers

                             Industry, commercial
                             and farming

                           Supply to municipalities
                           and residential
                                    3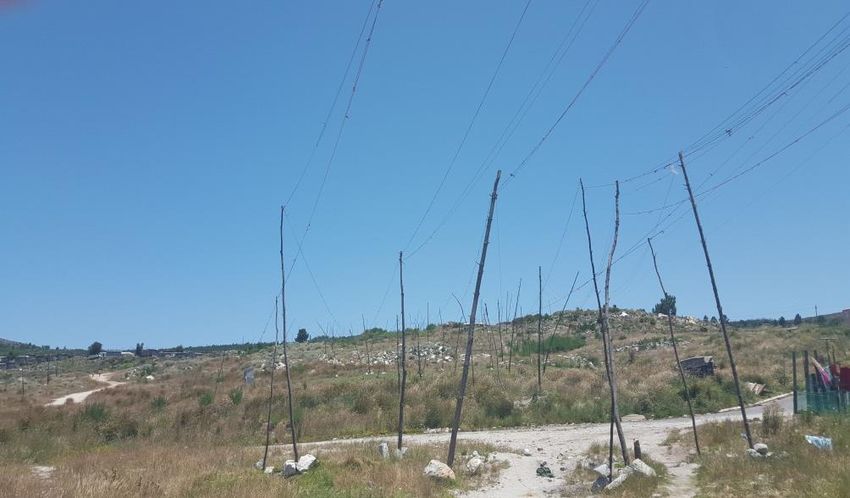
We continue to experience overall excellent
operational performance

•   Eskom has sufficient Generation capacity to meet the peak demand, due to improved

    energy availability factor; currently the year-to-date figure stands at 78.9 %. In the next

    five years Eskom will add an additional 8 169 MW capacity from our current new build

    project

•   On the Transmission side, we have excellent performance year-to-date with no system

    minutes incidents greater than 1

•   Distribution network performance (SAIFI and SAIDI) within acceptable limits, however we

    have localised incidents due to illegal connections, theft and plant failure, which are being

    addressed

                                                 4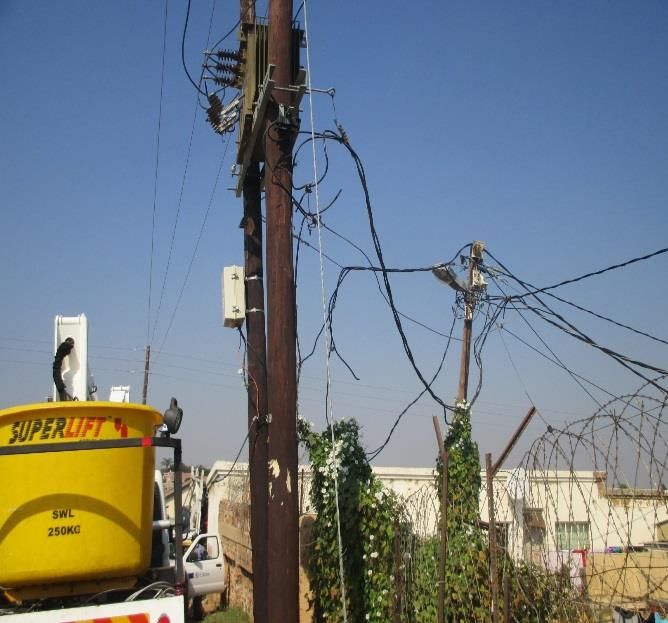
Contents

     1 Operational highlights

     2     Distribution Overview

     3 Generation Performance

     4 Outlook

     5 New build update

     6 Majuba power station silo & Duvha unit 3 updates

     7 Conclusion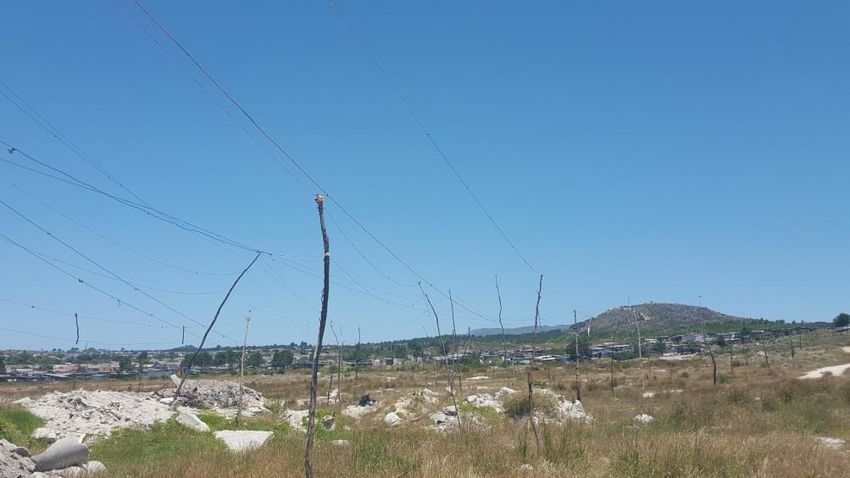
Eskom continues to work hard to speedily restore and
stabilise the Distribution network around the country

 •   In the past few weeks Eskom Distribution has experienced a number of
     localized power outages

 •   The key causes of the power outages are illegal connections which result
     in the overloading of our networks, cable theft and the vandalism of
     electricity infrastructure

 •   Technical faults and routine planned maintenance also result in power
     interruptions

 •   Eskom     responded by replacing damaged or failed equipment and in
     some cases upgrading the infrastructure, this approach has proven not to
     be sustainable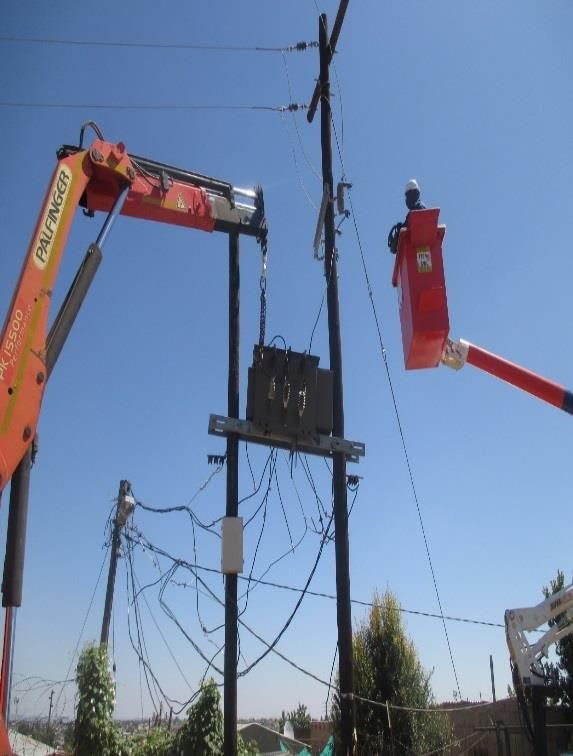
Over the past few weeks, the Eskom team has worked hard to
restore and stabilise the Distribution network in Gauteng

Hot spots identified                         Key cause and impact of outages Remedial actions undertaken
                                          •    Illegal connection and             •   Stabilise
                                               overloading                        •   Repaired and replaced 31 mini
    Soweto                                                                            substations and 287 transformers:
                                          •    Cable theft and vandalism              o 61 transformers in Soweto
                                                                                      o 44 Trf in Randfontein
                                                                                      o 16 transformer in Sandton
    Kagiso                                                                            o 42 transformer in Midrand
                                                                                      o 45 transformer in Ekhureleni
                                                                                      o 42 transformer in the Vaal
    Katlehong                                                                         o 36 transformer in Tshwane
                                                                                  •   Breaker trips – reset breaker, upgrade
                                         •     Plant failure                          and split the network
                                                                                  •   Upgraded & replaced damaged cables
    Mamelodi                                                                      •   Proactively engaged with affected
                                         •     About 5 mini sub-stations fail a       communities
                                               day

    Bophelong

Note: Approximately 250- 500 people impacted when a mini sub-station fails 7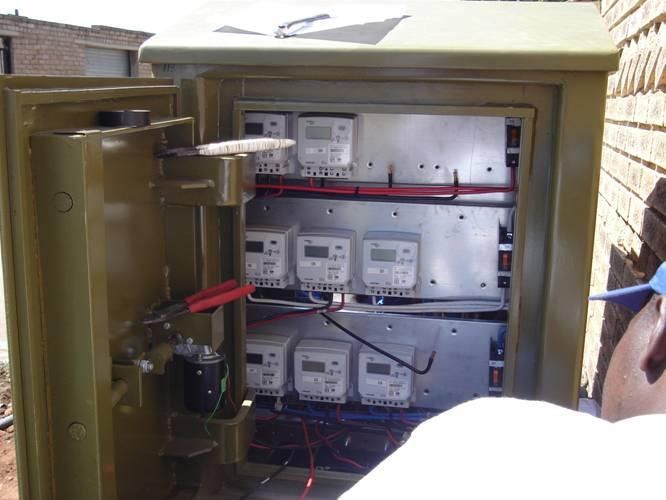
Background and impact of illegal connections, theft
and vandalism
Areas such as Soweto, Kathlehong, Diepsloot,
Bramfischerville, Sebokeng have been mostly
affected by localised outages.
The design philosophy on these townships was done
with a maximum demand of 2kVA per stand, however
illegal connections overload the transformers,
resulting in failures
These areas are infested with illegal connections,
back yard shacks, bypassed meters and
vandalised pillar boxes resulting in network
overloading and thus causing localised power
failures.
These factors cause equipment to operate above their
maximum rated or operating parameters thus reduces
the life’s span of the equipment
8
Pictures taken to illustrate the severity of illegal
connections in the Western Cape – 18 July 2016
Illegal connections                 Illegal power lines

                              9
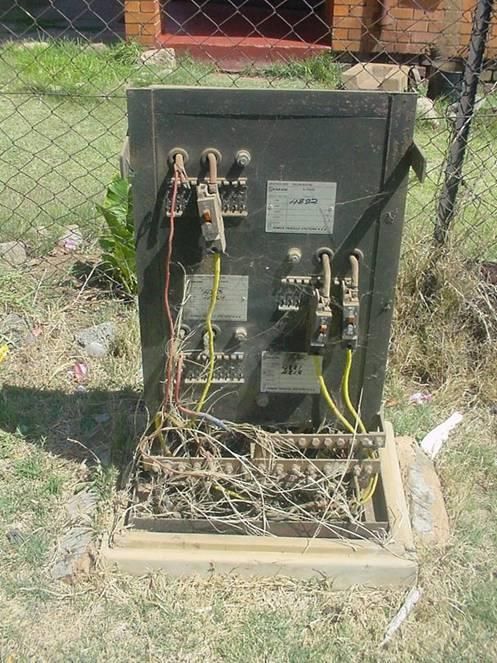
Overloading caused by backyard dwellers increasing
demand on the network
Assumption and analysis:
Assuming that Diepsloot has 2000 stands with
an average of 6 backyard dwellers per stand
Instead of 2000, the area has now yielded
12 000 dwellings
Original design capacity of 4MVA (Based on
2000 stands), increased to 24MVA as a result
Eight shacks can be seen in the photo
This will result in continuous trips of the
transformers feeding this households
The back yard dwellings (with an observed ratio of
1: 8 average) , pose a risk to the infrastructures
and provision of reliable electricity.
Protective Structures are damaged, forcefully
There are 15 rooms in this house all illegally
connected opened and metering equipment is bypassed
10Immediate response to this problem
Eskom responded by replacing damaged or failed
equipment and in some cases upgrading the
infrastructure, this approach has proven not to be
sustainable.
Other Interventions included the installation of
protective structures, replacement of burnt fuses,
retention of sagging conductors and load balancing
on phases which are all costly solutions.
Developed community partnerships and intensified
training (develop sense of ownership).
As part of network maintenance all open pillar boxes
are closed and damaged infrastructure is normalised.
Increased security measures to deal with fraud
related to meter bypasses and conductor theft.
11 11Sustainable solutions
• A three-pronged approached has been developed to recover, stabilise and
improve the performance of the electricity network.
• Eskom remains committed in ensuring that customers have a continuity of
supply and ensuring a sustainable solution to the current challenges.
• It is also important for communities to support our efforts towards removal of
illegal connections and installation of smart meters so as to ensure that we
can accelerate the overall service level improvement.
• Eskom customers are urged to report electrical faults at 08600 37566Contents
1 Operational highlights
2 Distribution Overview
3 Generation Performance
4 Outlook
5 New build update
6 Majuba power station silo & Duvha unit 3 updates
7 ConclusionPerformance Highlights for Q1 F2017(1/2)
Description
Maintenance • No load shedding has been implemented since August 2015
without load (except for 2 hours and 20 minutes)
shedding
• Average planned maintenance (PCLF) for Q1 F2017 is 11.11 %
• OCGT energy sent out has decreased from 1 801 GWh in Q1
F2016 to 16 GWh Q1 F2017, which is a 98% decrease in energy
Low diesel from diesel generators
usage and
spend • This resulted in a decrease in diesel costs from R 3.9 bn to
R 86 m from when comparing Q1 F2016 and Q1 F2017 which is a
98% decrease in diesel spendPerformance Highlights for Q1 F2017 (2/2)
Description
• Energy availability reached record highs of 81 % for the month of
June. This was last achieved in July 2013.
Increased • The energy availability has increased from 69.6 % (Q1 F2016) to
availability 78.6 % (Q1 F2017) which translates into an additional 3 775 MW of
extra power made available from the improvements made in the
existing fleet
• Eskom has been able to meet demand this financial year even during
Demand and the weeks where demand was higher than last year
Sales • Eskom has increased cross boarder sale by 33% when comparing
the energy (GWh) sent outPlant performance has been improving
considerably since October 2015
Performance over the past nine months
Percentage Breakdowns1 Planned maintenance Available energy
Insights
12,9 12,0 9,6 9,3 9,5
18,0 17,4 14,7 17,0 15,6 • For the month of
9,7 9,7 June 2016, energy
11,5 availability
12,9 12,1
16,0 11,2 9,8 reached record
12,0 12,3
highs of 81 % for
the month of June
2016 ,this was last
achieved in July
2013
78,9 81,0 80,8
71,8 74,7 74,2 75,9 • During the last
70,0 70,3 69,3
quarter planned
maintenance
exceeds
unplanned
breakdowns
Oct-15 Nov-15 Dec-15 Jan-16 Feb-16 Mar-16 Apr-16 16-May Jun-16 Jul-16
1 - Includes breakdowns and other non plant losses 16
2 – month to date performance on 17 July 2016OCGT usage and costs have both decreased as
a result of improved Generation availability
OCGT performance over the past nine months
GWh Energy Send Out (GWh)
400 381,2
Insights
350
• Improvements in
300 286,7 EAF have resulted
in lower usage of
250 diesel and hence
a reduction in the
200 180,3 costs
• For Q1 2017, YTD
150
savings in diesel
100,1 costs is R 649.6
100 million
50 • Dispatching the
21,2 diesel generators
6,6 6,3 4,8 5,0 1,7
0 less frequently,
Oct Nov Dec Jan Feb Mar Apr May Jun Jul1 has resulted in a
decrease in
maintenance
Load 21 16 10 5.6 1.3 0.4 0.4 0.3 0.3 0.2 intervals, which is
Factor (%)
a further
decrease in
Cost (R’m) 854 555 278 187 62 25 25 46 14 5.8 maintenance
cost
1 – month to date performance on 04 July 2016 17The improved performance of the Eskom plant is not
due to lower demand
Daily peak demand compared to available capacity
Megawatts
2 2
Insights
• The available
capacity is
significantly higher
than the capacity
available last year
• The available
capacity this year is
greater than the
peak demand last
year and that of this
year
• This means that if we
had this year’s
capacity available
last year we would
have avoided load
shedding last year
1 – improvements made in energy availability and capacity from Medupi 6 and Ingula 4
2 – Excluding IPP’s however including Cahora Bassa
18Comparison of how the highest peak demand was
met in 2015 vs 2016
Build up of how peak demand is met
Megawatts
IPP Support OCGT Eskom (Excl Gas)
Mandatory Demand Reductions Contracted Demand Reductions1
Insights
34481 34899
• The peak demand in 2015
333 779
0 0 could not be met and
1121
2514 required 2500MW of
mandatory demand
reduction as well as
2242 2250MW of OCGT usage.
358
• The peak demand so far
in 2016 was supplied
32999 without any mandatory
29034 demand reduction or
OCGT usage.
• This was possible due to
the Eskom generation
availability being 4000MW
higher in 2016 than in
11 Jun 2015 30 May 2016 2015 during the annual
peak
1- Virtual power station or interruptible load supply agreements 19With Eskom’s excess capacity, we have increased
our exports
Break down of Southern African Power Pool (SAPP) Sales per customer
SAPP Sales (GWh)
EDM CEC ZESA SEC
Insights into Quarterly sales
ORC ZESCO Skorpion BPC
LEC DAM NamPower Motraco • Eskom has firm cross border sales
to end-use customers which have
3,955 remained fairly constant at
~ 2 200GWh, increasing by 70GWh
• The firm and non-firm sales to
utilities has increased by
2,984 ~ 900GWh
• The total cross-border sales
increased by 970GWh
• Eskom supply is making an
increasing and positive contribution
to support the economies of SADC
and to offset the impact of the
drought on the Kariba power station
• With progressive additional capacity
coming online in South Africa
Eskom will be reviewing the exports
with a view to assess future
sustainability
Q4 2015 Q4 2016Contents
1 Operational highlights
2 Distribution Overview
3 Generation Performance
4 Outlook
5 New build update
6 Majuba power station silo & Duvha unit 3 updates
7 ConclusionOutlook
Tetris Maintenance Plan
• Our prognosis for winter and beyond is that there will be no load
shedding
• Eskom is progressing well with the maintenance of its power
generating plant whilst supplying the country’s electricity needs,
while also minimising usage of open cycle gas turbines
• Eskom is targeting a maintenance budget:
• 8 500 MW in Winter
• 11 500 MW in Summer
• Renewable energy will continue to contribute up to Photovoltaic 900
MW and wind 880 MW of the total installed capacity of 2 310 MW of
electricity generated during the day from solar and wind including
Eskom’s Sere wind farmThe Tetris plan indicates no loadshedding for the
remainder of the year
Available Capacity Operating Reserves PCLF UCLF Peak Demand Installed Capacity
45000
Installed Capacity is the total
generating capacity from Eskom’s
Winter UCLF Summer UCLF combined fleet
5500 MW Plant Breakdowns 6500 MW
40000
Plant Breakdowns: from the available capacity we
subtract the anticipated breakdowns
35000 Planned Maintenance
Operating Reserve Planned Maintenance: from this we also need to
subtract the planned maintenance
Operating Reserve: 2000 MW buffer to cater for sudden
30000
Increase in load or if generating units are lost
Peak Demand: the forecasted demand does not exceed the
available capacity and we still have the 2000 MW of operating
25000 reserve as a buffer. Therefore the prognosis is no load Available Capacity
shedding for the remainder of the year Available Capacity: the capacity available to meet the demand
we now have to superimpose the demand forecast for the year
to compare it with the this available capacity.
20000
Jul Aug Sep Oct Nov Dec Jan Feb Mar
2016 2017
Tetris V4.201 Planned Maintenance – July to September 2016
Available Capacity = Installed Capacity - Peak Demand - UCLF
Eskom is targeting a maintenance budget of 8.5 GW for Winter months
9000
8000
7000
6000
Operating Reserve Drakensberg 1
Kendal 6 Matla 3
5000 Camden 1
Hendrina 10
Lethabo 3
4000 Port Rex 3 Koeberg 1
Hendrina 8 Gariep 4 HCB 1
Drakensberg 4 Komati 5
Duvha 5 Komati 7
Hendrina 1 Majuba 3
3000 Tutuka 4
Tutuka 3
Lethabo 1 Ankerlig 3 Tutuka 6
Ankerlig 4
Kriel 3
2000 Matimba 4
Grootvlei 6
Grootvlei 1
Grootvlei 2
1000 Kendal 5
Arnot 1
Komati 3 Camden 2
0 Hendrina 7
18-Jul
20-Jul
22-Jul
24-Jul
26-Jul
28-Jul
30-Jul
02-Sep
04-Sep
06-Sep
08-Sep
10-Sep
12-Sep
14-Sep
16-Sep
18-Sep
20-Sep
22-Sep
24-Sep
26-Sep
28-Sep
30-Sep
01-Aug
03-Aug
05-Aug
07-Aug
09-Aug
11-Aug
13-Aug
15-Aug
17-Aug
19-Aug
21-Aug
23-Aug
25-Aug
27-Aug
29-Aug
31-Aug
Jul Aug 2016 Sep
The no loadshedding plan allows for available capacity as we seldom dip into the operating reserves
24
Source: Tetris Plan V4.202 Planned Maintenance – October to December 2016
Available Capacity = Installed Capacity - Peak Demand - UCLF
Eskom is targeting a maintenance budget of 11.5 GW for summer months
9000
8000
7000
6000 Operating Reserve
Tutuka 5 Tutuka 1
Tutuka 6 Matimba 3 Hendrina 4
Ankerlig 3 HCB 1 Majuba 4 Kriel 1
5000 Duvha 2
Matla 3 Hendrina 2 Majuba 2 Duvha 6 Kendal 1
Vanderkloof 1
Drakensberg 1
Hendrina 7
Komati 4 Komati 6
4000 Lethabo 6
Kendal 5 Koeberg 1
Komati 7 Ankerlig 1 Matla 2
3000 Majuba 3
Lethabo 5 Matimba 6
Gourikwa 1
2000 Tutuka 4 Medupi 6
Kriel 4
1000 Drakensberg 2
Camden 1
Hendrina 10
Hendrina 1
Grootvlei 2
Camden 2 Komati 3
0
01-Oct
03-Oct
05-Oct
07-Oct
09-Oct
11-Oct
13-Oct
15-Oct
17-Oct
19-Oct
21-Oct
23-Oct
25-Oct
27-Oct
29-Oct
31-Oct
02-Dec
04-Dec
06-Dec
08-Dec
10-Dec
12-Dec
14-Dec
16-Dec
18-Dec
20-Dec
22-Dec
24-Dec
26-Dec
28-Dec
30-Dec
02-Nov
04-Nov
06-Nov
08-Nov
10-Nov
12-Nov
14-Nov
16-Nov
18-Nov
20-Nov
22-Nov
24-Nov
26-Nov
28-Nov
30-Nov
Oct Nov Dec
2016
The no loadshedding plan allows for available capacity
2016 as we seldom dip into the operating reserves 2
Source: Tetris Plan V4.203 Planned Maintenance – January to March 2017
Available Capacity = Installed Capacity - Peak Demand - UCLF
Eskom is targeting a maintenance budget of 11.5 GW for summer months
8000
7000
6000
5000 Operating Reserve Majuba 1
Duvha 2 Tutuka 3
Kendal 6 Matla 1
Hendrina 4
Tutuka 6 Hendrina 5
4000 Grootvlei 2
Camden 2 Tutuka 5 Koeberg 2
Kendal 2
Kendal 1 Lethabo 4 Gourikwa 2 Matla 4
3000 Ankerlig 5 Gourikwa 3 Kriel 5
Kriel 4 Ankerlig 7
Matimba 2 Matimba 1
Kriel 1 Hendrina 2
2000 Palmiet 2 Grootvlei4
Lethabo 6 Arnot 5
Matla 2
Komati 6 Hendrina 1
1000 Kriel 2
Hendrina 3
Hendrina 10
Drakensberg 2
0 Camden 1
01-Jan
03-Jan
05-Jan
07-Jan
09-Jan
11-Jan
13-Jan
15-Jan
17-Jan
19-Jan
21-Jan
23-Jan
25-Jan
27-Jan
29-Jan
31-Jan
02-Feb
04-Feb
06-Feb
08-Feb
10-Feb
12-Feb
14-Feb
16-Feb
18-Feb
20-Feb
22-Feb
24-Feb
26-Feb
28-Feb
02-Mar
04-Mar
06-Mar
08-Mar
10-Mar
12-Mar
14-Mar
16-Mar
18-Mar
20-Mar
22-Mar
24-Mar
26-Mar
28-Mar
30-Mar
Jan Feb Mar
2017
2
The no loadshedding plan allows for available capacity as we seldom dip into the operating reserves 6
Source: Tetris Plan V4.19Contents
1 Operational highlights
2 Distribution Overview
3 Generation Performance
4 Outlook
5 New build update
6 Majuba power station silo & Duvha unit 3 updates
7 ConclusionNew Build Update (1/2)
• Medupi Unit 6 was commissioned on 23 August 2015, adding 794 MW to the
national grid.
• Since the previous update, the turbine on barring, first oil fire and first coal
fire milestones were achieved on Medupi Unit 5, which are important
milestones towards boiler blow through, first synchronisation and ultimately
commercial operation of the unit.
• Medupi Unit 5 is expected to be commercially operational in March 2018
(P80).
• Eskom has managed to synchronise all Ingula units to the national grid,
ahead of schedule. The last two units (2 &1) were synchronised on 21 May
and 16 June 2016 respectively.
• lngula Unit 4 was successfully commissioned on 10 June 2016, adding 333
MW to South Africa’s electricity grid.
• Repairs on Ingula Unit 3 are progressing well and all the remaining Ingula
units (3, 2 & 1) are on track for commercial operation during 2017New Build Update (2/2)
• Kusile power station continues to achieve set milestones on the path for Unit
1 commercial operation, recently completing the draught group run milestone
on 11 June 2016.
• Kusile Unit 1 is expected to be commercially operational in July 2018 (P80).
• At the end of May 2016, 10.1 km’s of transmission lines have been
constructed and 800 MVA’s of substation capacity commissioned for 2016/17
financial year. The targets for 2016/17 FY are 525 km’s and 1 800 MVA.
• Since inception in 2005, the capacity expansion programme so far added
7 364 MW of generation capacity, 6 162 km of transmission lines and
32 890 MVA of substation capacity to the national grid.We remain focused on bringing new capacity
online
P80 dates
CO = commercial operation
CO achieved in
CO in Mar 2015 CO in Aug 2015 Jun 16 CO by Jul 2017 CO by Jul 2018
100 794 333 333 800
Mar 2015 Aug 2015 Jun 16 Jul 2017 Jul 2018 5 620MW
Sere Wind Farm Medupi Unit 6 Ingula Unit 4 Ingula Unit 1 Kusile Unit 1
Post MYPD 3
Mar 2015 Jan 2017 May 2017 Mar 2018 2019/20
Majuba recovery Ingula Unit 3 Ingula Unit 2 Medupi Unit 5 Duvha Unit 3
1200 333 333 794 600
600MW from Unit 3 gap CO by Jan 2017 CO by May 2017 CO by Mar 2018 Fully recovered
solution in Feb 2015 Project falls outside
600MW from Unit 4 in MYPD3 window
Mar 2015New capacity will fuel the South African economy
Additional MW to be added to the South African grid
Installed capacity (MW) Medupi + Sere Ingula
Insights
Kusile Current capacity
• Eskom is
55,000 53,389
51,789 52,589 progressively
50,195 4,864 adding capacity
50,000 4,864
47,807 4,864 over the next
4,070
45,419 2,482 3,200 4,000 seven years
45,000 44 420 1,600 2,400
894 800
1227 1,332 1,332 1,332 1,332 1,332 1,332
• Ingula will be
40,000
40,000 fully
commissioned in
35,000 2017
43,193 43,193 43,193 43,193 43,193 43,193 43,193 • Medupi will be
fully
commissioned by
10,000 2020
5,000
• Kusile will be
fully
commissioned by
0
2016 2017 2018 2019 2020 2021 2022
2022Contents
1 Operational highlights
2 Distribution Overview
3 Generation Performance
4 Outlook
5 New build update
6 Majuba power station silo & Duvha unit 3 updates
7 ConclusionMajuba Power Station silo & Duvha Unit 3 update
Majuba Permanent solution Duvha unit 3 update
• Good progress continues on delivering • The contract negotiations for the
the permanent solution for the recovery rebuild portion of the scope have been
of the coal silo at Majuba. terminated.
• Completion is on track for end December • The supplier was unable to meet the
2017 (P80) conditions precedent to enable
• Plans to accelerate completion are in agreement on the contract.
place and progressing well
• Eskom has appointed suppliers who
will commence with the structural
assessments and repairs scope of
work. Based on the current works
schedule no additional delay is
foreseen
• Eskom will commence in a new
commercial process. Management is
yet to approve initiation of the new
commercial process.Contents
1 Operational highlights
2 Distribution Overview
3 Generation Performance
4 Outlook
5 New build update
6 Majuba power station silo & Duvha unit 3 updates
7 ConclusionConclusion
• Eskom has stabilised and to date we have not implemented load
shedding in almost 11 months (except for 2 hours and 20 minutes)
• We are ensuring that power supply remains unconstrained through our
maintenance programme
• We are also aggressively executing the capital build programme which
will increase our generation capacity.
• Eskom has worked hard to restore and stabilise the electricity distribution
network around the country, and we remain committed in ensuring that
customers have a continuous supply of electricity.Video
You can also read