Regional Demand Forecasts for Aggregates in Wellington
←
→
Page content transcription
If your browser does not render page correctly, please read the page content below
Regional Demand Forecasts
for Aggregates in Wellington

This report has been prepared for Wellington City Council and is not intended for general
publication or circulation. It is not to be reproduced without written agreement. We accept no
responsibility to any party, unless specifically agreed by us in writing. We reserve the right,
but will be under no obligation, to revise or amend our report in light of any additional
information, which was in existence when the report was prepared, but which was not brought
to our attention.
Regional Demand Forecasts for Aggregates in Wellington Background
1. Background
KPQ is strategically located in Ngauranga Gorge, on State Highway 1 within Wellington City.
The quarry is a hard rock quarry extracting greywacke. The KPQ site also hosts:
An asphalt plant owned and operated by Downer, and
A concrete plant owned and operated by Allied Concrete in which Holcim has a 50%
holding.
There are long term supply agreements in place with these businesses which provide both
long term stability and sales, with the advantage of having exposure to both roading and
construction based sales. This provides balance if there are short term fluctuations in either
market. There is reasonable ability to adjust production between either market.
There are limited sources of aggregate material in the region. The greywacke rock resource
reserves along the Wellington Fault have for many decades been the prime source of the
hard rock quarried for use in the wider Wellington and Hutt Valley areas. Ngauranga Gorge
has been quarried for over 100 years.
1920 Quarry activity in Ngauranga Gorge:Track & Stream (Alexander Turnbull Library)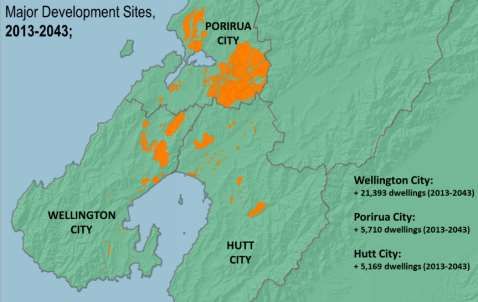
Regional Demand Forecasts for Aggregates in Wellington Regional Rock Resources and Alternatives
2. Regional Rock Resources and Alternatives
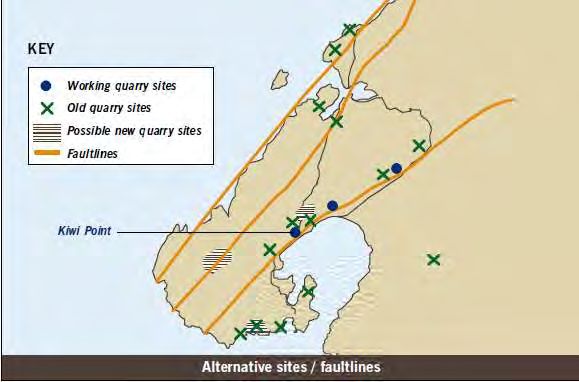
Location of rock resources
The three main existing Wellington quarries (Kiwi Point, Belmont and Horokiwi) are all
located adjacent to the Wellington Fault. This has lifted greywacke available for extraction.
There are many older and abandoned sites.
Generic barriers to quarrying
The Commerce Commission notes the following barriers to entry in the quarry and
aggregate industry:1
Appropriate Resource. In Wellington, the greywacke resources are located on major
fault lines.
Land. Land needs to be available next to the appropriate resource.
Equipment/capital. The hard rock quarries in Wellington take a reasonable
investment in equipment.
Resource consent.
New quarry sites would run into considerable difficulty to be established due to these factors.
Consenting activities would also need to be considered in relation to the District Plan
provisions with potential sites in the Wellington region more likely to be zoned ‘rural’ or ‘open
space B’ which would likely require a plan change. Transport and trucking of materials would
provide a significant impact on infrastructure.
1
Commerce Commission decision: file:///C:/Users/Philip/Downloads/Fletcher-Building-Holdings-NZ-Ltd-Higgins-
Group-Holdings-Ltd-and-Horokiwi-Quarries-Ltd-clearance-application-16-February-2016%20(1).pdf
Regional Demand Forecasts for Aggregates in Wellington Regional Rock Resources and Alternatives
Alternative sites for Aggregate extraction
The Wellington region was initially estimated to have around 84 million tonnes of extractable
resource2. About 32-36 million tonnes are estimated still to be available. The other main
potential rock resources in the Wellington region are the Makara area (centered around
Quartz Hill), Owhiro Bay Quarry, and the Northern Ngauanga Gorge. There would be
considerable difficulties accessing these resources.
Makara/Quartz Hill. This area is located on a ridgeline running above the Makara
Road on a South West orientation. The easterly flanks of this ridge may represent a
large area of accessible hard rock resource. However, there would be significant
issues accessing this resource:
o Meridian’s wind farm is located along the ridgetop and is a valuable wind
resource with a large investment in turbines. The cost of acquiring and
accessing this land would be considerable.
o The ridge including Quartz Hill and White Rock Hill to the southwest was
included in the ridgeline and hilltop overlay for protection under the District
Plan.
o Transport and access would present major difficulty as the roads from Karori
to Makara and through the Owhariu valley to Johnsonville are currently small
and narrow. Widening and straightening them would be challenging,
particularly in Makara valley. Karori Road is also heavily used and congested
at peak times and the presence of heavy trucking would cause significant
impacts. The Owhariu route is much longer with similar challenges.
o Amenity & landscape values. The Makara Road is a popular scenic route for
drivers and cyclists. While most visual impacts could be hidden depending on
the location of the quarry operations, trucking and noise would be detrimental
to the amenity values. The local community are also sensitive to noise and
disruption (as evidenced in their opposition to the Wind Farm construction).
o Accessing this or other resource in the Makara beach area or from the
western side and attempting to transport through the Coastal Area (e.g. by
barge) would present significant logistical and environmental challenges.
There is some DOC land, a Coastal walkway and limitations on activities in
the coastal area (let alone the logistical challenges of operating on an
exposed coast and barging back to some other port facility through Cook
Strait).
However, in the next 20 years this resource may need further assessment as to its
potential. This would be prudent to carry out in during the lifespan of the existing
Wellington quarries to test out the resource availability, and whether there were any
logistical solutions that could enable extraction.
Northern Ngauranga Gorge. On the North Side of SH1 across from Kiwi Point Quarry
is a potential resource. It likely has similar rock characteristics to the existing KPQ
operation. The issues accessing this resource would include:
o Land access as there is subdivision on the top of the hill for lifestyle blocks.
o Operational constraints as there is little space separating SH1 and the steep
upper slopes. On the eastern side the North Island Main Trunk Line (railway)
would constrain access.
o Landscape and amenity values as the area has been included in the
ridgetops and hilltops overlay in the District Plan, and there would be visual
impacts from the northern Khandallah area.
o The northern side of Ngauranga is regenerating forest, assisted by being
damper and less disturbed than the southern faces. Disturbance could
2
Applied Geology Associates, 1978. Planning for Mineral Resources in the Wellington Region.Regional Demand Forecasts for Aggregates in Wellington Regional Rock Resources and Alternatives
fragment a developing ecological corridor up the gorge that links to Tyers
Stream Reserve to the south.
Owhiro Bay. The former quarry at this site was closed in 1999. It was
decommissioned mainly in response to concerns about environmental effects. The
obstacles to this site include:
o Commercial barriers as the terms of the Wellington’s City Council purchase
means the Council cannot reopen the quarry as of right.
o Previous works and rehabilitation which means that accessing resource
would require significant land modification.
o Considerable public opposition to activity in the coastal area. This is an
important recreation resource for the public accessing the wild south coast
including walkers and mountain bikers. The quarry also lies within an area of
special value to local iwi with cultural sites for protection. Given a main reason
for public pressure closure was environmental effects in the coastal area
reopening this quarry or nearby would be highly contentious.
o Transport up the Happy Valley would add to the landfill trucking impacts.
o Access from Happy Valley (landfill) side was considered during the quarry
closure process and was not considered feasible as access to high quality
rock was constrained by intervening overburden and poor rock.
In the wider region there are limited other possibilities. Plimmerton quarry was closed due to
the environmental effects of trucking through the village and was a limited resource. The
Regional Council holds consents for extraction of aggregate from the Hutt River but that is
specifically aimed at river management activities and is not a reliable material for supply.Regional Demand Forecasts for Aggregates in Wellington Current Wellington Market
3. Current Wellington Market
National Production
Nationally, aggregate production has been somewhat cyclical. Following the global financial
crisis in 2008 there was a major downturn. From 2013 there has been a significant
reinstatement of production levels3:
Aggregate Production 2000-2014
25.0000
20.0000
Million tonnes
15.0000
10.0000
5.0000
0.0000
2000 2001 2002 2003 2004 2005 2006 2007 2008 2009 2010 2011 2012 2013 2014
Rock for reclamation & protection Rock, sand and gravel for building
Rock, sand and gravel for roading Sand for industry
3
Source: http://www.nzpam.govt.nz/cms/investors/doc-library/minerals-industry-snapshot-
files/aggregate-production-1993-2014.xlsRegional Demand Forecasts for Aggregates in Wellington Current Wellington Market
The Wellington market has been less extreme but has also rebuilt in terms of tonnage and
value4 with a 70% increase from 2013 to 2014.
Wellington Region: Change to Total Aggregate market
3,000,000 (tonnes)
2,500,000
Tonnes per annum
2,000,000
1,500,000
1,000,000
500,000
0
2000 2001 2002 2003 2004 2005 2006 2007 2008 2009 2010 2011 2012 2013 2014 2015
Sales value has also increased:
Wellington Region: Change in total sales value
$40,000,000
$35,000,000
$30,000,000
$ Value of sales
$25,000,000
$20,000,000
$15,000,000
$10,000,000
$5,000,000
$-
2000 2001 2002 2003 2004 2005 2006 2007 2008 2009 2010 2011 2012 2013 2014
4
Regional production figures from http://www.nzpam.govt.nz/cms/investors/doc-library/minerals-industry-
snapshot-files/ (downloadable spreadsheets by year).Regional Demand Forecasts for Aggregates in Wellington Market Outlook
4. Market Outlook
Underlying demand for aggregate
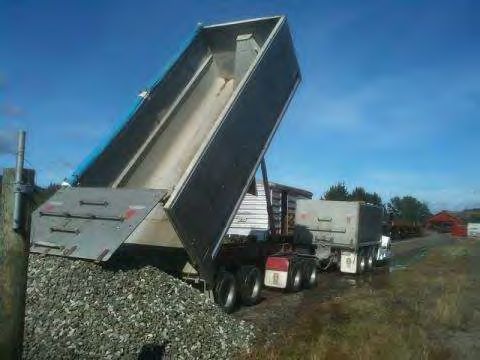
There is an underlying demand for aggregate for a wide range of uses in building, roading
and infrastructure. The ‘rule of thumb’ is that the per capita consumption rate is about 8
tonnes per person per year5. Of course that consumption is averaged out. Some examples
of drivers of aggregate use are:
A new house uses approximately 250 tonnes of aggregate including foundations,
retaining works, drains, cladding, linings, driveways and landscaping etc.
1 km of motorway uses 4,000 tonne of aggregate from basecourse to sealing chip.
In addition, commercial construction, drainage and other uses all require aggregate inputs.
In the Wellington Region, the estimate of usage is about 6.3 tonnes per year for a total of
about 2.5 million tonnes. The mix of aggregates is as follows:
Wellington Region mix of aggregates - 2013 & 2014
1,200,000
1,000,000
800,000
Tonnes
600,000
400,000
200,000
0
Rock, sand and Rock, sand and Rock, sand, gravel & Sand for industry
gravel for building gravel for roading clay for fill
2013 2014
Population forecasts and development
The population of Wellington City is expected to rise by about 0.64% per annum between
2013 and 2043, from 203,933 to around 246,6926. Slightly lesser increases are forecast for
other regional areas.
While there are around 800 building consents for new dwellings per annum in Wellington,
the Housing Accord aims to increase this from 1000 to 1500 per annum through to 2019.
Hutt City and Wellington City Council policies are to increase intensification, particularly
around transport hubs and for more multi-storey buildings.
The following is an outline of major development sites for forecast building: 7
5
Source” Aggregate & Quarry Association 2002
6
This is the Wellington City Council forecasts: see http://forecast.idnz.co.nz/wellington
7
http://blog.id.com.au/2016/population/new-zealand/forecasting-in-new-zealand-building-regional-knowledge-in-the-wellington-
region/Regional Demand Forecasts for Aggregates in Wellington Market Outlook
So for example, 21,000 new dwellings would indicate about a resource demand of 5 million
tonnes.
Specific projects and infrastructure
Nationally there is a current strong focus on infrastructure development including Roads of
National Significance (RoNS) and on improving regional links8. There are considerable
opportunities for growth in the Wellington market. From the National Construction Pipeline9
the following is specific to Wellington for the period up to 2019:
All building and construction is expected to grow by 38% (better than the national
average of 32%);
Residential building expected to grow by 21%; and
Non-residential building and construction forecast to grow by 49%.
The peak of construction is in 2017 with $3 billion of works forecast.
The planned non-residential works in Wellington include:
Roading. In total over the next 10 years NZTA projects $5.4 billion in roading within
the Wellington region.
o RoNS including McKays to Peka Peka (M2PP), Transmission Gully,
Waitangirua and Whitby links.
o Link road development including SH1 development through Wellington (Aotea
Quay to Ngauaranga, Airport to Mt Vic Tunnel, etc.); and Petone to Grenada
links.
Wellington Airport including $635 million on the Master Plan for terminal upgrade,
hotel development, car park extension and apron development. This does not include
the $300 million runway extension for which resource consent is being planned.
Retirement villages (Boulcott and Petone) and health infrastructure (e.g. Wakefield
Hospital expansion).
Education Sector developments.
Other civil works and construction (including water and wastewater projects)
8
http://www.insideresources.co.nz/news-story/19694/govt-confirms-transport-spend-over-next-ten-years
9
“National Construction Pipeline”, October 2014 prepared by BRANZ, Pacifecon, and MBIE.Regional Demand Forecasts for Aggregates in Wellington Market Outlook
The $300 million Wellington Airport Runway extensions (if approved and funded) would
require a significant amount of rock material. They estimate 150,000 cubic metres of primary
armour or akmons and 137,000 cubic metres of secondary armour will be needed, plus
concrete to form the rock and dyke wall, with a further 1.5 million cubic metres of fill material
like fine gravel or dredged material for the land mass. South Island sources may be looked
at, as well as possibly timing in construction with a second tunnel from Mt Vic supplying
some rock10.
Forecast of Wellington Production and Demand
Combining the current known demand and projects (not including the runway extension),
and the underlying population and new dwelling forecasts substantiates the following
aggregate production11:
Total Quarry Aggregate Production
1800000
1600000
1400000
1200000
Tonnages
1000000
800000
600000
400000
200000
0
2016 2018 2020 2022 2024 2026 2028 2030 2032 2034 2036 2038 2040 2042 2044 2046 2048 2050
10
http://www.insideresources.co.nz/news-story/19720/wellington-airport-extension-may-source-south-island-rock
11
This is based off the 3 major quarries in the area around their core product sets and does not include overburden etc.Regional Demand Forecasts for Aggregates in Wellington Relative market supply
5. Relative market supply
Performance relative to market:
KPQ volumes are fairly consistent against the total market:
Wellington Region: Change to Total Aggregate market (tonnes)
3,000,000 350,000
2,500,000 300,000
250,000
2,000,000
Total market
200,000
1,500,000
150,000
1,000,000
100,000
500,000 50,000
0 0
2007 2008 2009 2010 2011 2012 2013 2014
Wellington market KPQ versus the Wellington market
The market share estimates for the three regional quarries are as follows:12
12
Based on reported tonnages from Inside Resources. Note that KPQ is listed as 350,000 tonnes in
this, there well may be padding of all participant numbers.Regional Demand Forecasts for Aggregates in Wellington Relative market supply
Market Share Estimates
[CELLRANGE],
[PERCENTAGE] [CELLRANGE],
[PERCENTAGE]
[CELLRANGE],
[PERCENTAGE]
Product Mix
All quarries produce a range of material. While Belmont and Kiwi Point Quarry have
traditionally have had more ability to produce higher grade roading product, there is
reasonable ability for any of the quarries individually or together to support the construction
or roading markets from all quarries.
Barriers to entry and supply
With road or alternative haulage costs a significant factor in supplying quarry products there
are barriers to non-local entry into the market. Local haulage costs are also a significant
factor of the cost. The three Wellington based quarries have both the resource and the
location for the immediate Wellington market.
Lifespan with KPQ Plan Change
Both Belmont and Horokiwi appear to have sufficient resources in the medium term.
Horokiwi has a forecast of about 20 years of resource remaining13.
Belmont had a plan change approved in 2014 that gave it access to additional
resources of about 10 million cubic metres. This additional resource also improved
their access to higher-quality resources. This is thought to extend the current life of
the quarry to around 40 years14.
If KPQ also gets the required Plan Change, then the supply outlook is as follows:
With KPQ Plan Change 2015 2020 2025 2030 2035 2040 2045 2050
KPQ
Belmont
Horokiwi
Note that means there is an opportunity around 2030 for reduced competition, higher
demand from KPQ and potential increase in pricing.
13
http://www.insideresources.co.nz/news-story/19374/horokiwi-pushes-ahead-quarry-development
14
http://www.insideresources.co.nz/news-story/14999/winstone-prepares-belmont-expansionRegional Demand Forecasts for Aggregates in Wellington Relative market supply
Lifespan without KPQ Plan Change
Without the Plan Change, then there is a more severe supply outlook.
Without KPQ Plan Change 2015 2020 2025 2030 2035 2040 2045
KPQ without Plan Change
Belmont
Horokiwi
KPQ resources would be exhausted by 2020 and while a limited amount of material could be
taken from the Southern area (already consented) that would not be of high quality or be
particularly viable. The loss of access to high quality resource would speed up the utilisation
of resources from the other two quarries. Belmont is likely to be significantly impacted – it is
expected that it would be able to gear up for higher demand – and continue to supply a full
range of high quality products. There would be opportunity for increased prices due to
lessening competition in this period, as well as additional transport costs for southern and
western areas of the Wellington region.
Demand/supply risks
Given the constancy of historical demand for aggregates it is hard to envisage significant
downside risks to demand. More likely are potential increasing demands. This may be from
higher levels of construction/intensification and infrastructure development or from re-
building from one-off events. GNS has estimated the risk of a large (>magnitude 7.5)
earthquake on the Wellington Fault as 10% in the next 100 years15. The experience from
Christchurch is that following their earthquakes there was considerable demand for quarry
materials to support re-building. However, a lesser earthquake, such as Wellington
experience in 2013, can also trigger considerable demand e.g. to strengthen or replace
earthquake prone buildings.
15
www.gns.cri.co.nzYou can also read