FY2019 HALF YEAR RESULTS - Friday 22 February 2019 - Automotive Holdings Group

Page created by Kenneth Rowe
 
CONTINUE READING
FY2019 HALF YEAR RESULTS - Friday 22 February 2019 - Automotive Holdings Group
FY2019 HALF‐YEAR RESULTS
Friday 22 February 2019
FY2019 HALF YEAR RESULTS - Friday 22 February 2019 - Automotive Holdings Group
Disclaimer

This presentation contains forward looking statements that are subject to risk factors associated with automotive retail and logistics businesses.

The Company believes that the expectations reflected in these statements are reasonable as at the date of this presentation but they may be
affected by variables and changes in underlying assumptions which could cause actual results or trends to differ materially, including but not
limited to: fiscal and regulatory developments, changes in accounting standards, economic and financial market conditions, price or currency
fluctuations, actual demand, loss of market, industry competition, environmental risks, physical risks, non‐completion of acquisitions or
divestments, and project delay or advancement, approvals and cost estimates.

Readers are cautioned not to place undue reliance on any forward looking statements. Past performance cannot be relied on as a guide to future
performance.

No representation is made or will be made that any forward looking statements will be achieved or will prove to be correct. We do not undertake
to update or revise any forward looking statement, whether as a result of new information, future events or otherwise.

Nothing in this presentation should be construed as either an offer or a solicitation of an offer to buy or sell AHG securities, or be treated or relied
upon as a recommendation or advice by AHG.

The views expressed in this presentation may contain information that has been derived from publicly available sources that have not been
independently verified. No representation or warranty is made as to the accuracy, completeness or reliability of the information.

References to “AHG” may be references to Automotive Holdings Group Limited or its subsidiaries. All references to dollars, cents or $ in this
presentation are to Australian currency, unless otherwise stated.

                                                                                                                                                           2
FY2019 HALF YEAR RESULTS - Friday 22 February 2019 - Automotive Holdings Group
The half‐year result in review

                                                    •     Group revenue of $3.22 billion [$3.17b pcp*]
                                                    •     Statutory NPAT of ($225.6 million) [$40.7m pcp*]
                                                    •     Statutory EPS (68.0 cents) [12.3 cents pcp*]
                                                    •     Operating1 EBITDA of $93.4 million [$111.4m pcp*]
                                                    •     Operating1 EBITDA margin 2.9% [3.5% pcp*]
                                                    •     Operating1 NPAT of $24.2 million [$42.1m pcp*]
Operating1 NPAT
                                                    •     Interim dividend suspended to preserve balance sheet capacity
of $24.2m, down                                           for strategic opportunities
42.5% on PCP in                                     •     Strategic review of Refrigerated Logistics announced
 line with recent                                   •     Non‐cash impairment of $226 million
  trading update                                    •     AHG remains the largest automotive retailer in Australasia
                                                    •     AHG RL largest scale player in Australia
                                                    •     AHG continues investment in easyauto123

                                                                                                                                                      3
Operating1 – excludes unusual items. *Restated to include Refrigerated Logistics, which had been classified as “Held for Sale” at 31 December 2017.
FY2019 HALF YEAR RESULTS - Friday 22 February 2019 - Automotive Holdings Group
Financial performance

     Consolidated Financial Performance                           H1             H1             %
                                                               FY2018          FY2019         change                    Revenue up YoY
                                                                ($m)*           ($m)

     Operating1 Performance                                                                                             Margins impacted by challenging
     Revenue                                                   3,165.2         3,217.9          1.7%                     market conditions in Automotive
     EBITDA                                                     111.4            93.4         (16.1%)                    and Logistics
     EBITDA %                                                    3.5%           2.9%
     EBIT                                                        85.3            60.4         (29.2%)
                                                                                                                        Unusual items and non‐cash
                                                                                                                         impairment totalling $249.8m
     EBIT %                                                      2.7%           1.9%
     Operating1 Net Profit after Tax                             42.1            24.2         (42.5%)
                                                                                                                        Includes ongoing investment in
     Earnings Per Share (cps)                                    12.7             7.3
                                                                                                                         easyauto123

     Statutory IFRS Performance                                                                                         Refrigerated Logistics division
     Unusual items                                               (1.4)         (249.8)                                   increased PBT
     Statutory Net Profit after Tax                              40.7          (225.6)
     Earnings Per Share (cps)                                    12.3           (68.0)

                                                                                                                                                           4
Operating1 – excludes unusual items. *Restated to include Refrigerated Logistics, which had been classified as “Held for Sale” at 31 December 2017.
FY2019 HALF YEAR RESULTS - Friday 22 February 2019 - Automotive Holdings Group
Balance sheet / Operating cashflow

                                 31 Dec    30 June   31 Dec
Balance Sheet Gearing
                                  2017      2018      2018
Total Borrowings                 1,240.9   1,346.1   1,329.2

Cash & Cash Equivalents          (38.9)     (73.0)   (64.6)     Strong Operating
                                                                    Cashflow
Net Debt                         1,202.0   1,273.1   1,264.6                         Capex inline with $30m
                                                                    $27.0m             full‐year guidance
Inventory Finance (Floorplan)    (857.4)   (989.2)   (979.9)
                                                               (Outflow $9.9m PCP)
Net Debt
                                 344.6      283.9    284.7
– Excluding Floorplan Finance
Interest Cover (times)             4.0       3.6       2.3     Structural net debt
                                                                 improving once      Material balance sheet
                                                                   adjusted for      initiatives in place or
GEARING RATIO                                                   seasonal working          under review
Net Debt + Equity
                                 1,163.4   1,060.5   809.9
                                                                  capital flows
– Excluding Floorplan Finance

Net Debt / [Net Debt + Equity]
                                 29.6%     26.8%     35.1%
– Excluding Floorplan Finance
                                                                                                           5
FY2019 HALF YEAR RESULTS - Friday 22 February 2019 - Automotive Holdings Group
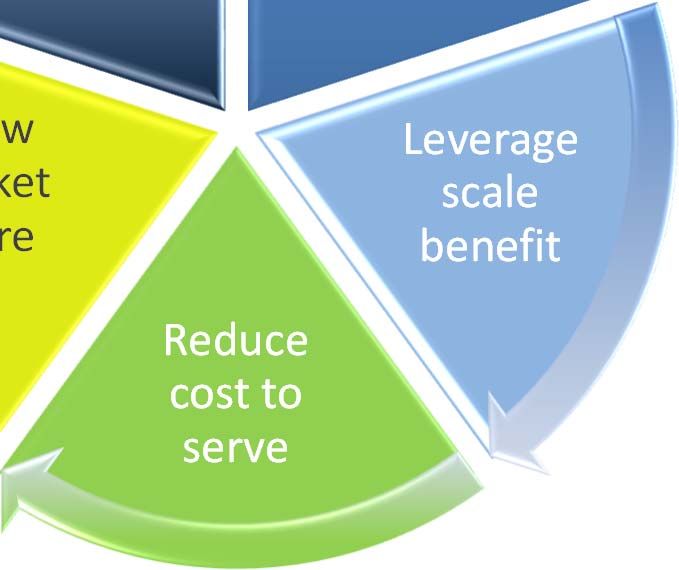
Dividend policy linked to gearing

Temporary suspension of existing dividend policy of 65% to 75% of operating
profit after tax while we move towards our targeted gearing range of 1.5 times
to 1.75 times.

Board remains focused and vigilant around cash management and reducing
the Company’s gearing position to allow flexibility in the current conditions.

                                                                                 6
FY2019 HALF YEAR RESULTS - Friday 22 February 2019 - Automotive Holdings Group
Reconciliation of Statutory IFRS NPAT to Operating1 non‐IFRS NPAT

                                                                                                                  HY2018   HY2019
                                                                                                                   $’000    $’000

 Statutory IFRS Profit (net of tax) attributable to members                                                       40,674   (225,634)

 Add back unusual items

 Impairment of non‐current assets ‐ plant and equipment, goodwill and franchise rights ‐ Automotive Retail          ‐      144,609

 Impairment of non‐current assets ‐ plant and equipment, goodwill and franchise rights ‐ Refrigerated Logistics     ‐       78,762
 Costs relating to restructure of operations and discontinued operations, including trading losses, impairment
                                                                                                                   659      18,909
 of current and non‐current assets and onerous lease provisions
 Impairment of other current and non‐current assets ‐ Receivables and IT                                            ‐       10,209

 Net costs relating to integration, acquisition and divestment activities, including sale of properties            735      (2,645)

 Operating1 Non‐IFRS Profit (net of tax) attributable to members                                                  42,068    24,210

                                                                                                                                       7
 Operating1 – excludes unusual items as disclosed on this slide.
FY2019 HALF YEAR RESULTS - Friday 22 February 2019 - Automotive Holdings Group
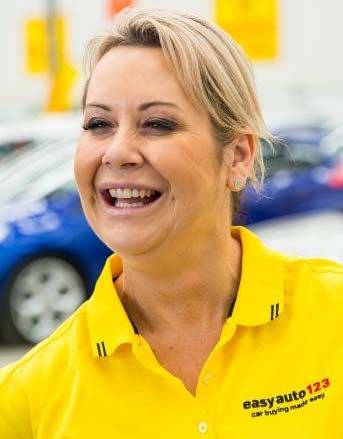
Operating1 PBT – Key Movements

     $m                                                                             AHG CONSOLIDATED ‐ KEY MOVEMENTS
      70                                                                                   1H FY2018 ‐ 1H FY2019

      60

                                              24.0
      50

      40
                                                                       3.9                  1.1
                                                                                                               2.1
                                                                                                                        0.4
                     64.0
      30

      20
                                                                                                                                    34.7

      10

       0
              AHG OPERATING              AUTO RETAIL                 EA123                 REF.            KTM/HQVA    OTHER   AHG OPERATING
               PBT 1H FY2018             EXCL. EA123                                     LOGISTICS                              PBT 1H FY2019
                                                AUTOMOTIVE SEGMENT
                                                                                                                                                8
Operating1 – excludes unusual items as disclosed on slide 7 in this presentation.
FY2019 HALF YEAR RESULTS - Friday 22 February 2019 - Automotive Holdings Group
Automotive ‐ No 1 in Franchised Automotive Retail

  Key strategic asset currently at cyclical low

  Largest scale player in the Australasian market

  179 franchises at 114 dealership locations

  6.7% market share in Australia and ~3% in New Zealand*

  Broadest manufacturer portfolio

  Tony Cramb appointed COO (ex Toyota Australia Exec. Director of
   Sales and Marketing)

  Opportunity for further industry consolidation

  Opportunity to leverage scale to lower costs

  Adjacent opportunities in fleet, rentals, subscription

                                                                     9
*VFACTS / NZ MIA December 2018
FY2019 HALF YEAR RESULTS - Friday 22 February 2019 - Automotive Holdings Group
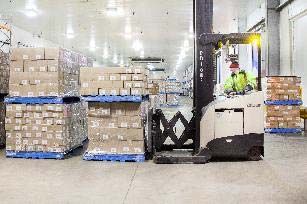
Australian New Car Market Data
            NEW VEHICLE SALES – AUSTRALIA (VFACTS)                                                                        RECORD YEARS
1,200,000

                                                                                                            1,189,116
                                                                                                1,178,133
                                                                             1,155,408

                                                                                                                                 1,153,111
                                                     1,136,227

                                                                 1,113,224
                                        1,112,032
1,000,000
               1,035,574

                           1,008,437

 800,000                                                                                                                                     CY 2018:
 600,000

 400,000
                                                                                                                                             National market
                                                                                                                                             Down 3.0% YoY
 200,000
                                                                                                                                             (36,005 units)
       0
              2010         2011        2012          2013        2014        2015              2016         2017             2018
                                                                                                                                             Private buyer market
            NEW VEHICLE SALES – WESTERN AUSTRALIA (VFACTS)                                                                                   Down 7.5% YoY
                                                                                     AHG WELL PLACED FOR W.A. RECOVERY

 120,000
                                                                                                                                             WA market
                                        128,005

                                                     125,544

                                                                                         24% DECLINE                STABILISED
               117,453

                                                                 115,343

 100,000
                           109,492

                                                                             106,188                                                         Down 24% from peak

                                                                                                100,234

                                                                                                            97,773

                                                                                                                                 97,174
  80,000
                                                                                                                                             Now stabilising
  60,000

  40,000

  20,000

       0
              2010         2011        2012          2013        2014        2015              2016         2017             2018                                   10
Finance and Insurance Impacts

FY2017
 Restricted lending impacts H2

FY2018
 $29m impact in FA from reduced add‐on insurance commissions and
  responsible lending restrictions
 Consumer sentiment down on Banking Royal Commission
 Finance penetration down to 34%
 Turnover in F&I Business Managers as remuneration models changed

FY2019
 Stabilised Business Manager churn, better adapted to new F&I
 Opportunity to improve penetration rates
 Introduction of new F&I products (GFV only available through dealerships)
 No impact expected in FY2019 from FSRC recommendations

                                                                              11
Automotive ‐ Industry returns (CY2018)

       AVERAGE DEALER PROFITABILITY                               AHG PROFITABILITY
  CY 2017             CY 2018           CHANGE                  CY 2017   CY2018      CHANGE
     1.5%               0.9%              (0.6%)                 2.5%      2.0%       (0.5%)
(Source: Deloitte report February 2019 – net profit to sales)

  Market challenged:
            Housing prices impacting consumer sentiment
            Restrictive lending impacting credit availability
            OEM targets generate discounts on new vehicle oversupply

  Broad‐based decline in brand returns

  AHG outperforms the industry average for franchised dealers

                                                                                               12
Automotive segment result

Operating1 Performance                    H1        H1        %       Segment comprises:
                                        FY2018    FY2019    change
                                         ($m)      ($m)
                                                                       Franchised Automotive Cars
Revenue                                 2,736.6   2,785.2    1.8%
                                                                       Franchised Automotive Trucks
EBITDA                                   86.2      67.9     (21.2%)
EBITDA %                                 3.1%      2.4%                easyauto123
EBIT                                     75.7      51.3     (32.3%)
EBIT %                                   2.8%      1.8%                Carlins Automotive Auctions
Profit Before Tax                        62.5      33.8     (45.9%)
                                                                       360 Finance
Operating1 –   excludes unusual items

                                                                                                       13
Automotive performance – Excluding easyauto123

Operating1 Performance                    H1        H1        %        Restricted lending impacts new and used
                                        FY2018    FY2019    change
                                         ($m)      ($m)                 volumes
                                                                       Slowing market resulted in discounts on new
Revenue                                 2,674.7   2,717.8    1.6%
                                                                        car margins
EBITDA                                   87.7      73.0     (16.8%)
EBITDA %                                 3.3%      2.7%                Underperformance of key brands in AHG
EBIT                                     77.5      56.8     (26.8%)     portfolio
EBIT %                                   2.9%      2.1%                Victorian portfolio challenged
Profit Before Tax                        64.8      40.0     (38.3%)    F&I income stabilised and set to improve on
Operating1 –   excludes unusual items
                                                                        increased penetration and GFV products
                                                                       Strong performance from Trucks and Carlins

                                                                                                                      14
Automotive Opportunities

 WA market recovery (down 24% from peak)

 Normalisation of manufacturer targets

 Cost‐out initiatives

 Shared services

 Increased F&I penetration

 Increased availability of GFV and other products

 Acquisition opportunities at realistic multiples

 Adjacent expansion opportunities in rental, fleet, subscription etc.

  Well positioned to benefit from cyclical recovery
                                                                         15
easyauto123 – Opportunity to be No 1 National Used Car Brand
 Investing to create a branded used car leadership position
 Craig Bigley (ex Officeworks GM) appointed EGM
 Strong customer proposition
 Developing omni‐channel capability
 Leverage AHG scale with Carlins and fleet relationships
 Five stores operating in Perth (2), Melbourne, Sydney and Brisbane
 Targeting break even by end of Q4 FY2019
 Significant upside potential post proof of concept

                                                                       16
The aspiration

  CarMax is the NYSE listed pre‐owned US market leader with   easyauto123 aspiration if achievement of same
  true national market coverage                               2.5% share of total market as CarMax

           40M                                                               3M
       US pre‐owned                                                      AU pre‐owned
       Market units pa             $680B*                                Market units pa            $67B^
                               US pre‐owned                                                        AU pre‐owned
                               Market revenue                                                      Market revenue

                1m                                                               75k
                                                                                 EA123
           CarMax annual
               sales               $17B*                                        potential            $1.5B^
                                                                               annual sales            EA123
                                    CarMax
                                                                                                      potential
  2.5%                              revenue                         2.5%                              revenue
  Market                                                            Market
  share                                                             share                                           17
                  *quoted as USD                                                  ^quoted as AUD
Automotive performance – easyauto123

Operating1 Performance                    H1       H1       %         Developing scale, people and processes
                                        FY2018   FY2019   change
                                         ($m)     ($m)
                                                                      Increasing conversion levels
Revenue                                  61.9     67.4     8.9%
                                                                      Increasing IPRU
EBITDA                                   (1.5)    (5.1)   (234.4%)
EBITDA %                                (2.5%)   (7.6%)
EBIT                                     (1.8)    (5.5)   (204.5%)
EBIT %                                  (2.9%)   (8.2%)
Profit / (Loss) Before Tax               (2.3)    (6.2)   (165.1%)
Operating1 –   excludes unusual items

                                                                                                                18
Refrigerated Logistics ‐ Number 1 Position in Market

 Largest player in temperature‐controlled transport and storage

 Well positioned for growth

 Strong pipeline of new business opportunities (both organic and
  inorganic)

 Strong focus on WHSE and Chain of Responsibility

 Industry‐leading systems and processes

 Strong customer delivery performance

 Opportunity for operational benefits from single Warehouse
  Management and Transport Management Systems

                                                                    19
Refrigerated Logistics
Operating1 Performance                  H1       H1       %
                                      FY2018   FY2019   change    Revenue stabilised post HNA disruption and
                                       ($m)     ($m)               TMS implementation
Revenue                               291.3    297.7    2.2%
                                                                  Produce season adversely affected by weather
EBITDA                                 22.6     23.2    2.5%
EBITDA %                               7.8%     7.8%              Price increases implemented in November
EBIT                                   8.3      8.0     (3.2%)
                                                                  Strong new business pipeline established
EBIT %                                 2.8%     2.7%
Profit Before Tax                      2.0      3.1     56.3%

Operating1 – excludes unusual items

                                                                                                                20
Strategic Review Process

 Strategic review announced
  Mandate to consider all options to maximise value for shareholders
  Assess how future growth opportunities can best be unlocked
  Improved performance from recent transformation program
  UBS and Luminis Partners appointed as joint advisers

                                                                        21
Refrigerated Logistics – Opportunities

Short term opportunities:                            Longer term opportunities:
   Revenue, yield management                           Capacity expansion
   Improved transport utilisation (TMS                 Acquisitions
    benefits)                                           Move into more end‐to‐end
   Realise ERP and WMS benefits                         complex solutions
   Cost reductions                                     Asia‐Pacific supply chain
   Fleet investment to improve fuel
    efficiency

                                   Target EBITDA margin 10%
                                                                                     22
Other Logistics performance

Operating1 Performance                    1H       1H       %         AMCAP performance stable
                                        FY2018   FY2019   change
                                         ($m)     ($m)
                                                                      KTM and Husqvarna impacted by FX and
Revenue                                 137.1    134.8     (1.7%)      motorcycle market decline
EBITDA                                   3.8      3.1     (18.2%)
                                                                      VSE/GTB integrated with AHG Trucks
EBITDA %                                 2.8%     2.3%
EBIT                                     2.4      1.7     (27.5%)
EBIT %                                   1.8%     1.3%
Profit / (Loss) Before Tax               2.3      (0.6)   (125.3%)
Operating1 –   excludes unusual items

                                                                                                              23
Group outlook

 FY guidance $52 million to $56 million (Operating1 NPAT)

 Stronger H2 driven by:

  Refrigerated Logistics revenue growth

  Franchised Automotive improvement from cost down and
   the re‐basing of OEM targets

  Franchised Automotive H2 benefit from Sydney hail sale

  easyauto123 targeting break even by end of Q4 FY2019

                                                                                                24
                                                            Katherine Strahan, AHG technician
FY2019 HALF‐YEAR RESULTS – APPENDICES
Friday 22 February 2019
12

    Executive Management Strength

                                                                       Managing Director
                                                                        John McConnell

                                          CoSec / General Counsel                                 CFO
                                              David Rowland                                    Adam Irving

      CIO           Chief HR Officer    GM Finance          Refrigerated Logistics CEO     KTM/HQVA EGM      easyauto123 EGM   Franchised Auto COO   AHG Trucks GM
Eugene Kavanagh        Jo Cairns       Gus Kininmont              Stephen Cleary              Jeff Leisk        Craig Bigley       Tony Cramb        Simon Ramsay

                                                                                                                                  Territory GMs       Franchised
                                                                                                                                                      Dealerships

                                                                                                                                   Franchised          VSE / GTB
                                                                                                                                   Dealerships

        Appointed
         CY2018
Automotive
Automotive focus framing strategic objectives
                                         Franchised Auto partner of choice
                                         Expand relationships with enhanced customer service
                                         and innovation

                                         Leveraging scale
          Optimise      Partner of       Established national franchised automotive and
          portfolio     choice for       national truck structure to optimise scale benefit
                          OEM
                                         Cost reduction
       Grow                              Heavy focus on cost reduction, productivity, and
                             Leverage
       market                            shared services opportunities
                               scale
       share                  benefit
                                         Grow our market share
                  Reduce                 Well positioned to continue market aggregation and
                  cost to                expand used car platforms
                   serve
                                         Optimise portfolio
                                         Portfolio review to optimise franchise coverage,
                                         business segments and strategic position
Franchised Automotive

Australasia’s largest automotive retail group.

AHG represents 27 manufacturers, including all of the top 14* selling passenger brands in Australia.

Stable long‐term relationships with manufacturers and financiers.

Opportunities exist for further acquisitions.

Cost‐down initiatives offer further opportunity to leverage scale.

*VFACTS issued January 2019.
Franchised Truck

Standalone division created April 2017.

Strong operating performance.

Significant synergies and opportunities realised by forming a national truck structure.

Strong long‐term relationships with leading manufacturers.

Opportunities exist for further acquisitions.
Refrigerated Logistics
The Evolution

AHG acquires Rand                 ACQUISITION

    1986              2007                        2010       2011   2012     2013       2014      2015

                                  DEVELOPMENT

                     Sydney                     Melbourne                    Perth               Sydney
                    cold store                  cold store                 cold store          Development

                    22,500*                      16,500*                    19,142*              45,500*
                *Pallet numbers
                                                 Brisbane                   Adelaide
                                                cold store                 cold store

                                                 10,280*                     5,500*
AHG RL

   20+ sites across Australia
   ~600 prime movers and rigid trucks
   ~1,260 refrigerated trailers
   ~500 refrigerated rail cars
   ~ 4,000,000 km covered weekly
   ~ 175,000 pallets storage
FY2019 HALF‐YEAR RESULTS
Friday 22 February 2019
You can also read