Fully incorporating the derecho - Iowa State ...
←
→
Page content transcription
If your browser does not render page correctly, please read the page content below
A Business Newsletter for Agriculture
Vol. 24, No. 12 www.extension.iastate.edu/agdm October 2020
Fully incorporating the derecho
By Chad Hart, extension economist, 515-294-9911, chart@iastate.edu
With the September 30, 2020 of the derecho and drought to But those losses provided the
Grain Stocks report, usda.library. the corn and soybean crops spark in price recovery for corn
cornell.edu/concern/publications/ currently being harvested. The and soybeans this harvest season.
xg94hp534, USDA provided a Grain Stocks report showed the
concluding piece of information amounts of last fall’s crops that Let’s start with the damage to this
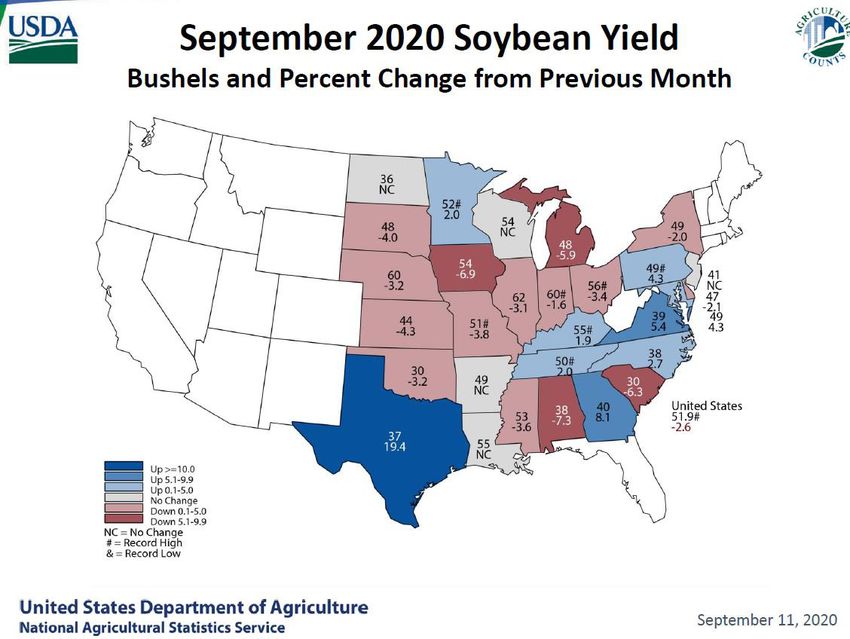
on the impact the derecho had on were forced to move or were lost year’s crops. Figures 1 and 2 show
the Iowa and national crop supply due to the damage at grain storage USDA’s September yield estimate
picture. The September update and handling facilities. In total, maps for corn and soybeans.
of the Crop Production report hundreds of millions of bushels continued on page 2
revealed the combined damage were lost.
Handbook updates
Figure 1. National corn yield estimates (Source: USDA-NASS) For those of you subscribing
to the handbook, the following
update is included.
Cash Corn and Soybean Prices
A2-11 (4 pages)
Farmland Value Survey,
REALTORS® Land Institute
C2-75 (2 pages)
Please add this file to your
handbook and remove the
out-of-date material.
continued on page 6
Inside . . .
Understanding stats in USDA Hogs
and Pigs reports.....................Page 4
Ag Decision Maker is compiled by
extension ag economists
Ann Johanns, aholste@iastate.edu
extension program specialist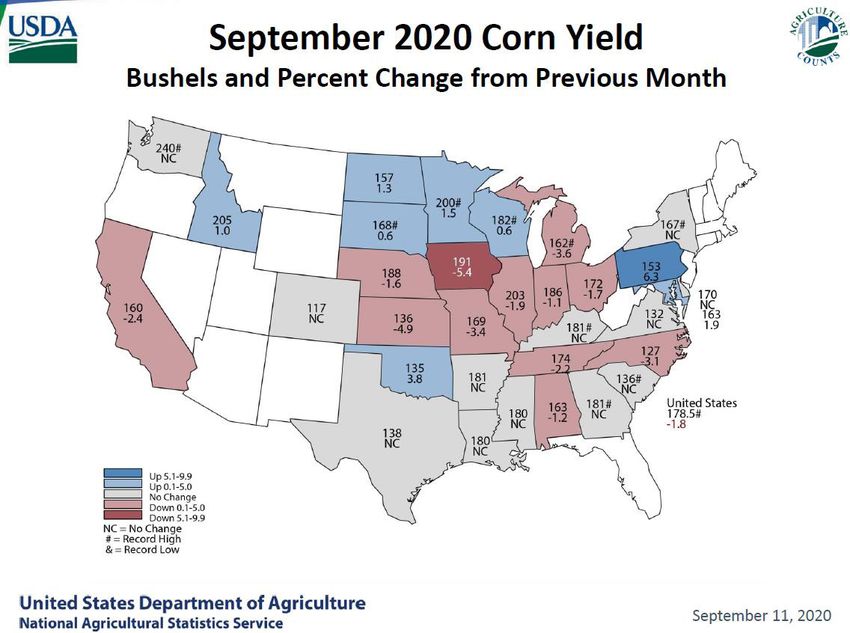
2 October 2020
Fully incorporating the derecho, continued from page 1
The impact from drought
conditions can be seen from Figure 2. National soybean yield estimates (Source: USDA-NASS)
Kansas to Ohio, while the
August 10, 2020 derecho
was mainly an Iowa event
(from an agricultural
perspective). While the
national corn yield estimate
is still at a record level,
USDA pulled the estimate
down 3.3 bushels per acre
to 178.5 bushels per acre.
The drop in yield, combined
with a reduction in expected
harvested area, translates
to a loss of 378 million
bushels of corn nationwide.
For Iowa, the yield drop
was much more dramatic,
falling by 11 bushels per
acre. USDA reduced Iowa’s
projected harvested corn
area by 550,000 acres, based terminal locations prepare to take in this year’s
on a resurvey of Iowa farmers. The combination crops. Early estimates for Iowa indicated roughly
resulted in a 254 million bushel decline in Iowa’s 120 million bushels of storage capacity was lost due
expected corn production. So Iowa roughly accounts to the derecho, with approximately half coming
for two-thirds of the nation’s corn losses. from on-farm storage and half from commercial
operations. Losing storage capacity is not the same
The soybean estimates mimic the corn estimates. as losing bushels in storage. So it’s an open question
The drought affected soybeans from the Great Plains how much of the crops stored going into the derecho
to Ohio, while the derecho centered on Iowa. The were lost in the storm and how many bushels had
national soybean yield estimate was reduced by to be quickly moved into the market because of the
1.4 bushels per acre to 51.9 bushels per acre. Again, storage damage. The Grain Stocks report provided
it’s still a record yield, just not quite as high as first the initial answers to those questions and traders
thought. Projected soybean harvested area was held were surprised by the answers.
steady at 83.02 million acres. So the yield loss by
itself translated into a 112 million bushel drop in Supplies and stocks
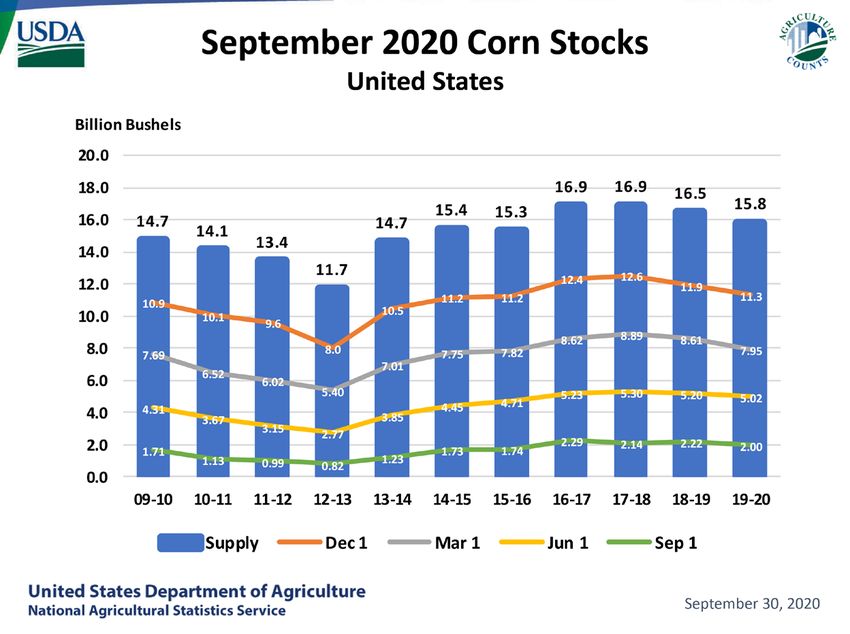
projected national soybean production. The Iowa The 2019/20 ending stocks for corn were estimated
yield estimate fell from 58 bushels per acre in August at two billion bushels. That is 200 million to 300
to 54 bushels per acre in September, which translates million less than the trade expected. And smaller
to a 37 million decline in Iowa’s projected soybean stocks tend to lead to higher prices. While corn usage
production. So once again, Iowa’s losses make up a for ethanol and export shipments were reduced over
sizable portion of the national reductions. the June-August period, the derecho impact and
livestock feed needs drove corn disappearance higher
Impact on storage capacity and stocks lower. While COVID-19 continues to
New crop supplies felt the sting of the drought shape corn usage, through the impacts of reduced
and derecho, but the damage was not limited to travel on ethanol demand and increased feed needs
farm fields. The derecho also destroyed some crop as the livestock industry works to clear the animal
handling and storage facilities. In fact, that damage backlog from processing plant closures, the derecho
is still being assessed as farmers, elevators, and forced more corn out into the market as it busted
continued on page 3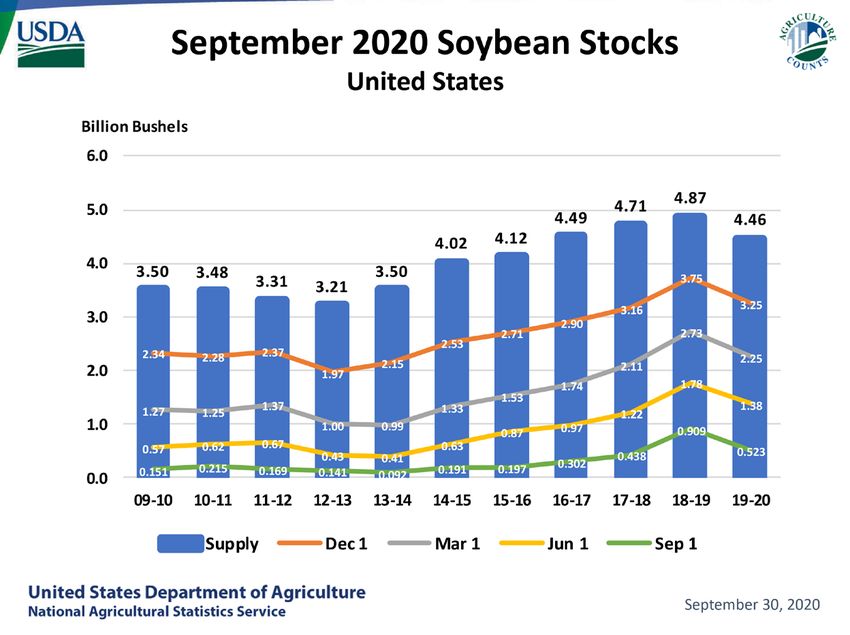
3                                     October 2020

Fully incorporating the derecho, continued from page 2

bins and raised quality concerns for the        Figure 3. Corn supplies and stocks (Source: USDA-NASS)
corn suddenly exposed by the storm.
Based on historical patterns, Iowa corn
stocks dropped by 50-100 million
bushels more than usual for the June-
August period, highlighting the storm’s
impact.

Soybean stocks revealed a similar
story. The USDA found less soybeans
in storage than the trade expected.
The increased disappearance was a
combination of increased feed use and
storage crop losses. And Iowa’s stocks
dropped a bit more than usual due to
the derecho’s impact on
storage facilities.

Before the derecho, national corn
supplies for 2020/21 were estimated
at 17.531 billion bushels. Now, the              Figure 4. Soybean supplies and stocks (Source: USDA-NASS)
estimate currently stands at 16.92
billion bushels. That 611 million bushel
drop is mainly due to the drought and
derecho. Similarly, soybean supply
estimates declined 204 million bushels
over the same time period. Those supply
reductions, along with a boost in export
sales, have provided a contra-seasonal
boost to prices. While USDA has season-
average price estimates of $3.50 per
bushel for corn and $9.25 per bushel for
soybeans, the futures markets indicate
season-average prices in the $3.70 per
bushel range for corn and nearly $10.00
per bushel for soybeans, providing a late
season opportunity to put in some price
protection before the bulk of the harvest
comes in.

The price rallies are both good and bad
news to Iowa crop producers. For those not               is being set in October. Price rallies this time of year
dramatically impacted by the drought and                 tend to lower crop insurance payments for those
derecho, the price rallies set up the potential          producers who bought revenue insurance. And that
for increased revenues this crop year. But               is what is happening for corn farmers right now. That
for those who bore the brunt of weather                  will continue to be the case unless or until the rally
conditions this year and are relying on crop             pushes the harvest price above the spring insurance
insurance for a majority of their revenue, the           price of $3.88 per bushel. Current soybean prices
price recovery is coming at an inopportune               have already rallied past the spring insurance price of
time. The harvest price for crop insurance               $9.17 per bushel.
4                                                 October 2020

                 Understanding stats in USDA Hogs and Pigs reports
                     By Lee Schulz, extension livestock economist, 515-294-3356, lschulz@iastate.edu

Analysts spend a lot of time scrutinizing estimates in                  Why this interest in statistical analysis?
USDA’s Hogs and Pigs reports, usda.library.cornell.                     USDA’s estimates of the two heaviest weight
edu/concern/publications/rj430453j. Amid our                            categories on Sept. 1, 2020 came in well above
disagreement, or agreement, over a specific number,                     the average trade guess in advance of the report.
we can easily overlook the fact that every number is                    The 180-pounds and over inventory was up 9.8%.
an estimate that falls within a statistical range.                      Analysts pegged it up between 1.0% and 6.6% from
                                                                        a year ago with an average of up 2.6%. Market hogs
A USDA point estimate is just one plausible value                       weighing 120 to 179 pounds were up 6.1% compared
within a particular confidence interval. All estimates                  to an average of pre-report expectations of up 1.5%.
that are based on survey data have a statistical                        All market hogs, at 72.766 million head, were up
margin of error.                                                        0.8% from last year, which was closer to the average
Computing the root mean square error, 90%                               trade guess of up 0.1% (Table 1).
confidence interval and difference between the first                    Declines in the lightweight hog inventories restrained
and last estimate can help evaluate the reliability of                  growth in the all market hog number. The under
current estimates. USDA publishes these reliability                     50-pounds category was down 3.5% from Sept. 1,
metrics for the all hogs and pigs inventory, pig crop,                  2019, which was one and one-half percentage points
and expected sows farrowing estimates in every report.                  lower than expected. Inventories of hogs weighing

Table 1. USDA Quarterly Hogs and Pigs Report Summary
                                                   United States                                                Iowa
                                                                     2020 as                                                 2020 as
                                         2019          2020          % of ‘19                    2019           2020         % of ‘19
Sept 1 inventory *
 All hogs and pigs                       78,583         79,099             100.7                  25,000         25,100           100.4
  Kept for breeding                       6,431          6,333              98.5                   1,010            980            97.0
  Market                                 72,153         72,766             100.8                  23,990         24,120           100.5
    Under 50 pounds                      23,376         22,559              96.5                   6,360          6,290            98.9
    50-119 pounds                        21,224         20,490              96.5                   8,010          7,630            95.3
    120-179 pounds                       14,654         15,547             106.1                   5,520          5,730           103.8
    180 pounds and over                  12,899         14,169             109.8                   4,100          4,470           109.0

Sows farrowing **
   Mar – May                               3,133          3,172            101.2                      530              510         96.2
   Jun – Aug                               3,275          3,180             97.1                      550              530         96.4
   Sep – Nov 1                             3,265          3,118             95.5                      540              520         96.3
   Dec – Feb 2                             3,158          3,111             98.5                      520              520        100.0

Jun – Aug pigs per litter                  11.11          11.04             99.4                   11.35          11.30            99.6

Jun – Aug pig crop *                     36,369         35,115              96.6                   6,243          5,989            95.9
Full report: https://downloads.usda.library.cornell.edu/usda-esmis/files/rj430453j/gt54mb17j/1j92gz287/hgpg0920.pdf
* 1,000 head; **1,000 litters;
1
  Intentions for 2020.
2
  December preceding year, intentions for 2020/21.
                                                                                                                      continued on page 5
5                                      October 2020

Understanding stats in USDA Hogs and Pigs reports, continued from page 4

50 to 119 pounds were down 3.5% instead of the                 estimate of the market hog inventory will not vary by
expected 0.3% decrease.                                        more than 1.237 million head.

Those differences raise the question as to just how            The 72.766 million head September 1 market
many market hogs are on farms and at what weights.             hog inventory estimate was above pre-report
Those numbers obviously have implications for                  expectations. Suppose the market hog inventory
market prices.                                                 would have come in at the bottom of the 90%
                                                               confidence interval. That would have been 1.237
USDA makes its first estimate in the quarter when              million head lower at 71.529 million head, which
data are collected. As more information, such as final         would have been down 0.9% from last year. Would
slaughter data, becomes available, USDA may revise             there be any more agreement or disagreement with
the estimate each quarter, until one-year post data-           this estimate? That’s hard to say.
collection, which is the final estimate. The largest
changes, if any, usually occur in the first revision.          Slaughter provides some confirmation
The second and third reviews usually result in                 Hog slaughter since September 1 suggests USDA
minimal revisions.                                             might revise the September 1 heavy weight market
                                                               hog inventory estimate downward in the December
A measure of accuracy, or margin of error, is then             report. Most of the 180-pounds and over hogs have
the consistency between the first and final estimate.          already come to market. Since September 1, weekly
Differences for the all hogs and pigs estimates during         federally inspected hog slaughter is down 1.2%
the last 20 quarters have averaged 573,000 head,               compared to the same period in 2019. That is far
ranging from zero head to 1.710 million head. The              below the 9.8% rise implied by the report.
first all hogs and pigs inventory estimate has been
below the final estimate 10 times and above eight              A downward revision in the heaviest-weight market
times and unchanged twice. No bias is obvious.                 hog inventories, within the 90% confidence interval,
Estimates are not consistently different in any                would roughly explain the difference in the estimates
direction. If they were, the market would build this           with the average of pre-report expectations and the
pattern into its expectations.                                 actual slaughter numbers.

What do these statistical measures mean?                       Blurred lines between weaning and
The root mean square error for the all hogs and pigs           marketing
inventory estimate over the past 20 quarters is 1.0%.          Obviously, 2020 has unusual dynamics. Slower
This means the chances are two out of three that the           growth rates could mean hogs are more evenly
final estimate will not be above or below the Sept.            spread across market weight categories than front-
1, 2020 estimate of 79.099 million head by more                end loaded as the report implies. USDA tallied the
than 1.0%. This equates to 790,990 head. The 90%               180-pounds and over category up 9.8% from a year
confidence interval is another view. It says chances           ago, 120 to 179 pounds up 6.1%, and 50 to 119
are 9 out of 10 that the difference will not exceed            pounds and under 50 pounds both down 3.5%.
1.7%, which equates to 1.345 million head.                     Consequently, slaughter rates could change by 3.8
                                                               percentage points and then by 9.6 percentage points
Determining implications for the market hog                    in a matter of weeks. The 13.3 percentage point
inventory requires some extrapolation beyond the               change between market weight categories is the
detail provided in the report.                                 largest in the history of the current weight category
                                                               data back to 2008.
Suppose, for illustration purposes, that the statistical
measures for the market hog inventory match the all            The market eventually provides truth on value.
hogs and pigs measures. The root mean square error             Futures market prices are the collective opinion of
of 1.0% means there is a 67% chance the market hog             everyone who is in the market as to what the price
inventory will not fluctuate by more than 727,660              should be. So far, during the time the heaviest weight
head when comparing it to the final estimate. The              hogs were going to slaughter, prices have risen. In
90% confidence interval of 1.7% over the last 20               fact, nearby contracts have surged. On September 1,
quarters suggests we can be 90% sure that the current          October CME lean hog futures traded at $55.025
                                                                                                   continued on page 6
6                                             October 2020

Understanding stats in USDA Hogs and Pigs reports, continued from page 5

per cwt. On October 8, that contract was at $77.350                      to about $6 per head on average in April and held
per cwt. That’s a 41% gain in just over a month.                         there until late July. The lower end of the price range
December 2020 futures rose 20% over that time.                           was $1.00 per head for several sales. Cash 40-pound
Contracts for 2021 are up about 10%.                                     feeders averaged $16 per head over that same time
                                                                         period. Formula prices averaged $28 per head for 10-
Are finishing facilities looking for feeders?                            to 12-pound pigs. Formula trade for 40-pound pigs is
Factors such as expected market hog prices, feed                         rarely reported.
prices, pig supply, availability of nursery and
finishing space and interest rates drive variation in                    For the week ending October 2, cash 10- to 12-pound
feeder pig values over time. The cash or spot market                     pigs averaged $29.75 per head and 40-pound pigs
can be thought of as a residual market and will often                    were $40.82 per head. Those are 373% and 157%
react preemptively to many of these factors. As such,                    increases, respectively, from this spring and summer.
cash prices tend to lead formula prices in both rising                   Prices are about 5% lower than the same time in 2019.
and falling markets. Prices derived or determined
from the futures market or from a formula based on                       Commercial slaughter and price forecasts
the cost of production show less variability than is                     Table 2 contains the Iowa State University price
observed in cash prices.                                                 forecasts for the next four quarters. Prices are for
                                                                         the Iowa-Minnesota producer sold weighted average
USDA’s weekly National Direct Delivered Feeder Pig                       carcass base price for all purchase types. Basis
report (NW_LS255, www.ams.usda.gov/mnreports/                            forecasts along with lean hog futures prices are
nw_ls255.txt) provides prices quoted on a per head                       used to make cash price projections. The table also
basis delivered to the buyer’s farm and include freight                  contains the projected year-over-year changes in
and fees. The cash price for 10- to 12-pound pigs, fell                  commercial hog slaughter.

Table 2. Commercial Hog Slaughter Projections and Price Forecasts, 2020-2021
                                                                                                CME Futures (9/24/20)
                       Year-over-Year Change              ISU Model Price                Adjusted for IA-MN Producer Sold
                           In Commercial                Forecast, Negotiated           Weighted Average Carcass Base Price
                           Hog Slaughter                     IA/So MN                  for All Purchase Types Historical Basis
                                (percent)                        ($/cwt)                                   ($/cwt)
Oct-Dec 2020                      0.26                            62-66                                     64.34
Jan-Mar 2021                      -4.02                           66-70                                     68.55
Apr-Jun 2021                      7.45                            72-76                                     73.73
Jul-Sep 2021                      0.10                            71-75                                     73.12

 Updates, continued from page 1
 Internet Updates
 The following have been updated on www.extension.iastate.edu/agdm.
 2018 Farm Bill Payment Estimator by County for ARC-CO and PLC – A1-33 (Decision Tool)
 Getting Started in Farming: On the Home Farm – C4-08 (16 pages)
 Current Profitability
 The following tools have been updated on www.extension.iastate.edu/agdm/info/outlook.html.
 Corn Profitability – A1-85                                              Season Average Price Calculator – A2-15
 Soybean Profitability – A1-86                                           Ethanol Profitability – D1-10
 Iowa Cash Corn and Soybean Prices – A2-11                               Biodiesel Profitability – D1-15

This institution is an equal opportunity provider. For the full non-discrimination statement or
accommodation inquiries, go to www.extension.iastate.edu/diversity/ext.
Permission to copy
Permission is given to reprint ISU Extension and Outreach materials contained in this publication via copy machine or other copy
technology, so long as the source (Ag Decision Maker Iowa State University Extension and Outreach) is clearly identifiable and the
appropriate author is properly credited.
You can also read