BITCOIN FUTURES: MARKET EVOLUTION - Cindicator
←
→
Page content transcription
If your browser does not render page correctly, please read the page content below

BITCOIN FUTURES: MARKET EVOLUTION

Cindicator Analytics Team prepared the report “Bitcoin Futures: Market Evolution,” a new
analysis of the emerging market for Bitcoin (BTC) futures.
For this analysis,
Cindicator researchers first looked at volumes on futures and volumes on
crypto exchanges in Bitcoin terms to have an idea about the liquidity and the development of
the market. The second part of the report is dedicated to BTC price and volatility movements
around futures expiry dates to find evidence of repetitive market behaviour during these
periods.
2
Contents
General overview                    4

Futures data analysis               5

Graphical analysis                  7

Regression Analysis                18

Correlation analysis               20

Conclusions and further analysis   25

About Cindicator                   27

Contacts                           27

                                    3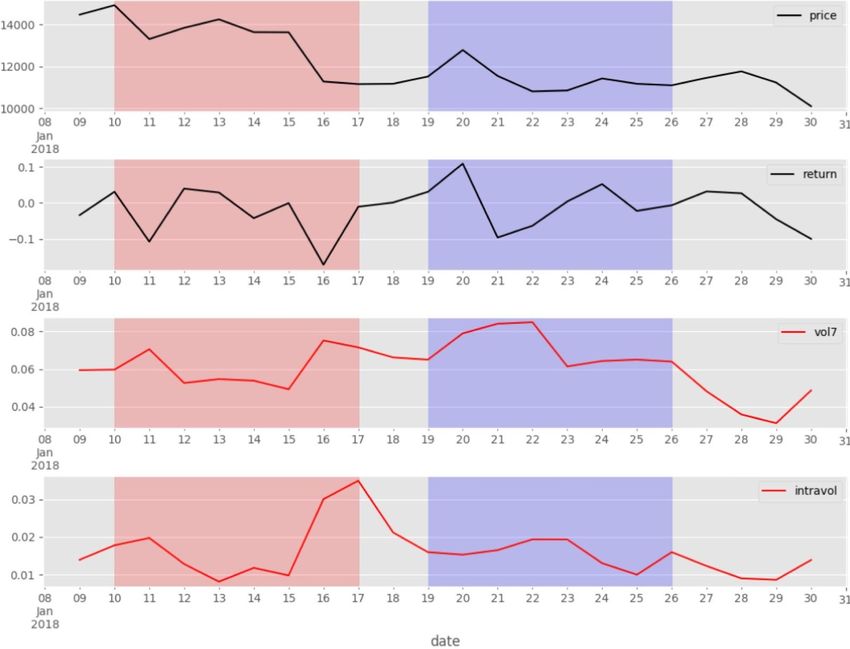
General overview
The first Bitcoin futures were introduced by the CBOE on 10 December last year and, seven
days later, the CME launched its own. The CBOE Bitcoin Futures Contract uses the XBT
ticker and is equal to one Bitcoin with a single price auction at 20:00 UTC on the settlement
date on the Gemini exchange as the final settlement value. The CME Bitcoin Futures
Contract uses the BTC ticker and is equal to five Bitcoins, using the CME Bitcoin Reference
Rate as the daily reference rate. This is an index that references pricing data from
cryptocurrency exchanges, currently made up of Bitstamp, GDAX, itBit and Kraken, taken at
19:45 UTC on its final settlement date.

The decision to allow futures on Bitcoin worried some crypto investors who believed that
these products would bring about the eventual death of the first cryptocurrency, whereas
others in the community thought it would bring lower volatility and thus be a step towards
complete and widespread adoption. After the launches both futures gained popularity and
experienced an increase in volume traded, while Bitcoin’s volatility lowered and its price
suffered a sharp decline of two thirds of the value at the beginning of the year.

In our analysis, we have compared volumes on futures and volumes on crypto exchanges in
Bitcoin terms in order to get an idea about the presence of institutional investors in the
futures market. We then analyse their past positions on futures and compare them to price
movements before futures expiry dates. The second part is dedicated to price and volatility
movements around futures expiry dates, as we try to find evidence of recurrent market
behaviour during these periods. Is it true that the Bitcoin price drops before futures expiries
and recovers after contract fixing?

The first thing to consider is how an investor can be classified as institutional. The investor
category is composed of retail investors and institutional investors such as banks, insurance
companies, hedge funds, investment advisers, endowments, and mutual funds among
others. An unregulated market such as the Bitcoin market makes it nearly impossible to
clearly separate these two categories. Usually, futures contracts are more suitable for
institutional investors given the high contract value and the liquidity a standardised contract
provides. However, looking at volumes data, it is obvious futures are still not common
instruments for taking on exposure on the Bitcoin market. A probable explanation is that
pioneer institutional investors have preferred to trade directly on crypto exchanges, bearing
the risk of holding Bitcoin (or the counterparty risk of leaving them on crypto exchanges),
rather than paying high spreads for a lack of liquidity or risking being barred from closing
their positions by the halting trading mechanisms of CME and CBOE (given the volatility
experienced in the first few months of the year this could have been a viable concern).

                                                                                             4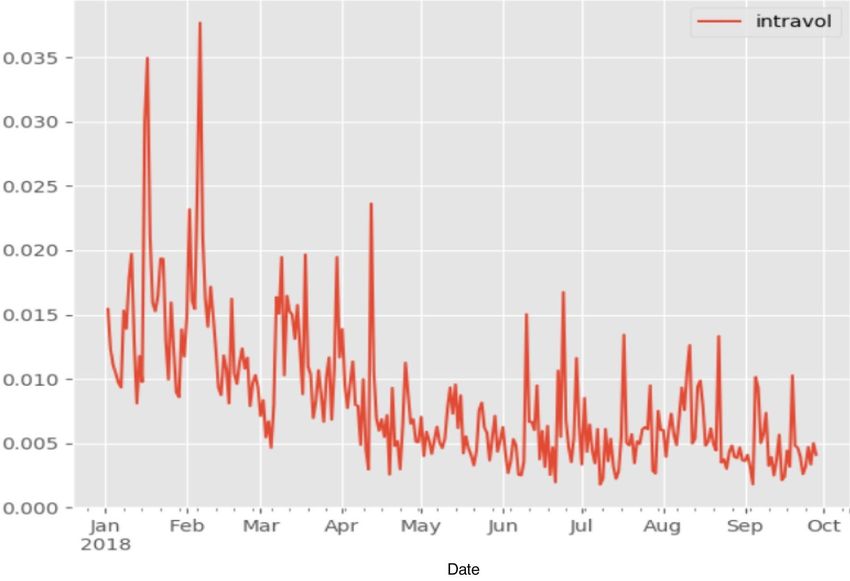
Futures data analysis
Looking at the cumulative volumes of CME and CBOE futures we see that total daily volumes
ranged from 10,000 to 75,000 BTC, with average daily total volumes of USD 17 million and a
maximum of USD 680 million.

Traded futures volumes are considerably lower than total Bitcoins exchanged through the
over-the-counter (OTC1) market, even though we can see a positive variation that highlights
the increase of institutional positions in the crypto market. Considering the drop in recent
OTC volumes with respect to the start-of-year level, it is clear that futures are becoming
more relevant as a trading instrument given their utility in betting against possible price

1
  OTC in this report refers to crypto exchange prices. We use this term only to differentiate it from
futures prices given that futures are standardised sized contracts that are quoted in regulated exchanges

                                                                                                       5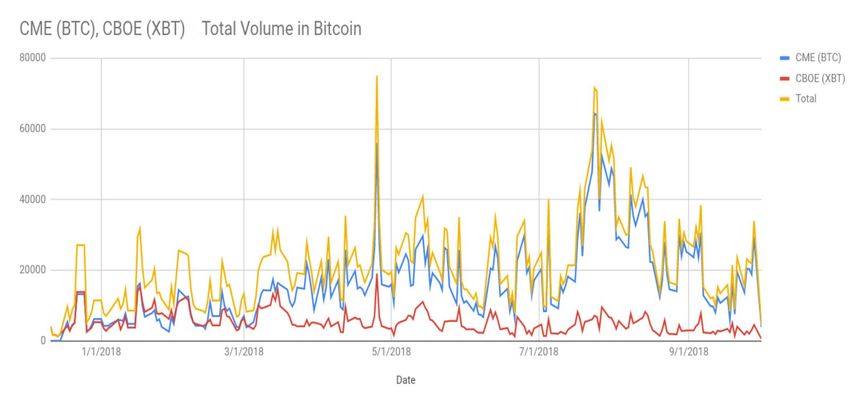
appreciation. This opposite trend can be explained by the entry of new institutional investors
right after Bitcoin’s price volatility decreased. Lower price volatility is a necessary condition
for institutions to consider Bitcoin as an asset in the portfolio construction process.

However, considering the current market, Bitcoins are traded mostly on crypto exchanges
and futures prices have a minor impact on price development. Even though studying futures
prices to predict Bitcoin spot prices seems insufficient, analysing how Bitcoin’s price moves
around futures expiry dates can make sense. This is partly because of arbitrageurs trying to
gain from differences between futures and spot prices that can be produced by lower
liquidity and/or differing demand–supply dynamics of futures and spot investors in the
short term.

                                                                                               6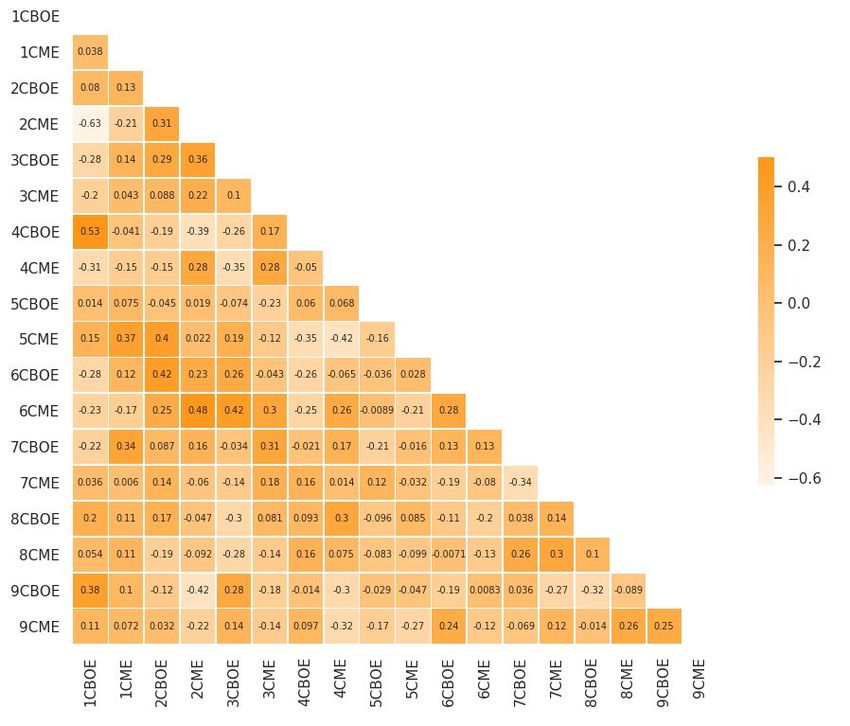
Graphical analysis
Futures expiries:

               CBOE                  |            CME

  Ticker      Month     Last trade   |   Ticker   Month    Last trade

  XBTF8        Jan 18   17/01/2018   |   BTCF8    Jan 18   26/01/2018

  XBTG8        Feb 18   14/02/2018   |   BTCG8    Feb 18   23/02/2018

  XBTH8        Mar 18   14/03/2018   |   BTCH8    Mar 18   29/03/2018

  XBTJ8        Apr 18   18/04/2018   |   BTCJ8    Apr 18   27/04/2018

  XBTK8       May 18    16/05/2018   |   BTCK8    May 18   25/05/2018

  XBTM8        Jun 18   13/06/2018   |   BTCM8    Jun 18   29/06/2018

  XBTN8        Jul 18   18/07/2018   |   BTCN8    Jul 18   27/07/2018

  XBTQ8        Aug 18   15/08/2018   |   BTCQ8    Aug 18   31/08/2018

  XBTU8        Sep 18   19/09/2018   |   BTCU8    Sep 18   28/09/2018

  XBTV8        Oct 18   17/10/2018   |   BTCV8    Oct 18   26/10/2018

  XBTX8        Nov 18   14/11/2018   |   BTCX8    Nov 18   30/11/2018

  XBTZ8        Dec 18   19/12/2018   |   BTCZ8    Dec 18   28/12/2018

  XBTF9        Jan 19   16/01/2019   |   BTCH9    Mar 19   29/03/2019

                                                                        7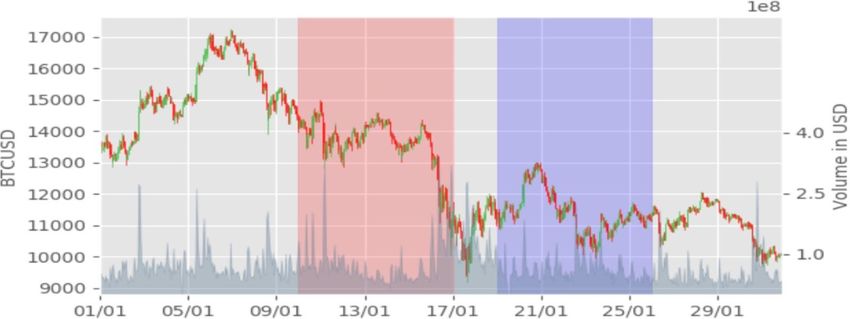
The
red areas represent the seven-day period before the expiries of CBOE futures and the
blue ones
represent the seven-day period before CME expiries.
From a merely graphical point of view, we can see why there is a common belief about the
Bitcoin price tending to drop shortly before each futures expiry and recover after the
contract fixing. This particular pattern occurred frequently during the first expiries but
became less visible after April 2018 and, therefore, we should analyse price patterns in a
more detailed manner.
We observed monthly prices and the evolution of returns from the first expiry until the last
one in September. In addition, we calculated a seven-day rolling volatility series and the
daily intraday volatility of hourly returns in order to look for any abnormal spikes around
futures expiries.
JANUARY 2018 — Expiries of F8 contracts
8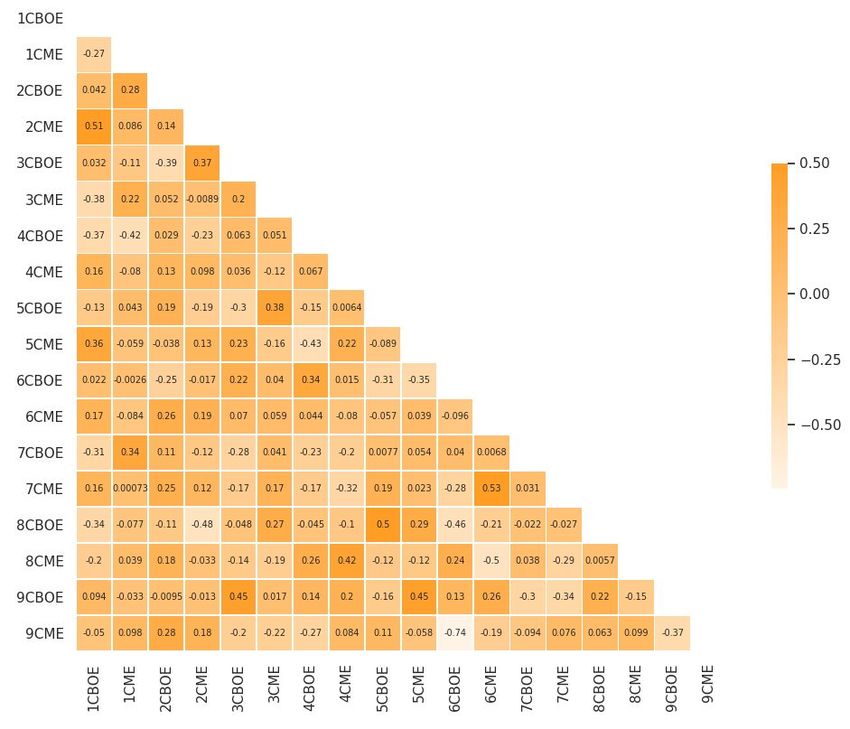
The price pattern in the week before the first expiry of CBOE and CME futures is similar.
Bitcoin’s price dropped before each fix and increased afterwards. Probably because it was the
first expiry, the CBOE futures experienced a spike in intraday hourly return volatilities on
expiry day. This characteristic could have been caused by the uncertainty of market
participants around this event, which is also visible in the dump and pump price behaviour
of Bitcoin between 16 and 17 January. The lower volatility during the first expiry of CME
futures shows the different approach the market had. In fact, the dump and pump
movement, in this case, took eight days from 21 to 29 of January, indicating a smoother
reaction.

FEBRUARY 2018 — Expiries of G8 contracts

                                                                                           9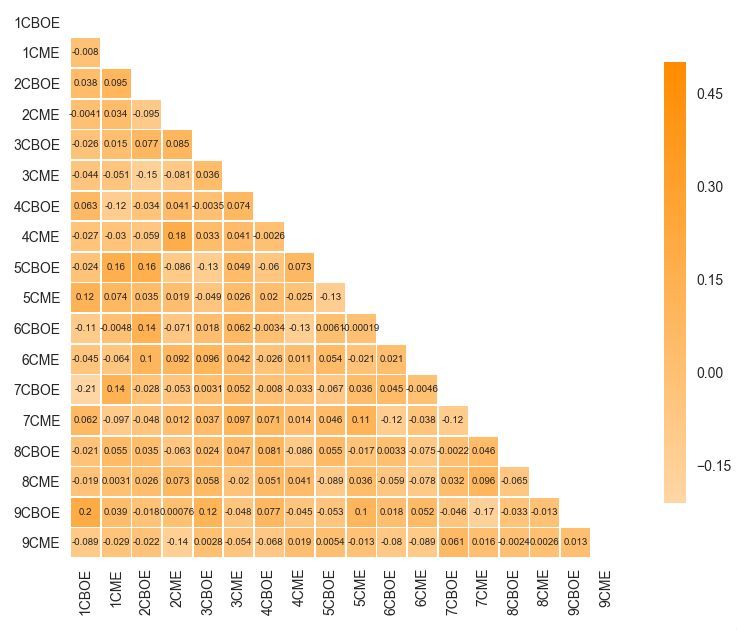
The second expiries for both futures followed the crypto market crash. This huge drop in
Bitcoin’s price had absolutely impacted February returns and volatilities movements, and
decreased the importance of futures expiry events. However, the impending second expiry of
CME futures could have been the reason why the 100% rally, which started after Bitcoin’s
price touched the USD 6,000 level, came to an end. This might have confirmed the market
expectation of negative returns during the futures expiry day.

MARCH 2018 — Expiries of H8 contracts

                                                                                       10
The March expiries were characterised by a bearish Bitcoin market. As already seen during
the first part of February, it seems that futures expiries were losing importance and market
players seemed more focused on the Bitcoin price itself rather than arbitrage opportunities
or futures price movement dynamics. This characteristic was confirmed in the fact that,
despite the drop in price before the expiries, there was no recovery phase during the days
after the rolling futures.
APRIL 2018 — Expiries of J8 contracts
11The same focus on Bitcoin’s price continued in April. Given the relevance of the technical
level tested by prices, market participants were more concerned about support and
resistance barriers rather than pre-futures fixing movements. However, we can see sell-offs
and an increase in volatility right before the expiries, providing more evidence of dump and
pump behaviours around these events.
MAY 2018 — Expiries of K8 contracts
12At the beginning of May, the failure to break the psychological USD 10,000 resistance level
lead to the creation of a bearish trend that caused Bitcoin prices to drop almost linearly from
USD 10,000 to 7,000. As was also discovered in recent months, the bearish trend worried
traders and investors and decreased the focus on futures expiries. Regardless, despite the
small impact of futures on the trend, it is interesting to note that volatilities picked up before
expiries — a price discovery activity signal.
JUNE 2018 — Expiries of M8 contracts
13Before the 13 June CBOE futures expiry, Bitcoin’s price dropped markedly. This could have
been caused by the approaching expiries but was surely exacerbated by the crossing down of
the USD 7,000 support. This broken support level subsequently became a resistance level
and prevented a recovery. Movements around the USD 6,000 level and increasing volatilities
during the last week of the month seem to have been determined more by technical factors
than by positioning for futures expiries.
JULY 2018 - Expiries of N8 contracts
14As in June, technical factors, and especially, the breach of the USD 6,500 level led to a
bullish trend that saw the price testing the USD 8,500 level. Volatilities increased near
expiries but, in contrast with usual behaviour, were determined by positive returns.
AUGUST 2018 — Expiries of Q8 contracts
15The month of August was characterised by a reduction of return volatilities. The Bitcoin
price did not successfully defend the USD 7,000 per unit point and stabilised in the USD
6,000–7,000 range. During August, it seemed that market participants had regained
interest by selling out or reducing contract positions before expiry dates and buying them
back during these events.
SEPTEMBER 2018 — Expiries of U8 contracts
16The sharp decrease in volatilities continued in September. After the umpteenth unlucky
attempt of trading stably above USD 7,000, Bitcoin’s price ranged between USD 6,200 and
6,800. In this environment, futures expiries had practically no impact on token prices and
did not provide any clear trading signal.
17Regression Analysis
To confirm our visual findings that no clear pattern exists, we analysed whether a
relationship exists between Bitcoin returns and futures expiry dates. We employed a
regression with hourly Bitcoin returns as the dependent variable and hourly returns of an
index consisting of high market capitalisation coins and a dummy variable for the expiry of
futures as the independent variables for both a seven- and one-day period before and after
futures expiry dates. Our regression output does not allow us to reject the null hypothesis
that the coefficients for the dummy variables are equal to zero. This result confirms our
previous findings and means that we can’t confirm a role in influencing Bitcoin hourly
returns in the seven-day and one-day periods before and after each expiry. These
relationships might change over time as so far only nine futures expiry dates for CBOE and
CME were considered.
Seven day before expiry
n=6592
Coefficient Std error t
Intercept -0.00006012 0.0000769 -0.782
Dummy variable 0.00003562 0.000 0.335
Index returns 0.7068 0.004 127.087
Seven days after expiry
n=6592
Coefficient Std error t
Intercept -0.00002101 0.0000549 -0.382
Dummy variable -0.0003 0.000 -1.423
Index returns 0.7068 0.004 172.118
18One day before expiry
n=6592
Coefficient Std error t
Intercept -0.0001 -0.0000708 -1.56
Dummy variable 0.0002 0.000 1.472
Index returns 0.7067 0.004 172.097
One day after expiry
n=6592
Coefficient Std error t
Intercept -0.00003277 0.0000549 -0.597
Dummy variable -0.0001 0.000 -0.610
Index returns 0.7068 0.004 127.07
19Correlation analysis
After describing the different behaviours of Bitcoin’s price during futures expiry events, we
calculated pairwise return correlations between contracts in order to confirm the absence of
clear and recurring patterns of the Bitcoin price before and after contract rolling dates.
The correlations are calculated on the basis of hourly returns for seven days before (first
three matrices) and seven days after (last matrix) the events (including expiry day) under
consideration and are computed both between different contracts of the same futures and
between different contracts of different futures.
Total correlation matrix (CBOE and CME futures) - 7 days before
20CBOE correlation matrix—
7 days before
CME correlation matrix—
7 days before
As expected, correlations in the seven-day period before expiries are very low, confirming the
absence of a linear relationship among returns. The non-recurrence of price patterns drew us
21to the same conclusions and tells us that is necessary to consider the higher complexity of
market reactions to these particular events.
Total correlation matrix (CBOE and CME futures)— 7 days after
Exactly the same results are found when computing the hourly return correlation matrix for
the seven-day period following the expiry dates.
In order to focus on the even shorter term, we also calculated correlation matrices for
the day before and on the day of expiries where price movements are most concentrated.
22Total correlation matrix (CBOE and CME futures)— 1 day before
Total correlation matrix (CBOE and CME futures)— During expiry day
23Clearly, a stronger linear relationship is present during this one-day period with respect to
the seven-day period. Even though it is a good signal for analysts looking for common
movements, the signs of these linear relationships do not coincide and make it impossible to
outline a simple trading idea. Given that there wasn’t a common pattern either before or
after each of the rolling dates, we need a deeper and more complex analysis in order to build
a trading strategy around expiry dates.
24Conclusions and further analysis
Looking at the past movements of Bitcoin’s price during rolling dates of futures contracts, it
seems there is no golden trading rule to be extrapolated. We think the presence of bearish
trends and impactful technical levels during price actions can influence Bitcoin prices in a
much stronger way with respect to positioning around futures expiries. In calmer markets or
during bullish trends, it is more sensible to consider expiry dates when building a trading
strategy. The common idea that Bitcoin’s price is always dumped before expiries and
pumped right after them has no solid basis, though it seems valid for consideration during
specific market phases when looking for levels to close or open positions. Conversely, fast
market phases with prices trading around critical resistance or support levels or following
bearish trends pay less attention to futures expiries and therefore, making trading strategies
based on them is ineffective.
Nevertheless, the increasing popularity of futures in recent months also creates a basis for an
increase in the importance of rolling futures. This analysis should be reconsidered when
futures and OTC volumes start to converge, something not so unlikely given the possible
entry of institutional investors into the crypto market fostered by the bearish trend
experienced this year with Bitcoin intraday hourly return volatilities.
The illiquidity of futures, their trading halt mechanisms, the trading closing hours and the
other inefficiencies that financial markets bring are something that it is worthwhile to
investigate. For example, studying how the BBR fixing of CME futures is calculated and the
25arbitrage opportunities it creates could be something that adds value and could help us to
assess the right strategy to follow during rolling futures dates. Evidence of a narrowing of the
spread between the average Bitcoin price on Bitstamp, GDAX, itBit and Kraken, and the
CME futures price could show us whether there is arbitrageur activity and, accordingly,
provide us with trading signals.
26About Cindicator
Cindicator is a fintech company that has been developing its Hybrid Intelligence platform
since 2015. This platform is used by 117,000+ highly motivated decentralized analysts. Their
forecasts on crypto and traditional markets are collected and enhanced with a wide set of
machine-learning models and neural networks. As a result of this symbiosis of humans and
AI, Cindicator creates valuable trading indicators, predictive analytics and sentiments that
improve investment decision-making amid high uncertainty for traders and investors. In
September 2017, Cindicator’s token sale attracted $500 million in applications from which
the team selected 4,507 contributors, raising $15 million and creating the most supportive
and active community possible. To learn more about the Cindicator Products, please visit:
cindicator.com
Contacts
Simon Keusen, Head of Analytics:keusen@cindicator.com
Vlad Kazakov, Product Owner:kazakov@cindicator.com
27You can also read