Perspectives on the 9th August Outages - Energy Link
←
→
Page content transcription
If your browser does not render page correctly, please read the page content below
Perspectives on the 9th August Outages
 ________________________________________________________________
                                                                                        Posted: 17 th August 2021
                                                                                                    By Greg Sise
                   The blackout event of Monday 9th August caused a huge
                 amount of negative publicity for the electricity market, but
                  let’s take a closer look at some interesting aspects of this
                                              event.

I was copied an email on Thursday with a press release from Grey Power, and it made interesting
reading. Grey Power “reacted with anger to the power outages” and suggested that ‘rolling heads’
may not be enough (prison terms perhaps?). Grey Power President Jan Pentecost “said the outage,
and the causes for it, are as clear a signal as it is possible to give that the system of managing and
reticulating electricity is broken beyond repair and a complete overhaul of the industry is now a matter
of urgency.”

I also heard suggestions in the media that generators didn’t offer generation so that they could make
more money. OMG! What has the market come to when Enron-style market manipulation (Enron
deliberately withheld capacity during the California energy crisis of 2000-01) has taken hold here in
New Zealand?

What have we come to? Are we about to witness the ‘end of days’ for the electricity market, as public
pressure forces politicians to act against the evil electricity empires?

I think not.

Based on my experience of the industry over the last 30 years, I am very confident that everyone
involved is dismayed that this happened, does not want it to happen again, and is actively cooperating
with the rest of the industry to make sure that it doesn’t.

The economists might tell us that it is not economic to guarantee supply against every eventuality, but
the reality is that security of supply trumps everything. Anyone with experience in the industry knows
this. It’s in their DNA, and they wrestle with the constant tension between “we must supply” and
“electricity must be cheap”, which are the two things that the vast majority of consumers want. It’s not
always easy to achieve both, but keeping the lights on always takes precedence.

Just to keep this in context, the 9th August event was caused by a combination of adverse weather
and human error, and it seems that when human error is concerned then the perception of being let
down is much greater than the negative feelings against God (as in acts of God). But in terms of
outages, market history shows that we are far more likely to suffer outages due to acts of God than
due to human error.

Now, Grey Power and others might want the market to be overhauled, and I imagine they probably
want the government to take control, but they should be careful what they wish for. I was a teenager
in the 1970s (I know – I don’t look that old!) and well remember eating dinner by candlelight on a few
occasions, which was because the lakes were low, and conservation was needed. Since the spot
market opened in 1996, we’ve had some lowish lake levels with high prices, but the last time we were
seriously at risk of the lakes emptying out was in 1992 when there was a near-monopoly generator in
the form of the SOE called ECNZ (Electricity Corporation of NZ). After an inquiry, it turned out that
ECNZ operated the lakes in a way which anticipated a shortage once in every 20 years. Who’d have
guessed? Consumers weren’t too happy when they found out, so one of the key outcomes of the
inquiry was an increase in this standard to 1 in 60, to match the 60 years of hydro inflow data
available in 1992.

                       Plan and Execute Your Energy Strategy with Confidence
                       Box 478, Level 4, Consultancy House, 7 Bond St, Dunedin, New Zealand

Copyright Energy Link Ltd               Subscribe at http://www.energylink.co.nz/news/blog-152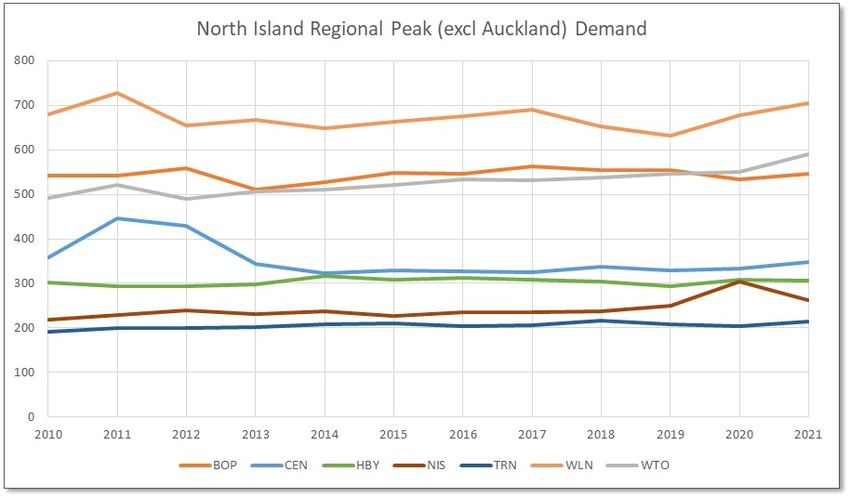
But when ECNZ was finally broken up in 1999, I observed an almost immediate increase in the
implied security standard well beyond 1-in-60, and the market has provided an amazing level of
security of supply in terms of managing dry years.

We should also keep in mind why the market was formed in the first place; in pre-market days, new
generation capacity was often built by government before it was needed, and this over-investment
was underwritten by the taxpayer. Furthermore, the “government previously set wholesale electricity
prices which led to periods in the 1970s of long price freezes, followed by massive price hikes” (from
the report of the Wholesale Market Development Group in 1994).

But turning now to details of the outage of 9th August, it is actually quite well reported by now, so I
want to look at two particular aspects; the new record peak demand of just under 7,100 MW, and the
effect on spot prices during the outage.

If we go back to the 1970s, we can track total electricity consumption using data from MBIE, shown in
this chart.

Demand increased in an almost linear fashion from the early 1970s through to 2006, after which the
growth rate fell dramatically, the result of falling per-household energy consumption and a large
reduction in demand in the wood-pulp-paper processing sector.

Peak demand is roughly proportional to consumption, so the chart suggests that peak demand growth
also stalled after 2006. The next chart shows the NZ peak demand in MW from 2010 through to 2021
(9th August), along with the daily temperature average across Auckland and Christchurch. The
previous high peak year was 2011, which set the peak at just over 6,900 MW.

                       Plan and Execute Your Energy Strategy with Confidence
                       Box 478, Level 4, Consultancy House, 7 Bond St, Dunedin, New Zealand

Copyright Energy Link Ltd               Subscribe at http://www.energylink.co.nz/news/blog-152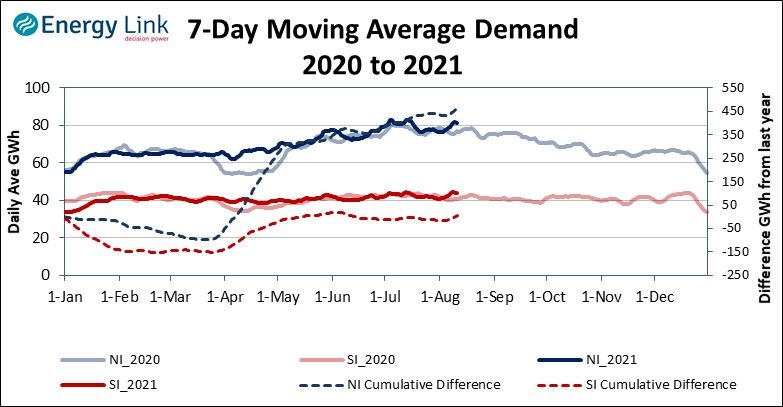
9th August 2021 was a very cold day, and this helps to explain why demand went so high, but the
correlation between the temperature and the peak demand in the chart is actually very low
(approximately zero), which suggests something else is going on.

We should all know by now (Trump supporters and others excepted) that we urgently need to reduce
carbon emissions and that NZ is on a journey, possibly sooner rather than later, to 100% renewable
electricity. Part of this journey includes conversion of industrial and commercial heating demand
away from gas and coal, and over to electricity. Along with population growth, which is keeping the
nation’s tradespeople flat out constructing new homes and other buildings, with heat pumps and other
electrical goodies, this conversion should, in theory, lead to strong demand growth.

Except it hasn’t yet. Or has it? What we may now be seeing are the first signs of stronger demand
growth returning after an absence of a decade and a half.

This next chart appears in our free Energy Trendz Daily report and shows South and North Is daily
energy demand in GWh, averaged over the last seven days. The dashed lines are the difference
between last year and this year. We expected demand to be up on last year because the lockdowns
depressed demand (see Mar-Apr-May 2020 in the chart), and this has happened. But we’ve just had
a large paper mill, with the loss of 1.3 GWh every day of the year and this should be showing in the
chart; but it’s not, which suggests that other demand has increased to fill the gap left by the paper mill.

Can we tell where this demand growth is occurring?

                       Plan and Execute Your Energy Strategy with Confidence
                       Box 478, Level 4, Consultancy House, 7 Bond St, Dunedin, New Zealand

Copyright Energy Link Ltd               Subscribe at http://www.energylink.co.nz/news/blog-152
The next two charts show the peak demand in each load region by year (the 2021 regionals peaks
are not necessarily on 9th August). The Auckland region is not shown because it dwarfs all other
regions and makes the chart difficult to read, but suffice to say that Auckland’s peak is not significantly
up this year.

The two regions that stand out in the North Is are WTO (Waikato) and North Isthmus (NIS), which
both show strong trends upward (NIS 2020 peak, for example), although NIS demand will fall next
year by around 10%, as the Marsden Pt oil refinery converts to an input terminal.

But in the South Is the recent growth in the peak in the metropolitan Canterbury (CAN_M) is quite
remarkable, with strong growth also exhibited in Otago (OTG). Rural Canterbury is also up, a function
of the big increase in irrigation, but this region’s demand won’t increase at the same rate in future for
a variety of reasons, and it’s peak now tends to occur in summer.

                            South Island Regional Peak Demand
 800

 700

 600

 500

 400

 300

 200

 100

  0
   2010   2011   2012     2013      2014    2015     2016   2017   2018   2019    2020   2021

                  CAN_M          CAN_R     NEL      OTG     SCN    TWC      WEC

What these charts show is that demand peaks are increasing rapidly in some regions, and the
question is: how quickly this trend will accelerate as the journey to 100% renewables intensifies?

There was a lot of comment in the media about the HVDC link not running to capacity on 9th August,
but it turns out that it was limited by the amount of energy available to go north: demand was so high
in the South Is that even with all available South Is generation running, there wasn’t even 600 MW of
spare energy to go north. This is quite remarkable also, but partly explained by the fact that the

                          Plan and Execute Your Energy Strategy with Confidence
                          Box 478, Level 4, Consultancy House, 7 Bond St, Dunedin, New Zealand

Copyright Energy Link Ltd                        Subscribe at http://www.energylink.co.nz/news/blog-152
combined growth in peak demand between metro Christchurch and Otago is around 170 MW just in
the last three years.
Scarcity Pricing
There is one other aspect of the 9th August outage which is brand new; this is the first time that the
scarcity provisions in the electricity Code (market rulebook) have triggered.
These provisions were introduced in 2012 and apply when there is insufficient generation offered in a
half hourly trading period to supply demand, resulting in customers being disconnected. This can
occur for the whole country, or just for an island, in this case the North Is.
The procedure starts with the calculation of the generation-weighted average spot price (GWAP) in
the island, using the usual spot price calculation method. If this is less than $10,000/MWh ($10 per
kWh) then all spot prices in the island are scaled up so that the GWAP equals $10,000/MWh. If it is
greater than $10,000/MWh then all spot prices in the island are scaled down so that the GWAP
equals $20,000/MWh.
On the evening of 9th August, prices were issued at these levels for the two hours of the outage, at
around $10,000/MWh.
The scarcity prices are intended to do two things, firstly to ensure that prices are set at levels
reflecting the price that some economist has worked out that spot-exposed consumers might be
prepared to pay to avoid loss of supply at short notice. In a hypothetical perfect market, consumers
would bid up the price until the market clears, resulting in the market price settling at a high value,
reflecting the value that consumers put on supply. This can’t happen consistently in our electricity
market because everything happens at light speed, so scarcity prices are a proxy for this perfect
market mechanism.
Secondly, it was thought that scarcity prices may help to incentivise new peaking plant to enter the
market.
I don’t believe that scarcity pricing achieves what it’s supposed to do. On the consumer side,
although most consumers pay fixed prices and not spot prices, those that pay spot prices can end up
having no warning that they are about to face prices of $10,000/MWh; if they knew that, they might
decide to turn off their electrical loads!
Worse than that, independent retailers, who buy from the spot market to supply customers at fixed
prices, already have slim profit margins and face considerable difficulty hedging their exposure to spot
prices. Scarcity prices hit these retailers very hard, and already Electric Kiwi has contacted the
Electricity Authority to claim a “Pricing Error” and an “Undesirable Trading Situation”.
Worse still, any generator relying on scarcity prices to earn a return on their new peaking plant would
have to wait a very long time for them to occur, and guess what – they’ve just become even less likely
to occur in future!
It’s a big ‘fail’ for scarcity pricing and these rulebook provisions need to change.
For generators, there is also a disparity between the Code requirement to conduct their trading in a
manner consistent with a competitive market at all times, and the level at which scarcity prices are
set. Going back to 2011, Genesis was smacked over the hands by the Authority for offering to
generate at Huntly during a potential shortage at prices of close to $20,000/MWh, and then told that
$3,000/MWh was more reflective of the costs of keeping the ageing Huntly power station available for
emergencies.
So, what if Genesis were to offer to generate at $3,000/MWh (or less) during a scarcity pricing
situation? It would get paid between $10,000/MWh and $20,000/MWh. Talk about conflicting signals!
Genesis copped a lot of flack for not turning on its third Rankine unit at Huntly on 9th August. Now I
don’t want anyone to think I am an apologist for generators, but think about it: the unit takes up to 10
Plan and Execute Your Energy Strategy with Confidence
Box 478, Level 4, Consultancy House, 7 Bond St, Dunedin, New Zealand
Copyright Energy Link Ltd Subscribe at http://www.energylink.co.nz/news/blog-152hours to start from cold, so it would have to be offered at low prices to get to, and to stay at its
minimum operating level of around 60 MW, well in advance of the peak. By running, the outages
would not have occurred, prices would be much lower, and it would have run at a loss (at its minimum
output). Worse still, it might have stopped renewable plant from running. Then, of course, we’d have
a ‘nasty coal-burning monster’ sitting there destroying the planet.
By not running, Genesis made a loss because it had to buy out of the spot market at $10,000/MWh to
supply its customers, who buy at fixed prices of around $100/MWh (this is just for the wholesale
energy component of the customers’ bills), while not generating enough to fully offset these large bills
with generation revenue earned at $10,000/MWh.
Damned if they do and damned if they don’t.
None of this is any comfort for consumers that sat in the dark for two hours, and I’m not making
excuses for anyone, just trying to put things in perspective. What consumers and the industry want, is
very, very reliable supply, at low cost. In the short term, outages like 9th August can be avoided by
better processes and communication within the market. But in the longer term, while we still need
fossil-fuelled plant in the market on the way to 100% renewables, we need to reduce our reliance on
the ageing Huntly units because they are not flexible enough to fulfill the increasingly volatile and
demanding role required of them.
Genesis is actively pursuing a strategy to replace them with renewable generation. Then, to get to
100% renewables, to avoid scarcity pricing situations, we need new energy storage, and lots of it. But
that’s another blog…
Plan and Execute Your Energy Strategy with Confidence
Box 478, Level 4, Consultancy House, 7 Bond St, Dunedin, New Zealand
Copyright Energy Link Ltd Subscribe at http://www.energylink.co.nz/news/blog-152You can also read