Ninety One Managed Fund - Gail Daniel 14 July 2020

Page created by Marcus Ball
 
CONTINUE READING
Ninety One Managed Fund - Gail Daniel 14 July 2020
Ninety One Managed
Fund

Gail Daniel
14 July 2020
Ninety One Managed Fund - Gail Daniel 14 July 2020
Important information

All information and opinions provided are of a general nature and are not intended to address the circumstances of any particular individual or entity. We are not acting and do not
purport to act in any way as an advisor or in a fiduciary capacity. No one should act upon such information or opinion without appropriate professional advice after a thorough
examination of a particular situation. This is not a recommendation to buy, sell or hold any particular security.
Collective investment scheme funds are generally medium to long term investments and the manager, Ninety One Fund Managers SA (RF) (Pty) Ltd, gives no guarantee with respect
to the capital or the return of the fund. Past performance is not necessarily a guide to future performance. The value of participatory interests (units) may go down as well as up.
Funds are traded at ruling prices and can engage in borrowing and scrip lending. The fund may borrow up to 10% of its market value to bridge insufficient liquidity. A schedule of
charges, fees and advisor fees is available on request from the manager which is registered under the Collective Investment Schemes Control Act. Additional advisor fees may be
paid and if so, are subject to the relevant FAIS disclosure requirements. Performance shown is that of the fund and individual investor performance may differ as a result of initial fees,
actual investment date, date of any subsequent reinvestment and any dividend withholding tax. There are different fee classes of units on the fund and the information presented is
for the most expensive class. Fluctuations or movements in exchange rates may cause the value of underlying international investments to go up or down. Where the fund invests in
the units of foreign collective investment schemes, these may levy additional charges which are included in the relevant TER. Additional information on the funds may be obtained,
free of charge, at www.ninetyone.com. Ninety One SA (Pty) Ltd (“Ninety One SA”) is an authorised financial services provider and a member of the Association for Savings and
Investment SA (ASISA).
Investment Team: There is no assurance that the persons referenced herein will continue to be involved with investing for this Fund, or that other persons not identified herein will
become involved with investing assets for the Manager or assets of the Fund at any time without notice.
Investment Process: Any description or information regarding investment process or strategies is provided for illustrative purposes only, may not be fully indicative of any present or
future investments and may be changed at the discretion of the manager without notice. References to specific investments, strategies or investment vehicles are for illustrative
purposes only and should not be relied upon as a recommendation to purchase or sell such investments or to engage in any particular strategy. Portfolio data is expected to change
and there is no assurance that the actual portfolio will remain as described herein. There is no assurance that the investments presented will be available in the future at the levels
presented, with the same characteristics or be available at all. Past performance is no guarantee of future results and has no bearing upon the ability of Manager to construct the
illustrative portfolio and implement its investment strategy or investment objective.
In the event that specific funds are mentioned please refer to the relevant minimum disclosure document in order to obtain all the necessary information in regard to that fund.
This presentation is the copyright of Ninety One SA and its contents may not be re-used without Ninety One SA’s prior permission.

                                                                                                                                                                                          2
Ninety One Managed Fund - Gail Daniel 14 July 2020
Ninety One Managed Fund
Performance

Annualised performance in ZAR
                                                                                  Managed R Inc                           Managed A Inc                           (ASISA) South African MA High Equity
                                                 16.0%

                                                 14.0%

                                                 12.0%

                                                 10.0%

                                                  8.0%

                                                  6.0%

                                                  4.0%

                                                  2.0%

                                                 0.0%
                                                                        1 year                       3 years p.a.                    5 years p.a.                    10 years p.a.                    20 years p.a.

Managed R Inc                                                          10.6%                             9.1%                             8.8%                            12.3%                            13.6%

Managed A Inc                                                           9.1%                             8.1%                             7.7%                            11.3%                            12.8%

(ASISA) South African MA High Equity                                    0.5%                             3.6%                            3.5%                              8.1%                            10.8%

Past performance is not a reliable indicator of future results, losses may be made.
Source: Morningstar, dates to 30 June 2020, performance figures above are based on lump sum investment, NAV based, inclusive of all annual management fees but excluding any initial charges, gross income reinvested,
fees are not applicable to market indices, where funds have an international allocation this is subject to dividend withholding tax, in South African Rand.
Inception date of R share class: 10 February 1994. Inception date of A share class: 02 May 2000
Annualised performance is the average return per year over the period. Individual investor's performance may vary depending on actual investment dates. Highest and Lowest returns are those achieved during any rolling
12 months over the period specified. Since inception of R share class: Apr-06 48.0% and Feb-09 -22.9%; Since inception of A share class: Apr-06 47.2% and Feb-09 -23.0%
The Fund is actively managed. Any index is shown for illustrative purposes only.                                                                                                                                           3
Ninety One Managed Fund - Gail Daniel 14 July 2020
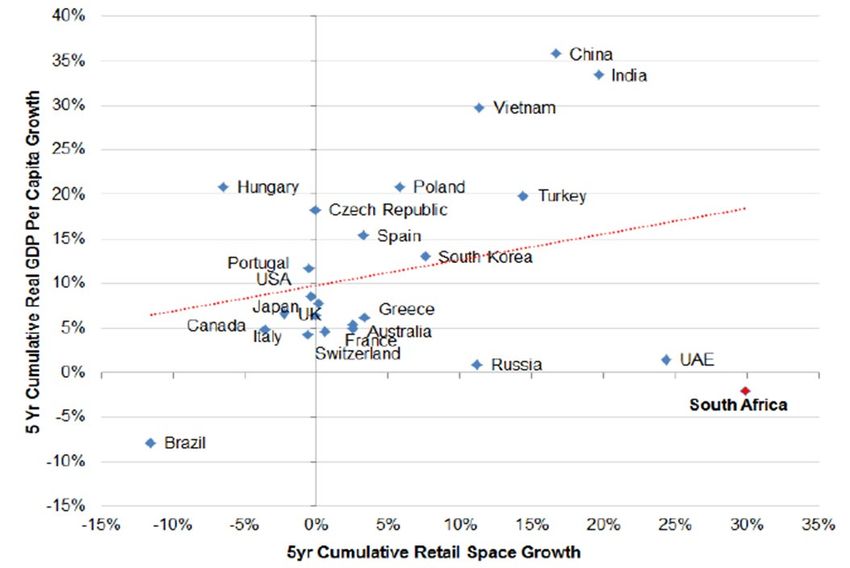
Presentation overview

‒ Covid is here for a while

‒ SA is broke

‒ US election risk

‒ Fund structure

                              4
Ninety One Managed Fund - Gail Daniel 14 July 2020
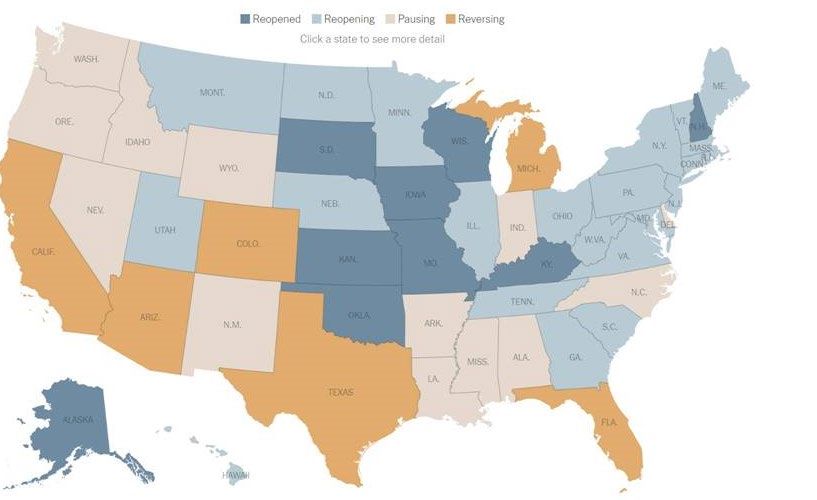
Covid
Some brief thoughts

As at 13 July 2020    5
Ninety One Managed Fund - Gail Daniel 14 July 2020
Covid is not going away

42% of USA is no longer reopening   Don't expect much stimulus to wind up in
                                    the economy

As at 3 July 2020                   Source: Jefferies Proprietary Survey, 10 July 2020   6
Ninety One Managed Fund - Gail Daniel 14 July 2020
-50

                                                     -150
                                                                                                    250

                                                            -100
                                                                                              200

                                                                         0
                                                                             50
                                                                                        150

                                                                                  100

                                              -200
                                    Jan-03

                                    Jul-03

                                    Jan-04

                                    Jul-04

Source: Bloomberg to 10 July 2020
                                    Jan-05

                                    Jul-05

                                    Jan-06

                                    Jul-06

                                    Jan-07
                                                                                                          US Economic Surprise Index

                                    Jul-07

                                    Jan-08

                                    Jul-08
                                                                                                                                       How many more positive surprises?
                                                                                                                                                                           US Economic surprise index

                                    Jan-09

                                    Jul-09

                                    Jan-10

                                     Jul-10

                                     Jan-11

                                     Jul-11

                                    Jan-12

                                     Jul-12

                                    Jan-13

                                     Jul-13

                                    Jan-14

                                     Jul-14

                                    Jan-15

                                     Jul-15

                                    Jan-16

                                     Jul-16

                                    Jan-17

                                     Jul-17

                                    Jan-18

                                     Jul-18

                                    Jan-19

                                     Jul-19

                                    Jan-20

                                    Jul-20
7
Ninety One Managed Fund - Gail Daniel 14 July 2020
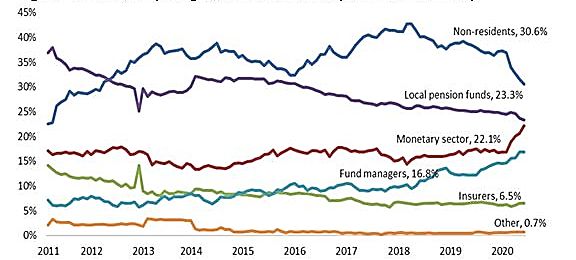
Is the quantum of stimulus announced sufficient?
US leads again

Summary of key stimulus measures (% of region’s GDP)

                                                                          Monetary     Fiscal
                13.0%
                                          17.2%

               40.5%
% of GDP

                                                   21.2%
                                          33.1%

                                                   15.2%
                                                           4.7% (total)
                                                                              3.2% (total)

                 US                     Eurozone   UK       Japan              China

Source: NinetyOne as at 31 March 2020
                                                                                                8
Ninety One Managed Fund - Gail Daniel 14 July 2020
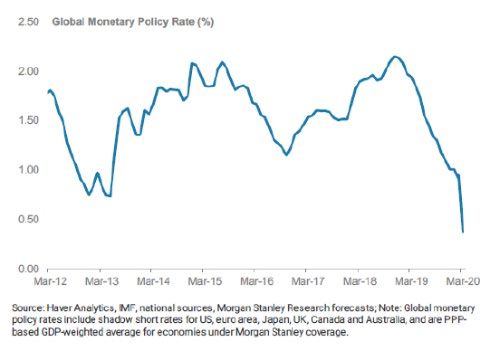
South Africa is broke
Policy credibility is needed to obtain financing

                                                   9
Ninety One Managed Fund - Gail Daniel 14 July 2020
South Africa was in ICU before COVID-19

GFC                                   COVID-19
Banking crisis                        Health crisis
Slow response                         Enormous response from DM
SA economy growing at 3.2%            SA GDP growing at 0%
Budget deficit -1%                    Budget deficit -6.8%
Debt to GDP 27.8%                     Debt to GDP 62.2%
Unemployment 23%                      Unemployment 29%
Population 49 million                 Population 60 million
Rand / Dollar R7.80                   Rand / Dollar R18.80
Inflation 10%                         Inflation 4%

                                      VWUL
                                                                  10
South Africa’s financial situation
Where does the money come from?

‒ R 2 billion a day

‒ R6.5 billion every Tuesday

‒ Pension Fund industry is R3.5 trillion

                                           11
Ownership of government bonds (SAGBs and ILBs)*

Source: Bloomberg, 8 July 2020; *National Treasury, ICIB   12
Key macroeconomic drivers
The decline in GDP will set us back to levels of the economy last seen in about 8 years ago (2012)

Real GDP level

3300000

 3100000

2900000

2700000

2500000

2300000

 2100000

 1900000

 1700000

 1500000

                                                                                                                                                                                                                                                        Jan-20

                                                                                                                                                                                                                                                                 Jan-21

                                                                                                                                                                                                                                                                          Jan-22

                                                                                                                                                                                                                                                                                   Jan-23

                                                                                                                                                                                                                                                                                            Jan-24

                                                                                                                                                                                                                                                                                                     Jan-25

                                                                                                                                                                                                                                                                                                              Jan-26

                                                                                                                                                                                                                                                                                                                       Jan-27
              Jan-94

                       Jan-95

                                Jan-96

                                         Jan-97

                                                  Jan-98

                                                           Jan-99

                                                                    Jan-00

                                                                             Jan-01

                                                                                      Jan-02

                                                                                               Jan-03

                                                                                                        Jan-04

                                                                                                                 Jan-05

                                                                                                                          Jan-06

                                                                                                                                   Jan-07

                                                                                                                                            Jan-08

                                                                                                                                                     Jan-09

                                                                                                                                                              Jan-10

                                                                                                                                                                       Jan-11

                                                                                                                                                                                Jan-12

                                                                                                                                                                                         Jan-13

                                                                                                                                                                                                  Jan-14

                                                                                                                                                                                                           Jan-15

                                                                                                                                                                                                                    Jan-16

                                                                                                                                                                                                                             Jan-17

                                                                                                                                                                                                                                      Jan-18

                                                                                                                                                                                                                                               Jan-19
  …At 3.5% real GDP growth and 1.0% thereafter, it will take us 7 years to get back. The changes is
  nominal GDP will not be as stark, nominal GDP will decline to roughly its 2018 level and be back to
  the 2019 level by the end of next year.
Source: Statistics SA, Ninety One, data as at June 2020                                                                                                                                                                                                                                                                         13
South African consumer confidence – it is not going well

   30

   20

    10

    0

  -10

  -20

  -30

  -40
     1982       1984     1986       1988   1990   1992   1994   1996   1998   2000   2002   2004   2006   2008   2010   2012   2014   2016   2018   2020

Source; Bloomberg to 30 June 2020                                                                                                                          14
SA bond yields
Where will the money come from?

SA bond yields
13.0
 12.5
12.0
  11.5
  11.0
10.5
10.0
  9.5
  9.0
  8.5
  8.0

                                                                       Jul-17

                                                                                                  Jul-18
         Jul-15

                                      Jul-16

                                                                                                                             Jul-19

                                                                                                                                               Mar-20

                                                                                                                                                        Jul-20
                                                           Mar-17

                                                                                         Mar-18
                           Mar-16

                                                                                                                    Mar-19
                                                                                Nov-17

                                                                                                           Nov-18
                  Nov-15

                                                 Nov-16

                                                                                                                                      Nov-19
Nominal Sovereign 10y Yield Less Reported Inflation*

Source: Bloomberg, 8 July 2020; *Bloomberg & Ninety One, 6 July 2020                                                                                             15
20

                                               5
                                                   10
                                                        15
                                     Jun-00
                                     Dec-00
                                     Jun-01
                                     Dec-01
                                                                  Rand / US$
                                     Jun-02
                                     Dec-02

Source: Bloomberg, 10jULY 20202020
                                     Jun-03
                                     Dec-03
                                     Jun-04
                                     Dec-04
                                     Jun-05
                                                                               Long term trend is very poor

                                     Dec-05
                                     Jun-06
                                     Dec-06
                                     Jun-07
                                     Dec-07
                                     Jun-08
                                                                                                              The rand – not a long term winner

                                     Dec-08
                                     Jun-09
                                     Dec-09
                                     Jun-10
                                     Dec-10
                                      Jun-11
                                      Dec-11
                                      Jun-12
                                     Dec-12
                                      Jun-13
                                     Dec-13
                                      Jun-14
                                     Dec-14
                                      Jun-15
                                     Dec-15
                                      Jun-16
                                     Dec-16
                                      Jun-17
                                     Dec-17
                                      Jun-18
                                     Dec-18
                                      Jun-19
                                     Dec-19
                                     Jun-20
16
Local is not lekker

Source: Investec Securities, 8 July 2020   17
The decline of SA Inc

                               Foschini
                                R15bn

                               Truworths
                                R14.5bn    Harmony
                                            R50bn
                               Massmart
                                R5bn

Source: Ninety One June 2020                         18
The collapse of SA Inc.

Foschini                                                           Nedbank
25000                                                              35000
                                                                   30000
20000
                                                                   25000
 15000                                                             20000
 10000                                                             15000
                                                                   10000
  5000
                                                                    5000
        0                                                               0
         2015            2016       2017    2018    2019    2020         2015    2016    2017    2018    2019    2020

Growthpoint                                                        Nampak
3500                                                               4000
3000                                                               3500
2500                                                               3000
                                                                   2500
2000
                                                                   2000
 1500
                                                                    1500
 1000                                                              1000
  500                                                                500
     0                                                                 0
      2015              2016       2017    2018    2019    2020         2015    2016    2017    2018    2019    2020

Source: Bloomberg to 7 July 2020                                                                                        19
The collapse of SA Inc.
ROE

Foschini                           Nedbank

Growthpoint                        Nampak

Source: Bloomberg to 7 July 2020             20
America election
Potential for a Democrat clean sweep

                                       21
US equities vs. rest of the world

                                              GLOBAL EQUITIES: US VS THE REST                                                                          FORECAST EPS: US Vs REST OF WORLD
                   240                                                                                 240                        325                                                                       325
                                                                                                                                         DATASTREAM INDICES FOR THE US.
                   220                                                                                 220                        300    US RECESSIONS SHADED.                                              300
INDEX JANUARY 2007=100

                   200                                                                                 200                        275                                                                       275

                                                                                                             EPS JAN (2007=100)
                                                                       S&P 500                                                    250                                                                       250
                   180                                                                                 180
                                                                                                                                  225                                                                       225
                   160                                                                                 160                                                                               US TMT
                                                                                                                                  200                                                                       200
                   140                                                                                 140
                                                                                                                                  175                                                                       175
                   120                                                                                 120                                                                         US EX-TMT
                                                                                                                                  150                                                                       150
                   100                                                                                 100                        125                                                                       125
                         80                                                                            80                         100                                                                       100
                         60                            MSCI ALL COUNTRY EX-US                          60                          75                                                                       75
                                                                                                                                                                          MSCI ALL COUNTRY EX-US
                         40                                                                            40                          50                                                                       50
                               07 08   09 10 11 12       13 14 15 16         17 18 19 20      21 22                                     07 08 09 10 11 12 13 14 15 16 17 18 19 20 21 22

                                       FORECAST SALES PER SHARE (INDEX TO JAN 2007)                                                                         FORECAST PROFIT MARGINS
                         240                                                                           240                        13                                                                         13
                                US$ EPS SERIES. MSCI INDICES.   † MXWDU INDEX. US RECESSIONS SHADED.                                    † MXWDU INDEX. MSCI INDICES. US RECESSIONS SHADED
                         220                                                                           220                        12                                                                         12
                         200                                                                           200                                                                     US (MSCI)
                                                                                                                                  11                                                                         11
                         180                                                                           180
INDEX 2007=100

                                                                                                             % OF SALES
                         160                                                                           160                        10                                                                         10
                                                       US (MSCI)
                         140                                                                           140                         9                                                                         9
                         120                                                                           120                         8                                                                         8
                         100                                                                           100
                                             MSCI ALL COUNTRY EX-US†                                                               7                                                                         7
                         80                                                                            80
                                                                                                                                                                     MSCI ALL COUNTRY EX-US†
                         60                                                                            60                          6                                                                         6

                         40                                                                            40                          5                                                                          5
                               07 08 09 10 11 12 13 14 15 16 17 18 19 20 21 22                                                     2004     2006    2008   2010    2012    2014   2016      2018   2020   2022

Sources: Minack Advisers; [1] MSCI, NBER [2] MSCI, DataStream, NBER [3] MSCI, IBES/DataStream, NBER [4] MSCI, IBES/DataStream, NBER                                                                               22
US equities: FAAANM Vs S&P494

                                            S&P500 MARKET VALUE, 2015=100                                                                            FORECAST EARNINGS, US$, 2015=100
                      375                                                                     375                              200                                                              200
                                                                                                                                      * FACEBOOK, APPLE, ALPHABET,
                            * FACEBOOK, APPLE, ALPHABET,
                                                                                                                                      AMAZON, NETFLIX & MICROSOFT.
                      350   AMAZON, NETFLIX & MICROSOFT.                                      350
                      325                                                                     325                              180                                                              180
INDEX, 1/1/2015=100

                      300                                                                     300

                                                                                                            INDEX 2015 = 100
                                                                                                                                                     FAAANM STOCKS*
                                                            FAAANM STOCKS*                                                     160                                                              160
                      275                                                                     275
                      250                                                                     250
                      225                                                                     225                              140                                                              140
                                                                                                                                                                       S&P500 EX FAAANM
                      200                                                                     200
                      175                                                                     175                              120                                                              120
                      150                                   S&P500 EX FAAANM                  150
                      125                                                                     125                              100                                                              100
                      100                                                                     100
                                                            MSCI AC EX-US                                                                                 MSCI ALL COUNTRY EX-UNITED STATES
                      75                                                                    75                                 80                                                               80
                       2015         2016       2017        2018    2019       2020      2021                                    2015          2016       2017        2018   2019    2020    2021

                                              FORECAST SALES, 2015=100                                                                                   S&P500 PROSPECTIVE PE
               220                                                                            220                          35                                                                    35
                            * FACEBOOK, APPLE, ALPHABET,                                                                             * FACEBOOK, APPLE, ALPHABET,
                            AMAZON, NETFLIX & MICROSOFT.                                                                             AMAZON, NETFLIX & MICROSOFT.
               200                                                                            200                                                                       FAAANM STOCKS*
                                               FAAANM STOCKS*                                                              30                                                                    30
INDEX 1-1-2015=100

                                                                                                            PROSPECTIVE PE
               180                                                                            180

                                                                                                                           25                                                                    25
               160                                                                            160

               140                                                                            140
                                                           MSCI ALL COUNTRY                                                20                                                                    20
                                                           EX-UNITED STATES                                                                                             S&P500 EX FAAANM
               120                                                                            120
                                                                                                                           15                                                                    15
               100                                                                            100
                                                             S&P500 EX FAAANM
                                                                                                                               MSCI ALL COUNTRY EX-UNITED STATES
                      80                                                                    80                             10                                                                     10
                       2015        2016       2017         2018    2019       2020      2021                                2015     2016     2017     2018    2019                  2020     2021

Sources: Minack Advisers; [1] MSCI, Bloomberg [2] MSCI, Bloomberg, IBES/DataStream [3] MSCI, Bloomberg, IBES/DataStream [4] MSCI, Bloomberg, IBES/DataStream                                           23
Growth and profits
China is pulling both fiscal and monetary policy levers to help recovery

Chinese nominal GDP and EPS growth                                                                Total debt / GDP to increase sharply in 2020

       80                                                                          30

       60                                                                          25

       40                                                                          20

                                                                                        4 QTR %
                                                         EPS* (LHS)
12M%

       20                                                                          15

        0                                                                          10

   -20                                                                             5
                                                           NOMINAL GDP†
   -40                                                                             0
            * MSCI TRAILING EPS INDEX. † LEADING BY 2 QTRS. US RECESSION SHADED.
   -60                                                     -5
     2002 2004 2006 2008 2010 2012 2014 2016 2018 2020 2022

Sources: Minack Advisers; DataStream/Worldscope , NBER                                                                                           24
Managed Fund
Ninety One Managed Fund
Active asset allocation

Asset class                                                                    30-Sep-19                          31-Dec-19               31-Mar-20   30-Jun-20   13-Jul-20
Total Equity                                                                     44.5                                57.3                    36.5        47.3        55.5
                                     SA Equity                                   23.3                                31.7                    13.4        21.6        24.0
                                     Foreign Equity                               21.2                               25.6                    23.1        25.7        31.5

Total Bonds                                                                          10.0                                8.4                 9.3        12.8        10.5
                                     SA Bonds                                         5.6                                5.6                 2.8        10.9         8.6
                                     Foreign Bonds                                    4.4                                2.8                 6.5         1.9         1.9

Total Cash                                                                           39.4                              28.2                 46.0        34.2        28.6
                                     SA Cash                                         32.0                              27.7                 40.7        27.5        27.6
                                     Foreign Cash                                     7.4                              0.5                   5.3         6.7         1.0

Total Property                                                                        0.6                               0.6                  0.5         0.0        0.0
                                     SA Property
                                     Foreign Property                                 0.6                                0.6                 0.5

Total Commodities                                                                     5.5                               5.5                  7.7         5.7         5.4
                                     Commodities                                      5.5                               5.5                  7.7         5.7         5.4

Total Offshore                                                                       33.6                              29.5                 35.4        34.3        34.4

This is not a buy or sell recommendation of any particular security. The portfolio may change significantly over a short space of time.
Source: Ninety One as at 13 July 2020
Note that there is a 2% (of fund) currency hedge in place (USD to ZAR). Therefore, non-ZAR currency exposure is 32.3%                                                         26
Ninety One Managed Fund
Positioning as at 13 July 2020

Top ten shares*                                                                                                       Asset allocation

As a % of fund
Naspers + Tencent                                                                           6.0                                            Financials
                                                                                                                                             6.0%
Newgold                                                                                     3.5

Walmart                                                                                     2.7

FirstRand                                                                                   2.5

Activision                                                                                  2.4                               Resources*
                                                                                                                                30.0%
Barrick Gold                                                                                2.2
                                                                                                                                                        Industrials
Glencore                                                                                    2.2
                                                                                                                                                          64.0%
South32                                                                                     2.2

Louis Vuitton                                                                               2.2

BHP                                                                                          1.8

This is not a buy or sell recommendation of any particular security. The portfolio may change significantly over a short space of time.
Source: Ninety One as at 31 July 2020. * Including ETFs                                                                                                               27
Sector positioning

Overweight                             Underweight
Technology                             Banks – local
Gold (took profits)                    Property
Online retailers                       Physical retailers
Pharmaceuticals                        Hospitals
Mining

Source: Ninety One as at 18 May 2020                        28
Resources have positive revisions
Follow the revisions

General Mining Index (RHS) relative to weighted average upside (downside) to consensus earnings if spot commodity prices prevail (LHS)

Source: Bloomberg, Thomson Reuters Datastream, Renaissance Capital estimates, 6 July 2020                                                29
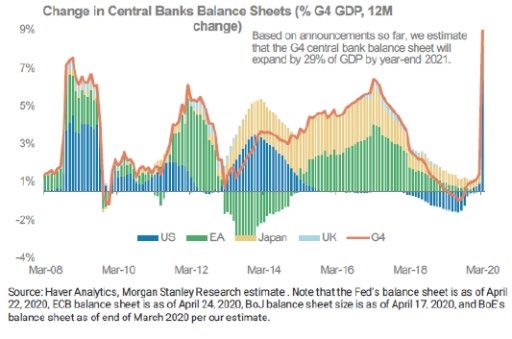
Gold prices buoyed by supportive financial conditions
… low interest rate environment

The global monetary policy rate is now well below   Current state of G4 central bank balance sheets
post-GFC lows

Source: RMB Morgan Stanley Research, July 2020                                                        30
Gold equities have delivered robust
returns and cash flow

The quality of gold companies continues to improve
                                                                                                                                                                Management are focused on:
                  12.0%                                                                                                      25.0%

                  10.0%
                                                                                                                             20.0%

                                                                                                                                                                   1
                  8.0%
                                                                                                                                                                                    Capital
                                                                                                                             15.0%
                  6.0%                                                                                                                                                              allocation

                                                                                                                                     Net Debt/Net Debt+Equity
                                                                                                                             10.0%
ROCE, FCF yield

                  4.0%

                  2.0%                                                                                                       5.0%

                  0.0%
                                                                                                                             0.0%
                                                                                                                                                                   2                Deleveraging

                  -2.0%
                                                                                                                             -5.0%
                  -4.0%

                  -6.0%

                  -8.0%
                                                                                                                             -10.0%

                                                                                                                             -15.0%
                                                                                                                                                                   3                Returning cash to
                                                                                                                                                                                    shareholders

                                ROCE                     FCF yield                   Net Debt/Net Debt+Equity

Source: Ninety One, 31 December 2019. *Simple average of Barrick, Newmont Goldcorp, Newcrest, Franco-Nevada, Buenaventura, Kirkland Lake Gold, Evolution Mining, Anglogold Ashanti, Wheaton Precious Metals.   31
The Banking Equation
Can they beat their cost of capital?

Key issue
‒ Are profits being permanently socialised?
‒ Banks
‒ Hospitals
‒ Telcos

Source: Ninety One research, Company reports, June 2020   32
FirstRand and Lloyds – one and the same thing?

8000                                                                                                                                                                                                                                                           70

7000                                                                                                                                                                                                                                                           65

                                                                                                                                                                                                                                                               60
6000

                                                                                                                                                                                                                                                               55
5000
                                                                                                                                                                                                                                                               50
4000
                                                                                                                                                                                                                                                               45
3000
                                                                                                                                                                                                                                                               40

2000
                                                                                                                                                                                                                                                               35

 1000                                                                                                                                                                                                                                                          30

     0                                                                                                                           Jan-20                                                                                                                        25

                                                                                                                                          Jan-20

                                                                                                                                                                                                                           Jun-20

                                                                                                                                                                                                                                    Jun-20

                                                                                                                                                                                                                                             Jun-20
         Jul-19

                  Jul-19

                                                                  Oct-19

                                                                           Oct-19

                                                                                                                                                                                                         May-20

                                                                                                                                                                                                                  May-20
                                                                                                                                                                     Mar-20

                                                                                                                                                                              Mar-20
                                                                                                      Dec-19

                                                                                                               Dec-19

                                                                                                                        Dec-19
                                             Sep-19

                                                         Sep-19

                                                                                                                                                                                       Apr-20

                                                                                                                                                                                                Apr-20

                                                                                                                                                                                                                                                      Jul-20
                           Aug-19

                                    Aug-19

                                                                                                                                                   Feb-20

                                                                                                                                                            Feb-20
                                                                                    Nov-19

                                                                                             Nov-19

                  FirstRand (LHS)                     Lloyds Bank (RHS)

Source: Bloomberg, 2 June 2020                                                                                                                                                                                                                                  33
The last decade in SA retail

Driver #1: Space growth*                                              Average LFL vol growth**

Sources :*Euromonitor, RMB; ** RMB Morgan Stanley, Company reports;                              34
Investment view
Ninety One Managed Fund

‒ Long offshore equity
‒ Underweight SA local equity
‒ Digital delivery
‒ Rand hedge

‒ Underweight SA Bonds
‒ Overweight gold and tech

                                35
Advantages of Ninety One Managed Fund

‒ Boutique fund with large institutional support
‒ Highly flexible
‒ Offshore fund is fully integrated and flexible
‒ PM’s incentive totally based on fund performance
‒ Only fund that PM runs
‒ Target liquidity

‒ Ninety One is a globally integrated business

Watch, Understand, Adapt

                                                     36
Thank you
Biographies

                            Gail Daniel
                            Portfolio Manager
                            Joined the firm in 1991
                            Joined the industry in 1991

Gail is a portfolio manager at Ninety One with responsibility for the
Managed Fund. She joined the firm in 1991, where she worked on the
trading desk and contributed her analytical skills to the investment team.
One year later, Gail joined the investment team and moved wholly into
investments where she took responsibility for a selection of institutional
portfolios and later, the Managed Fund. She managed the Worldwide
Fund from its inception in 1995 until October 2000, when she was
promoted to head of equities in South Africa. Gail served in this role until
2007, at which stage she focused on portfolio management and the
development of the Equity Fund and the Equity Hedge Fund, which she
managed successfully until October 2009.

Gail graduated from the University of the Witwatersrand in 1990 with a
Bachelor of Arts degree in Mathematics, Economics and Psychology, and
gained her Honours in Economics from the University of South Africa in
1991. She also holds an MBA degree from the University of Cape Town
Graduate School of Business.

For further information on investment team, please see the Important Information section.   38
Important information

All information and opinions provided are of a general nature and are not intended to address the circumstances of any particular individual or entity. We are not acting and do not
purport to act in any way as an advisor or in a fiduciary capacity. No one should act upon such information or opinion without appropriate professional advice after a thorough
examination of a particular situation. This is not a recommendation to buy, sell or hold any particular security.
Collective investment scheme funds are generally medium to long term investments and the manager, Ninety One Fund Managers SA (RF) (Pty) Ltd, gives no guarantee with respect
to the capital or the return of the fund. Past performance is not necessarily a guide to future performance. The value of participatory interests (units) may go down as well as up.
Funds are traded at ruling prices and can engage in borrowing and scrip lending. The fund may borrow up to 10% of its market value to bridge insufficient liquidity. A schedule of
charges, fees and advisor fees is available on request from the manager which is registered under the Collective Investment Schemes Control Act. Additional advisor fees may be
paid and if so, are subject to the relevant FAIS disclosure requirements. Performance shown is that of the fund and individual investor performance may differ as a result of initial fees,
actual investment date, date of any subsequent reinvestment and any dividend withholding tax. There are different fee classes of units on the fund and the information presented is
for the most expensive class. Fluctuations or movements in exchange rates may cause the value of underlying international investments to go up or down. Where the fund invests in
the units of foreign collective investment schemes, these may levy additional charges which are included in the relevant TER. Additional information on the funds may be obtained,
free of charge, at www.ninetyone.com. Ninety One SA (Pty) Ltd (“Ninety One SA”) is an authorised financial services provider and a member of the Association for Savings and
Investment SA (ASISA).
Investment Team: There is no assurance that the persons referenced herein will continue to be involved with investing for this Fund, or that other persons not identified herein will
become involved with investing assets for the Manager or assets of the Fund at any time without notice.
Investment Process: Any description or information regarding investment process or strategies is provided for illustrative purposes only, may not be fully indicative of any present or
future investments and may be changed at the discretion of the manager without notice. References to specific investments, strategies or investment vehicles are for illustrative
purposes only and should not be relied upon as a recommendation to purchase or sell such investments or to engage in any particular strategy. Portfolio data is expected to change
and there is no assurance that the actual portfolio will remain as described herein. There is no assurance that the investments presented will be available in the future at the levels
presented, with the same characteristics or be available at all. Past performance is no guarantee of future results and has no bearing upon the ability of Manager to construct the
illustrative portfolio and implement its investment strategy or investment objective.
In the event that specific funds are mentioned please refer to the relevant minimum disclosure document in order to obtain all the necessary information in regard to that fund.
This presentation is the copyright of Ninety One SA and its contents may not be re-used without Ninety One SA’s prior permission.

                                                                                                                                                                                         39
You can also read