HTA Market Update - Horticultural Trades Association
←
→
Page content transcription
If your browser does not render page correctly, please read the page content below

HTA Market Update
MAY 2021
Contents
3. Overview: the story this month
4. Garden centre sales: April
5. Garden centre sales: calendar year to end 12.   Progress with vaccine rollout
   of April
                                             13.   Consumer issues tracker
6. Garden centre sales: detailed April
   breakdown                                 14.   The UK Economy
7. Garden centre sales: April Average        15.   Unemployment
   Transaction Values                        16.   Vehicle fuel prices – petrol & diesel
8. Consumer confidence: financial            17. Water – river flows
9. Consumer confidence visiting garden       18. Water – groundwater levels
   centres, cafes and restaurants
                                             19. Weather
10. Consumer confidence visiting garden
    centres, cafes and restaurants by age    20. Closing comments
11. Consumer confidence visiting garden
    centres, cafes and restaurants (2)

                                                                                           2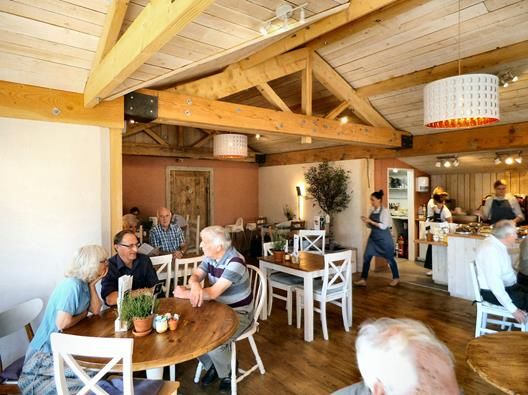
Overview: the story this month
       Nationally, overall garden centre sales were up 43% in April on April 2019, despite the coldest April
       temperatures since 1989!
       With 225 sunshine hours, April 2021 was the sunniest April since records began and garden centre sales of
       garden/gardening categories were 64% up for April 2021 vs April 2019. Calendar year to end of April
       comparisons show garden/gardening sales as 78% up in 2021 from 2019
       Consumer interest in improving garden spaces for socialising and entertaining as restrictions allowed
       drove strong sales of garden furniture, BBQ’s and heating, which contributed to a 60% uplift in Average
       Transaction Values in April 2021 vs April 2019
       Though with out-of-home leisure and travel re-opening in the next stages of the government’s roadmap,
       we may see an impact on consumer spending in the coming months. A sneak preview of May sales
       however reveals sales are still strong following Step 2 of the roadmap out of lockdown from 12th April,
       with overall sales for the period 12th April – 12th May 2021 up 22% vs the same period in 2019 and
       garden/gardening sales up 34%.
       Consumer confidence has continued to improve with the success of the national vaccination programme
       continuing, with ratings of personal finances 24 index points higher than April of last year. Though any
       concerns over the new variant of COVID-19 are yet to be reflected in the figures.
       Confidence to visit garden centres and their cafes and restaurants is the highest since HTA tracking
       began, with 80% and 67% of British adults stating they would feel confident visiting garden centres and
       garden centre cafes/restaurants respectively. Importantly, now only 7% of people state they would not
       feel confident to visit garden centres; whilst 12% would not feel confident visiting the café/restaurant as
       we enter the next stage of the lockdown-exit roadmap allowing indoor hospitality
       The unemployment rate has stabilised at 4.9%, though the impacts of the unwinding of the furlough
       scheme in the coming months and promise of restrictions lifting boosting the economy are yet to be felt
       Tracking of consumer concerns has revealed focus has shifted away from the virus itself and onto the
       impacts it has left on education, the NHS, the economy and poverty/inequality

HTA Market Update May 2021 > APRIL EDITION OVERVIEW
                                                                                                                     3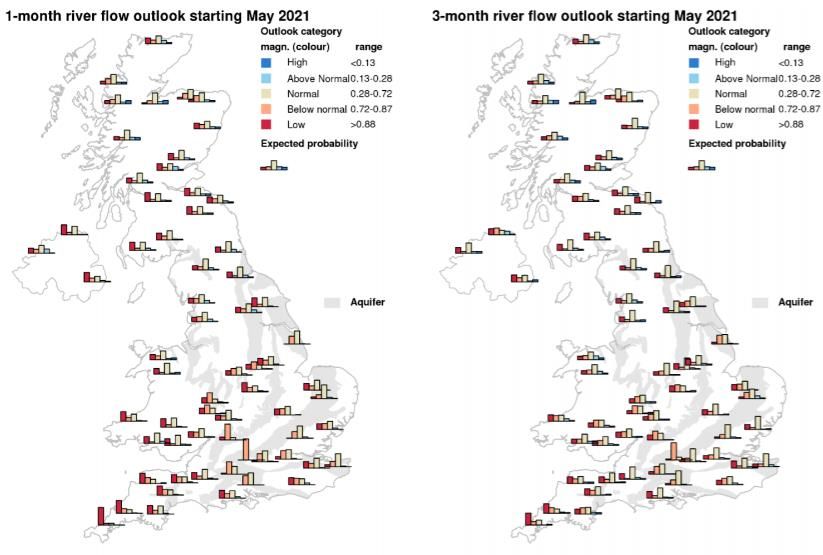
Garden centre sales: April
  Nationally, garden centre sales in April saw 43% growth on April 2019 overall. Within this, sales of garden/gardening
  categories were up 64% and non-garden/gardening categories were down 26% with the restrictions on catering having
  downward pressure on the figures. April 2020 saw garden centres closed during the first national lockdown, and so
  2020 comparisons reflect the limited trading that was able to take place online or via click and collect.

                                  Overall
                                                                                        How are these figures calculated?
                                                  Garden / Non-garden /
                                                 gardening gardening                    The national sales figures we report each month
                                                                                        come from the HTA Garden Retail Monitor (GRM)
                                                                                        system. We’ve now moved over to a newer GRM
April 2021 vs April 2020
*note garden centres were
                                  1265%             1164%           1758%               system where sales data from submitting garden
                                                                                        centres is automatically uploaded to a secure
closed in April 2020 during the                                                         server via the EPOS system. These garden centres
first COVID national lockdown
                                                                                        can then login to the portal to benchmark their
                                                                                        sales against regional and national averages for a
                                                                                        variety of sales metrics. We’re looking to sign up
                                                                                        more garden centres to the system, allowing us to
                                                                                        include more reliable detailed breakdowns of
                                                                                        trends in sales in these Market Update reports.
April 2021 vs April 2019
                                  43%                 64%              26%              If you’re interested or for more information visit:
                                                                                        hta.org.uk/grm

                                                            *note non-garden/gardening
                                                            includes catering which has faced
                                                            restrictions across the UK
                                                                                                                Source: HTA Garden Retail Monitor

HTA Market Update May 2021 > GARDEN CENTRE SALES: APRIL                                                                                4
Garden centre sales: calendar year to
end of April
Year to end of April comparisons of garden centre sales nationally show 2021 as 117% up on 2020, and 31% up on 2019.
Again garden/gardening categories are driving the bulk of this growth recording sales 230% up from 2020 and 78% on
2019 for the first 4 calendar months. Non-garden/gardening sales which include catering finished 2% down on 1 st Jan-
end of April 2020, and 32% down on the same period in 2019.
Overall
How are these figures calculated?
Garden / Non-garden /
gardening gardening The national sales figures we report each month
come from the HTA Garden Retail Monitor (GRM)
system. We’ve now moved over to a newer GRM
Calendar year to end of 2% system where sales data from submitting garden
April 2021 vs 2020 117% 230%
centres is automatically uploaded to a secure
*note all garden centres were server via the EPOS system. These garden centres
closed from 23rd March during can then login to the portal to benchmark their
the first COVID national sales against regional and national averages for a
lockdown
variety of sales metrics. We’re looking to sign up
more garden centres to the system, allowing us to
include more reliable detailed breakdowns of
trends in sales in these Market Update reports.
Calendar year to end of 32%
April 2021 vs 2019 31% 78% If you’re interested or for more information visit:
hta.org.uk/grm
*note non-garden/gardening
includes catering which has
faced restrictions across the UK
Source: HTA Garden Retail Monitor
HTA Market Update May 2021 > GARDEN CENTRE SALES: APRIL 5Category April 2021 vs 2019
Garden centre Bedding plants +34%
sales: detailed Hardy plants, shrubs & trees +78%
April breakdown Houseplants
Seeds
+62%
+40%
April 2019 comparisons highlight strength in demand for
plants, seeds and bulbs and tools and equipment this Bulbs +81%
year; as well as features to improve the outdoor
entertaining space such as BBQs and heating (+175%) Plant care products +42%
and garden furniture (+84%) as restrictions ease further
to allow up to 30 people to socialise outdoors from 17th Garden tools & equipment +79%
May.
Garden furniture +84%
Wild bird care has also experienced significant growth BBQs & heating +175%
(+47%) as connecting with nature has become widely
linked with improved mental health during the ongoing Garden features & structures +68%
pandemic.
Outdoor containers +98%
Catering remained completely closed until 12 th April
before restrictions eased to allow outdoor hospitality or
Wild bird care +47%
indoor hospitality with curfew and alcohol restrictions in Indoor living & homewares +42%
the devolved nations. As such, national garden centre
catering sales finished April 93% down on April 2019. Gifting +19%
A sneak preview of May data reveals sales are still strong Pets +17%
following Step 2 of the roadmap out of lockdown from
12th April, with overall sales for the period 12th April – Food & farm shop +43%
12th May 2021 up 22% vs the same period in 2019 and
Catering -93%
garden/gardening sales up 34%.
Source: HTA Garden Retail Monitor
HTA Market Update May 2021 > GARDEN CENTRE SALES APRIL BREAKDOWN 6Garden centre sales: April Average
Transaction Values (ATVs)
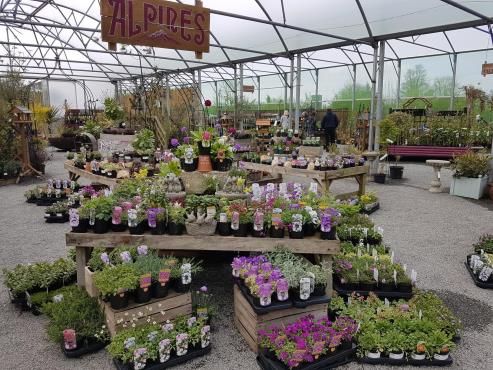
With demand for plants and gardening products high and consumer desire to improve the outdoor entertaining
space, April’s national Average Transaction Value was £36.99, up 60% compared with April 2019. Despite heavy
restrictions across much of the UK for most of April, the average catering transaction was up 19% from April 2019
to £10.21.
Garden store Catering
36.99 (EXC. VAT) 10.21 (EXC. VAT)
APR 2021 APR 2021
Vs APR 2019 VS APR 2019
+60% +19%
(£23.12) (£8.59)
Source: HTA Garden Retail Monitor
HTA Market Update May 2021 > GARDEN CENTRE SALES ATV 7Consumer confidence: financial
The overall consumer confidence score edged up 1 point in April to -15, the highest the confidence score has been
since before the first national lockdown in March 2020. Consumer ratings of their personal finances and the general
economic situation over the next 12 months have shown drastic improvement month on month since January and
remain strong, contributing to a 40 point increase in the Major Purchase Index over the last year - a key indicator of
spending intent. Though notably the Savings Index also sits 17 points above April 2020, indicating consumers think Click to view the
now is a good time to be saving money. With the pandemic hitting household finances hard, concern over debt, rising full summary
inflation and future COVID variants overhang.
10
Overall
0 index
Jul-13
Jul-14
Jul-15
Jul-16
Jul-17
Jul-18
Jul-20
Jan-13
Jan-14
Jan-15
Jan-16
Jan-17
Jan-18
Jan-19
Mar-19
May-19
Jul-19
Jan-20
Jan-21
Mar-13
May-13
Mar-14
May-14
Mar-15
May-15
Mar-16
May-16
Mar-17
May-17
Mar-18
May-18
Mar-20
May-20
Mar-21
Nov-13
Nov-14
Nov-15
Nov-16
Nov-17
Nov-18
Nov-19
Nov-20
Sep-13
Sep-14
Sep-15
Sep-16
Sep-17
Sep-18
Sep-19
Sep-20
score:
*
-10
-20 -15
Overall consumer confidence index score (see purple line for trendline)
-30 *this is 19 points higher
than April 2020
Measure Relative score vs. April 2020
-40 Consumers are asked how the financial position of
their household has changed over the last year and
Personal financial situation: is expected to change in the next year, as well as
during last 12 months -3 1 point higher that of the general economy. They’re also asked if
over next 12 months 10 24 points higher they believe ‘now’ is a good time to make major
General economic situation: purchases or to be saving money. The first three
during last 12 months -58 14 points lower measures in the table make up the overall index
over next 12 months -11 45 points higher score. Whilst the Savings Index indicates whether
consumers are looking to save rather than spend
Major Purchase Index -12 40 points higher their money. Relative scores are given as a
comparative to when records began in 1974.
Savings Index 22 17 points higher
Source: GfK
HTA Market Update May 2021 > CONSUMER CONFIDENCE: FINANCIAL 8Consumer confidence visiting garden
centres and garden centre cafes
June 2020, we have been tracking consumer confidence in visiting both garden centres and garden centre cafes, set in the
context of COVID-secure measures being in place. The results from the most recent wave (see graph below) show that 80%
of British adults now feel confident visiting garden centres. This is the highest the figure has been since tracking began.
Confidence drops to 67% when considering visiting a garden centre café or restaurant, but is still the highest figure
recorded to date and sits in the context of indoor hospitality being closed to consumers for some time.
Assuming appropriate health and safety measures and social distancing
procedures were in place… How confident would you feel about visiting…
(% who are ‘confident’ or ‘extremely confident’)
100%
Garden centres Garden centre cafes/restaurants
90% 80%
80% 72% 75% 72% 72% 71% 75%
69% 67%
70% 63%
57% 53% 54% 54% 53% 57%
60% 51%
50% 45%
40% 34%
30%
20%
10%
0%
Bases: c. 2,000 British adults aged 16+. Source: YouGov for HTA
HTA Market Update May 2021 > CONSUMER CONFIDENCE: VISITING GARDEN CENTRES 9Consumer confidence visiting garden
centres split by region
Confidence visiting garden centres and garden centre cafes and restaurants remains consistently high across the
devolved nations. However, confidence to visit both garden centres (87%) and garden centre cafes/restaurants
(71%) is highest in Wales compared to the other countries of the UK.
Assuming appropriate health and safety measures and social distancing
procedures were in place… How confident would you feel about visiting…
(% who are ‘confident’ or ‘extremely confident’)
Garden centres Garden centre cafes/restaurants
100%
87% 83%
90% 79% 80%
80% 69% 71%
70% 66% 66%
60%
50%
40%
30%
20%
10%
0% * small sample
England (n=1833) Scotland (n=183) Wales (n=104) Northern Ireland size, results
should be treated
(n=59)* as indicative
Bases: c. 2,000 British adults aged 16+. Source: YouGov for HTA
HTA Market Update May 2021 > CONSUMER CONFIDENCE: SPLIT BY NATION
10Consumer confidence visiting garden
centres and garden centre cafes
Importantly, the proportion of people stating they would not feel confident visiting a garden centre or garden centre
cafe/restaurant has continued to decline following the post-Christmas lockdown and third waves of the virus. As of May
3rd, 7% of British adults said they wouldn’t feel confident to visit a garden centre, and 12% said they wouldn’t feel
confident visiting a garden centre cafe/restaurant. (Note: these questions are asked in the context of assuming
appropriate health and safety measures and social distancing procedures were in place).
% feeling confident or not confident to visit % feeling confident or not confident to visit
garden centres over time garden centre cafes/restaurants over time
Net: Not Confident Net: Not Confident
100%
Net: Confident Net: Confident
90% 80%
80% 72% 75% 72% 72% 71% 69% 75% 67%
70% 63% 57% 53% 54% 54% 53% 57%
51%
60% 45%
40%
50% 34%
29%
40% 22% 19% 24% 21% 23% 24% 19%
30% 12%
20% 10% 10% 13% 12% 13% 13% 16% 9%
7%
10%
0%
Bases: c. 2,000 British adults aged 16+. Source: YouGov for HTA
HTA Market Update May 2021 > CONSUMER CONFIDENCE: VISITING GARDEN CENTRES 11Progress with vaccine rollout
As of 9th May, 35.5million people in the UK had received a first dose vaccine, and 17.9million second doses had also
been given. The UK is on track to have offered vaccinations to all UK adults by the end of July 2021 and the success
of the vaccination rollout is no doubt helping to boost consumer confidence as the UK and the economy continue
to unlock at each stage of the government’s roadmap.
First and second vaccination doses given in the UK (1st January to 9th May 2021)
40000000 40000000
First doses Second doses
35000000 35000000
30000000 30000000
25000000 25000000
20000000 20000000
15000000 15000000
10000000 10000000
5000000 5000000
0 0
10/01/2021 10/02/2021 10/03/2021 10/04/2021
Source: GOV.UK
HTA Market Update May 2021 > PROGRESS WITH VACCINE ROLLOUT
12Consumer issues tracker
The graph below shows three month trendlines exploring the issues consumers rate as most important. Throughout 2019,
the NHS and EU dominated concerns amongst British adults. In April 2020, these issues were understandably replaced with
worries surrounding the pandemic as priorities shifted. However, in March 2021 the percentage of British adults mentioning
the pandemic as a top concern fell by 23% down to 49%. Concern about Brexit also fell again, with one quarter now
mentioning it as a worry (26%). Meanwhile, as we’re emerging out of lockdowns and the pandemic is more under control,
consumer focus seems to have shifted to the damage the pandemic has done to the NHS, the economy, education, jobs and
poverty – all of which experienced increases.
90
80
70
60
50
40
30
20
10
0
Pandemic disease EU/Brexit Economy
NHS/healthcare Unemployment Poverty/Inequality
Environment/climate change Education/schools Immigration/immigrants
Ipsos MORI's Issues Index is conducted monthly and provides an overview of the key issues concerning the country. Ipsos MORI interview a representative sample
of 1,004 adults aged 18+ across Great Britain. The participants are not prompted with any answers. Data are weighted to match the profile of the population.
HTA Market Update May 2021 > CONSUMER ISSUES TRACKER 13The UK economy
5.0%
4.5%
4.0%
3.5%
3.0%
2.5%
2.0% CPIH
1.5%
inflation:
1.0%
1.0%
0.5%
0.0%
2011 JAN
2011 JUL
2012 JUL
2013 JUL
2014 JUL
2015 JUL
2016 JUL
2017 JUL
2018 JUL
2019 JUL
2020 JUL
2014 OCT
2011 OCT
2012 OCT
2013 OCT
2015 OCT
2016 OCT
2017 OCT
2018 OCT
2019 OCT
2020 OCT
2012 JAN
2013 JAN
2014 JAN
2015 JAN
2016 JAN
2017 JAN
2018 JAN
2019 JAN
2020 JAN
2021 JAN
2011 APR
2012 APR
2013 APR
2014 APR
2015 APR
2016 APR
2017 APR
2018 APR
2019 APR
2020 APR
The Consumer Prices Index including owner occupiers’ housing costs (CPIH) 12-
A leading measure of inflation, the consumer
month inflation rate rose to 1.0% in March 2021, from 0.7% in February. The largest
prices index is the rate at which the prices of
upward contribution to this increase came from transport (0.44%), where fuel prices
goods and services bought by households rise
experience the biggest increase since January 2020. Rising prices for motor fuels and
and fall; it is estimated using consumer price
clothing were partially offset by falling prices of food.
indices. Although otherwise identical to CPI, it
represents a more comprehensive measure as
The rate of CPIH inflation has remained fairly stable over the last 12 months and
it includes costs associated with owning,
together with improving consumer confidence in personal finances indicates a
maintaining and living in one’s own home,
positive picture for household spending. However, with the repercussions of
along with Council Tax. This index is based on
government borrowing to provide COVID-support yet to be felt, prices could
a representative sample of 700 goods and
experience a surge in the months ahead.
services, reviewed annually.
Source: ONS
HTA Market Update May 2021 > THE UK ECONOMY 14Unemployment
The latest figures suggest that the jobs market has been broadly stable in recent months, with the unemployment rate
now at 4.9%. After several months of increases, there was a small decrease in payrolled employee numbers in March
2021. Over the last year, the largest falls of payrolled employment have been in the hospitality sector, amongst under
25’s and amongst those living in London. The number of job vacancies in January to March 2021 fell by nearly 23% to
an estimated 607,000, compared with the same period of 2020; with arts, entertainment and recreation, and
accommodation and food service activities the worst affected. The total number of weekly hours worked was also
down by 92.3 million hours comparing the same time periods to 959.9 million. As the amount of government support
through the furlough scheme unwinds, but the UK economy promises to unlock through the easing of restrictions; the
effects of the coming months are yet to be observed.
8.0%
7.0%
6.0%
5.0%
% unemployed
4.0%
3.0%
2.0%
1.0%
0.0%
Unemployment data (aged 16 and over, seasonally adjusted). Source: ONS
HTA Market Update May 2021 > UNEMPLOYMENT 15Vehicle fuel prices
Pence per litre (ppl)
160
150 Unleaded petrol in PPL
Diesel in PPL
140
130
120
Click to view the full
110 summary report and
regional breakdowns
100
90
Jul-10
Jul-11
Jul-12
Jul-13
Jul-14
Jul-15
Jul-16
Jul-17
Jul-18
Jul-19
Jul-20
Jan-10
Jan-11
Jan-12
Jan-13
Jan-14
Jan-15
Jan-16
Jan-17
Jan-18
Jan-19
Jan-20
Jan-21
Mar-10
May-10
Mar-11
May-11
Mar-12
May-12
Mar-13
May-13
Mar-14
May-14
Mar-15
May-15
Mar-16
May-16
Mar-17
May-17
Mar-18
May-18
Mar-19
May-19
Mar-20
May-20
Mar-21
Nov-18
Nov-10
Sep-11
Nov-11
Nov-12
Nov-13
Sep-14
Nov-14
Nov-15
Nov-16
Nov-17
Nov-19
Nov-20
Sep-10
Sep-12
Sep-13
Sep-15
Sep-16
Sep-17
Sep-18
Sep-19
Sep-20
We also monitor vehicle fuel prices to gauge the situation for consumers and
businesses alike. Figures reported are national averages, measured in price per
litre. For regional breakdowns click or tap here to view the AA’s fuel reports.
Petrol Diesel
Despite remaining relatively stable throughout much of the summer and
(ppl): autumn, since November fuel prices have shown a sharp increase, which has (ppl):
126 continued into April 2021. Fuel outgoings for businesses throughout the supply
chain are likely to be affected should prices continue to rise, an important
consideration for those now offering new in-house operated delivery services as
129
a result of the pandemic. High fuel prices may also put a pinch on consumer’s
pockets as out-of-home travel and leisure begins to reopen.
Source: AA
HTA Market Update May 2021 > VEHICLE FUEL PRICES 16Water – River flows
The charts show the expected probabilities of above or below average river flow levels in the coming months.
Essentially, the more yellow, orange or red that appears in a chart, the greater the probability of below normal levels in
the area and an increased probability of water shortages. The HTA will continue to monitor and update you on the
water situation via the website hta.org.uk.
The full reports contain a
much more
comprehensive picture
of the forecast water
situation, including
rainfall required to
overcome below normal
conditions.
For the full
reports
click here
Following an exceptionally dry April, river flows in south-west England are likely to be below normal to low over the next three months.
Flows across Scotland, central and northern England and Wales were predicted to be normal to below normal for May, however rivers
are already responding to heavy early May rainfall, such that normal to above normal flows are now likely. In south-eastern England,
flows are likely to be within the normal range for the next three months. Source: Centre for Ecology and Hydrology
HTA Market Update May 2021 > WATER 17Water – Groundwater levels
The charts show the expected probabilities of above or below average groundwater levels in the coming months.
Essentially, the more yellow, orange or red that appears in a chart, the greater the probability of below normal levels in
the area and an increased probability of water shortages. The HTA will continue to monitor and update you on the
water situation via the website hta.org.uk.
1 month outlook 3 month outlook The full reports contain a
much more
comprehensive picture
of the forecast water
situation, including
rainfall required to
overcome below normal
conditions.
For the full
reports
click here
The outlook is consistent across both the 1-month and 3-month forecast, with normal to exceptionally low groundwater levels
predicted across the majority of sites in southern England and Wales.
Source: Centre for Ecology and Hydrology
HTA Market Update May 2021 > WATER 18Weather
April was the sunniest April since records began, with 225 hours of sunshine! But it was also the coldest April
since 1989 averaging 5.7⁰C, and brought the fewest rain days in a month of April since April 2007.
Apr Apr Apr Apr
The figures reported are
2021 2020 2021 2020 national averages for
the UK. To view the
figures on a regional
225 224 20 29 basis: click or tap here
Hours of to visit the MET Office
sunshine Rainfall (mm)
website and view the
year ordered stats by
month.
Apr Apr Apr Apr
2021 2020 2021 2020
5 6 5.7 9.1
Mean temperature
No. of rain days
(Celsius)
Source: MET Office
HTA Market Update May 2021 > WEATHER 19Closing comments
We hope you enjoyed the format and content of
this Market Update.
If you have any questions or would like to see
something else included, please don’t hesitate to
contact marketinfo@hta.org.uk
20You can also read