Available online www.jsaer.com Journal of Scientific and Engineering Research, 2020, 7(4):245-253 - Journal of ...
←
→
Page content transcription
If your browser does not render page correctly, please read the page content below
Available online www.jsaer.com

            Journal of Scientific and Engineering Research, 2020, 7(4):245-253

                                                                                           ISSN: 2394-2630
                                                     Research Article                    CODEN(USA): JSERBR

Comprehensive Measurement and Optimization of the Coordinated
Development of Ecological Environment and Land Use

Yidi Sun, Yiqi Tian, Jian Shen, Wenbo Liu

School of Mathematics, Physics and Statistics, Shanghai University of Engineering Science, Shanghai 201620,
China
Abstract With the massive use of land, there seems to be an inevitable contradiction between ecosystems
service (ES) and land development and utilization. To tackle this problem, we do case studies and empirical
analysis on evaluation and prediction of ecosystem service value (ESV) and benefit-cost ratio (BCR) of land
use. First, we build a Pressure-State-Response (PSR) framework for the coordinated development of the
ecological environment and land use. The framework indexes are composed of the pressures of environmental
degradation, the state of land use, and the response of the coordinated development. Then, we construct an ESV
comprehensive evaluation indicator system by means of Costanza model. And we establish comprehensive
measurement model of environmental cost based on the system. Next, we develop an improved model of BCR
of land use. Under different scenarios in varying-size regions, the model takes into account the loss and increase
of ESV due to land use. Finally, by using the models, we do case studies on urban construction land use of
Shanghai and the project of the Three Gorges Dam in China. The results show that the models are not only
suitable for national large-scale land projects, but also for the small-scale ones. Our work may help to optimize
the allocation of land resources based on ESV, and promote the understanding of ecological balance and
sustainable development.

Keywords Land use development, Ecosystem service, ESV, PSR
1. Introduction
1.1 Statement of the problem
People always ignore the impact of economic development on the ecosystem when we develop the economy
vigorously. When we talked about the environment degradation, amount of studies can be mentioned that this
catastrophic phenomenon has a tremendous impact on every aspect of society, including economic, culture, and
other things.
In the recent years, with the development of productivity, the improvement of production level, the progress of
technological and population growth, people used to think environment degradation is a transient problem.
As we all known, human activities play an important role among the factors contributing to environment
degradation. As we said, the destruction of the ecosystem is bound to cause the degradation of the environment.
By and large, we hold the view that there is no limit to the resources and capacity of the ecosystem, this leads to
the ecosystem is carrying far more than it can handle. In some cases, this will be the last straw that can
overwhelmed the camel.

     Journal of Scientific and Engineering Research

                                                                                                               245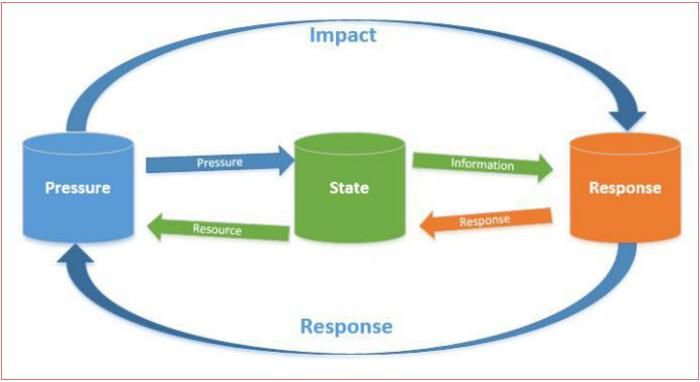
Sun Y et al Journal of Scientific and Engineering Research, 2020, 7(4):245-253
Figure 1: PSR Model [7]
1.2. PSR framework of ecological system and land use
Currently, the PSR [7] structural model is a normal model for assessing resources use, sustainable development,
and ecosystems. Here, 'P' represents the pressure dimension, it represents the pressure on the system, and here
we assume that environmental degradation is “pressure”. In addition, “S” represents the state of the different
types of land when investing in land, including before environmental degradation or after environmental
degradation. “R” acts as a response to characterize the recommendations and responses to promote sustainable
development processes. Based on the PSR model, we have established a similar ecological environment – the
PSR framework for coordinated development of land use.
1.3. Our work
In fact, to the Earth, the only planet which are suitable for human survival, the services of ecological system and
the original stock that produce them are critical to the functioning of the Earth’s life support system. They have
a direct contribution to the development of our society, thus indirectly represents a part of the Earth’s economic
value. According to the published research, we estimated the current economic value of 17 ecosystem in 21
biomes [1].
The value of the whole biosphere, not included in the market, is estimated to be $16-54 trillion per year.
Because of the nature of the uncertainties, for instance, due to the deepening of research by biologists and other
researchers, so that the value of the biosphere increased continuously. It means that the data just mentioned
should be considered a minimum estimate [1].
In order to better match economic development and ecological, here is the economic development of land, we
are required to establish an evaluation index model which determines a land assessment model. By selecting the
appropriate age to determine the land to obtain the evaluation indicators of the land, give the indicator weights,
and combine the different kinds of indicators to achieve some comprehensive indicators, from community small
service projects to large-scale national construction projects, through the specific practical projects, testing this
model and it is application, and making recommendation for improvement suggestion.
In order to solve these problems, we will proceed as follows:
Do imaginary and make a mark. Neglecting some insignificant impacts will narrow the scope of the
data and simplify our calculations. Then we will list some symbols to clarify the model and determine
their definition is very important.
Establish an evaluation index model which reflects both the ecosystem service system and land
benefits. We will use the entropy weight method to explain this model by screening for factors that are
more relevant to the benefit, such as high and low benefits.
Apply our model to a practice project. Here, we apply our model to China’s large national project, The
Three Gorges Dam and a small community public service project, and a small community public
service project, and study their actual influencing factors. Then we will verify the correctness of the
model through the test results of the model to better improve it.
Journal of Scientific and Engineering Research
246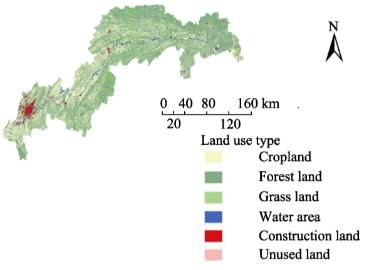
Sun Y et al Journal of Scientific and Engineering Research, 2020, 7(4):245-253
Sensitivity analysis and model evaluation. Based on the evaluation criteria defined above, we predicted
from the results of our model, we evaluated the reliability of the model and performed sensitivity
analysis, Later, some modifications were made to apply our model to achieve smaller or larger land
use.
2 Assumptions, justification and notations
Table 1: Notations
2.1. Assumptions and Justification
In order to simplify this problem and modify it to a condition which is more suitable for simulating real life, we
propose the following basic assumptions, each of which is a property description.
The exchange rate of RMB against the US dollar remains unchanged and the US dollar does not
depreciate or increase its value.
The ecological structure of the reservoir area is stable after a long time and the structural composition
remains unchanged.
Since then, the government has stopped making additional investments in the dam.
The annual power generation of the dam and the national average electricity price are stable.
2.2. Notations
We list the symbols and notations used in this paper, see Table 1.
3. Establishment of model
3.1 Comprehensive index system of ESV based on Costanza model
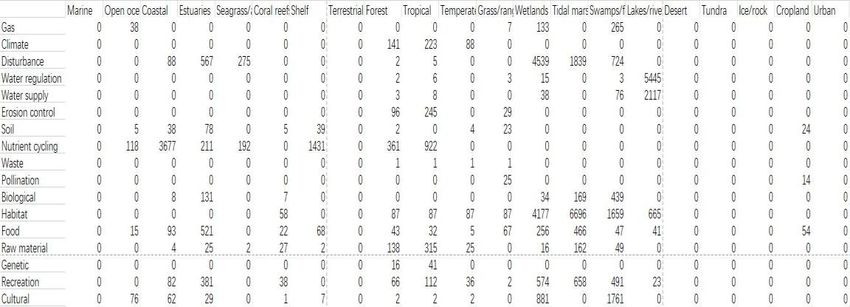
In the Costanza model [1], it presents global annual average ecosystem service value for 21 types and 17
indicators. (Table 2)
Table 2: The ecosystem service of different types [1]
Entropy weight method After getting the relevant data, we chose to use the entropy weight method (EWM) to
roughly filter the data:
Journal of Scientific and Engineering Research
247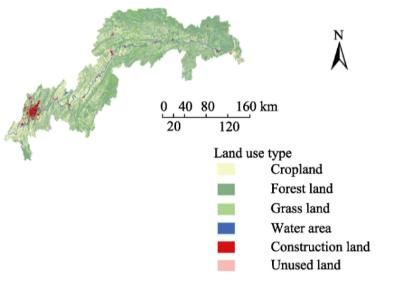
Sun Y et al Journal of Scientific and Engineering Research, 2020, 7(4):245-253
Because the cost of the service of each type of ecosystem is directly proportional to its economic value, so we
use the following formula to standardize the data.
xij min( xi )
yij j 1,2,..., n (1)
max( xi ) min( xi )
Where Xij is the value of the index j under the sample i.
After the data is standardized, we use the following formula to calculate the proportion of the sample i under the
index j.
n
Pj yij / yij (2)
i 1
Next we calculate the entropy value Li of each evaluation index.
n (3)
Li ln(n)1 pij ln( pij )
j 1
Based on the calculation of the entropy value, we further calculate the weight of each indicator.
1 Li i 1,2,..., n
wi n
(4)
k Li
i 1
We refer to Costanza et al. [1] to divide ecosystem services into 17 types of theories and use The Entropy
Method to calculate their own weights. (Table 3)
Table 3: Weights of land
And we make the following histogram:
Figure 2: Weights of land
The abscissa of the above histogram is represented from left to right:
Journal of Scientific and Engineering Research
248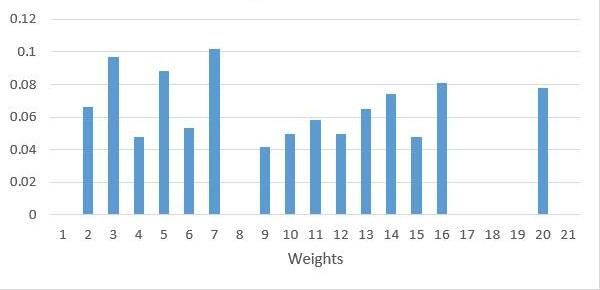
Sun Y et al Journal of Scientific and Engineering Research, 2020, 7(4):245-253
Marine, Open ocean, Coastal, Estuaries, Seagrass/algae beds, Coral reefs, Shelf, Terrestrial, Forest, Tropical,
Temperate/boreal, Grass/rangelands, Wetland, Tidal marsh/mangroves, Swamps/floodplains, Lakes/rivers,
Desert, Tundra, Ice/rock, Cropland, Urban[1].
And we categorized them roughly as Table 4 shows.
Table 4: Classification of ecological biomes [1]
We didn’t add all the data to the calculation. First, we excluded the type of data items all 0 out of the data item
type that was substituted into the calculation. Secondly, we also removed those that have little effect on the
experimental results, including the experiment itself. According to the relevant data, the experimental data items
summarized are: Cropland, Forest, Grass, Water, Construction land, and the Unused land.
At last, We get the form as Table 5 shows.
Table 5: Ecosystem service
3.2. Comprehensive measurement of environmental costs
In 1997, Costanza et al. calculated the average ecosystem service value based on 21 different indicators and 17
different types of areas, and established the Costanza model [1], and quantify the value of ecosystem services
according to it. Traditional ecosystem service assessment methods are mainly divided into two categories: value
assessment method and substance assessment method. In terms of value assessment, it is mainly to evaluate
Ecosystem services values [2] (ESV) from the perspective of value. It expresses the economic attributes of
ecosystem services in an intuitive way, that is, the economic value of the evaluation of ecosystem services by
monetization. We combined the model proposed by Costanza et al. [1] with the ESV model [2] and improved it
to obtain the following ESV calculation formula for different ecological types.
ESVi n×Ei ×Ai ( Ei Eij ) (5)
j 1
Journal of Scientific and Engineering Research
249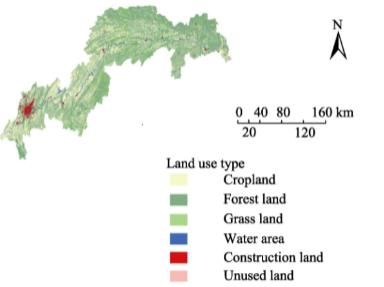
Sun Y et al Journal of Scientific and Engineering Research, 2020, 7(4):245-253
ESVs Ai ×nEi (6)
i
ESVloss / increase n ( Ei E0 ) Ai =n ( Ai A0 ) Ei (7)
i 1 i 1
3.3 Establishment of cost-benefit ratio improvement model
Benefit-cost analysis is a kind of method to evaluate the feasible options by comparing the present value of all
expected and all estimated costs of a project's various schemes for decision makers to make choices.
The formula for calculating the benefit-cost ratio [3] (K) is:
n
Bt
(1 r )
t 1
t
K= n
(8)
Ct
t 1 (1 r )
t
If the benefit-cost ratio is greater than 1, then this option is feasible, and on the contrary it is not feasible. The
selection of many programs is based on the level of indicators. The larger the indicator, the more feasible and
economical the program is.
However, due to the traditional cost-benefit model doesn’t take into account the impact and the changes of the
ecosystem services when calculating the land development costs, meanwhile the economic costs of the influence
are not included, so wo pass the cost-benefit ratio. The model has been improved and we make the changes in
ecological services are quantified and included, and a more realistic and comprehensive estimation formula for
the cost-effectiveness of a project is obtained:
n
Bt
(1 r )
t 1
t
ESVincrease
KEV n (9)
Ct
t 1 (1 r )
t
ESVloss
The assessment method is: if the benefit-cost rate is greater than 1, then the scheme is feasible, if less than 1 is
not feasible. The selection of many programs is based on the level of indicators. The larger the indicator, the
more economical and scientific the program is.
4. Case study of the models
4.1. Case 1: Shanghai
Table 6: The changes of land use in Shanghai [5]
Land use change in Shanghai
Land use type In 1995 In 2000 In 2005 In 2010 In 2015
A rea/ha Proportion/% A rea/ha Proportion/% A rea/ha Proportion/% A rea/ha Proportion/% A rea/ha Proportion/%
C ropland 539800 67.5 509880 63.8 469740 58.7 411080 51.4 400390 50.2
Forest land 21270 2.7 20480 2.6 35100 4.4 48960 6.1 49280 6.2
G rass land 3600 0.4 950 0.1 1150 0.1 750 0.1 590 0.1
W ater area 163560 20.5 172000 21.5 164290 20.5 159480 19.9 158260 19.8
C onstruction land 71410 8.9 96300 12 129290 16.2 179340 22.4 189280 23.7
U nused land 0 0 0 0 0 0 0 0 0 0
Next, we intend to use our established model to quantify the ecosystem services of Shanghai from 1995 to
2015.We reviewed the relevant information and obtained the changes in land use in Shanghai in 1995, 2000,
2005, 2010 and 2015. (Table 6)The table based on Table 5 Ecosystem service.
With the above data and the quantitative evaluation form of the ecosystem service of Shanghai land use type, we
can use the formula (7) to calculate the following thing:
ESVloss /increase =-61,225,720 USD
But if we assume that the type of land use does not change during the year, then we can use the formula (6) to
calculate the ESV of all types of land use in Shanghai over the past 20 years and the change in the total value of
ecological services ESVs asFigure 3 shows.
Journal of Scientific and Engineering Research
250Sun Y et al Journal of Scientific and Engineering Research, 2020, 7(4):245-253
1.6E+09
1.4E+09
1.2E+09
1E+09
80000000
60000000
40000000
20000000
0
1995 2000 2005 2010 2015
ESVs ESVcr ESVfl ESVgl ESVwa ESVcl ESVul
Figure 3: The changes of land ESV
4.2. Case 2: The Three Gorges Dam Reservoir Area
By consulting relevant information, we obtained relevant data from the Three Gorges Dam Reservoir Area:
At that time, the total investment of the project was 59.75 billion US dollars (including static
investment of 39.64 billion US dollars and dynamic investment of 20.11 billion US dollars) [6].
Installed capacity is 22.4 million kilowatts [6]
Assume that the operating time of the Three Gorges Dam is 150 days per year.
It can be calculated that the annual power generation of the Three Gorges Dam is 80.64 billion kWh.
Assume that the average electricity price in recent years is $0.1/kWh, and the net profit is 60% of
annual income.
It can be calculated that the annual net profit of the Three Gorges Dam is 4.84 billion US dollars, and
the annual cost is 3.23 billion US dollars.
Land use change in the Three Gorges Dam area from 2000, 2007 and 2014 can be obtained through
satellite remote sensing technology and reference papers.
Figure 4: The land use status in 2000, 2007, 2014 [4]
The Table 7 based on Table 5 Ecosystem service, we can use the formula (7) to calculate the following thing:
ESVloss /increase =135,641,715,000 USD
Then bring the above existing data into the cost-effective improvement mode (9)
and then calculate the true benefit of this project cost-rate KEV=1.62.
Journal of Scientific and Engineering Research
251Sun Y et al Journal of Scientific and Engineering Research, 2020, 7(4):245-253
Table 7: The changes of land use in the Three Gorges Reservoir Area[4]
5. The validity analysis of the model
The model that we propose can only roughly estimate the true cost-benefit ration of a project. Because we use
the 17 indicators of the Costanza model [1] and the ESV quantification table [1] to discuss the weight of the
ecological types proposed, and remove the most of types that we can’t calculate we can’t refer to, and finally we
get a simplified ESV quantification table and apply it to the application. Through the quantitative assessment of
ecological services in the Three Gorges Dam reservoir area from 2000 to 2014, the estimation of cost-benefit
ratio and the evaluation of ESV during the construction of Shanghai from 1995 to 2015, rough results were
obtained. At the same time, based on the preliminary fitting of the results and the actual situation, we found that
is basically met the expected goals.
6. Conclusion
Strengths of our model We based on the Costanza model [1] to improve the EVS formula [2] and optimize the
cost-benefit ration formula [3] to enable a rough estimate of the ESV of a project and the true cost-benefit ratio
after considering the impact on the ecosystem service, According to the simplified ESV quantification table [1],
it is more suitable for quantitative evaluation of ecological services changes due to changes in the land uses
types, which is convenient to use.
We improve the cost-benefit ratio [3] formula so that it can calculate the cost-benefit ratio of changes in
ecological services more realistically and accurately, It will make land planners and managers to plan and utilize
land for project projects more intuitively and conveniently, improve land use patterns, make land utilization
higher, promote ecological balance and sustainable development, promote indirectly social development and
human history and promote ecological balance and sustainable development.
Weakness of our model But our model still has a lot of shortcomings, for example, if the evaluation parameters
are so small that the results may cause large deviations or the project data is not enough so we must use so many
assumptions, and the results can only be quantified and analyzed, but the change process cannot be simulated
and predicted and so on.
Further Exploration In the future, the model needs to be improved, for example, adding more time evaluation
parameters to the model enables it to speculate on unknown data based on existing data and even predict and
analyze the impact on the environment after a project finished. In this way, it is possible to more accurately
estimate and predict the ESV change of a project and the cost-benefit ratio.
Acknowledgments
This work was supported by National Undergraduate Innovation Training Program of SUES under Grant No.
201910856037.We would like to thank our instructor, Zhongtuan Zheng, for constructive comments and
suggestions on this work.
References
[1]. Costanza, R., d’Arge, R., de Groot, et al. The value of the world’s ecosystem services and natural
capital [J]. Nature, 1997, 387:253– 260.
[2]. Zhong Minzhou. Optimal allocation of land resources based on ecosystem services, a case study of risk
management for land use decisions in Changsha, Middle China. [D]. Hunan University, 2018.
Journal of Scientific and Engineering Research
252Sun Y et al Journal of Scientific and Engineering Research, 2020, 7(4):245-253
[3]. Benefit-cost analysis of land resources development and utilization [J]. Technology of Soil and Water
Conservation, 1988, (04): 23-25.
[4]. Zhang Xiaojuan, Zhou Qigang, Wang Zhaolin, Wang Fuhai. Simulation and prediction of land use
change in Three Gorges Reservoir Area based on MCE-CA-Markov [J]. Transactions of the Chinese
Society of Agricultural Engineering (Transactions of the CSAE), 2017, 33(19): 268-277.
[5]. Fan Lijuan, Tian Guangxing. Land use and landscape pattern dynamics of Shanghai City during 1995-
2015[J]. Bulletin of Soil and Water Conservation, 2018, 38(1):287-292.
[6]. Audit Office: Audit Results of Draft Financial Final Accounts for the Completion of the Three Gorges
Project on the Yangtze River http://www.gov.cn/gzdt/2013-06/07/content_2421795.htm
[7]. Xu Ting-ting, et al. Research on Shanghai Comprehensive Vulnerability Assessment of Climate
Change – Based on PSR Model [J]. Resource Development & Market 2015, 31(3): 288-292.
Journal of Scientific and Engineering Research
253You can also read