BRISBANE MARKET OUTLOOK - AUSTRALIA FEBRUARY 2019 REAL ESTATE RESEARCH
←
→
Page content transcription
If your browser does not render page correctly, please read the page content below
BRISBANE MARKET OUTLOOK
AUSTRALIA
FEBRUARY 2019
REAL ESTATE RESEARCH
WHERE ARE WE IN THE CYCLE?
BRISBANE IMPROVING AS ECONOMY ENTERS SUSTAINED RECOVERY
                                                                       Regional Retail
                                                   Sydney CBD Office
                                                                                         Neighbourhood Retail
                                     Melbourne CBD Office

                                                                                                           Sub Regional Retail

                    Sydney Industrial

        Melbourne Industrial               Expansion                                     Contraction

     Brisbane CBD Office

      Perth CBD Office

                                             Recovery                                    Correction
          Brisbane Industrial

                                Perth Industrial

                                                                                                                                 // 2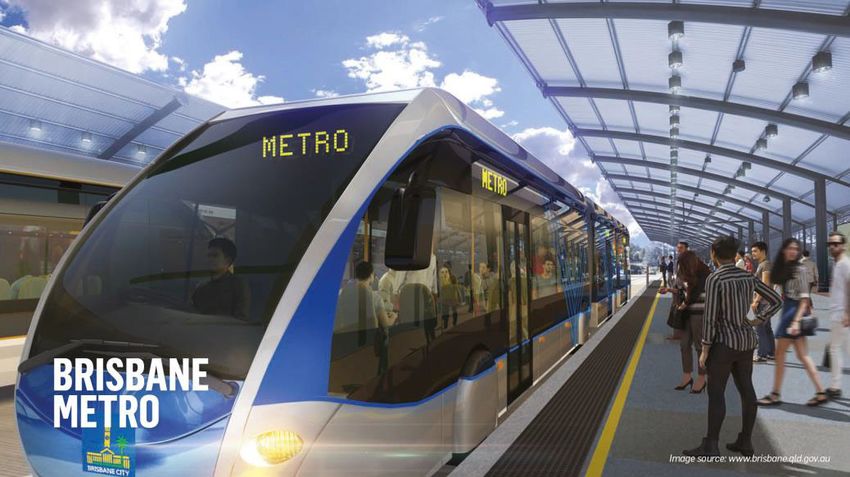
ECONOMIC OUTLOOK
     BRIGHTER DAYS AHEAD
 >        The value of engineering construction work done in                                                Population growth outlook by state

          QLD finally lifted over the past year, with public                                                 2.5%
                                                                                                                     2.3%

          spending to support an increasing level of road and                                                             2.0%
                                                                                                                                                 2012-17     2018-22
                                                                                                             2.0%
          rail construction.                                                                                                            1.6%
                                                                                                                                    1.5%            1.5%1.5%
 >        Higher interstate migration is set to support higher                                               1.5%
                                                                                                                                                                       1.2%1.1%
          population growth while a lower $AUD is expected to
                                                                                                             1.0%
          lead to a stronger contribution by the tourism &                                                                                                                          0.8%0.8%

          education sector.                                                                                  0.5%

 >        After VIC, the QLD economy is expected to
                                                                                                             0.0%
          experience the strongest economic growth over the                                                             VIC           QLD             NSW                WA            SA

          next 5 years.                                                                                                                               Source: DAE & AMP Capital Property Research

Gross state product (GSP) - QLD                                                                            Gross state product growth outlook - 5yr avg.
Annual rests:                                                                                              3.5%       3.3%
6.0%                                                                                                                                 3.0%
                                                                                     10yr avg              3.0%                                       2.9%

5.0%                                                                                 Historic avg
                                                                                                           2.5%                                                         2.2%           2.2%
4.0%                                                                                                       2.0%

3.0%                                                                                                       1.5%

2.0%                                                                                                       1.0%

                                                                                                           0.5%
1.0%
                                                                                                           0.0%
0.0%                                                                                                                   VIC           QLD              NSW                SA            WA
       2008     2010   2012   2014     2016      2018      2020       2022      2024      2026                                                       Source: DAE & AMP Capital Property Research
                                     Source: Deloitte Access Economics and AMP Capital Property Research
                                                                                                                                                                                                    // 3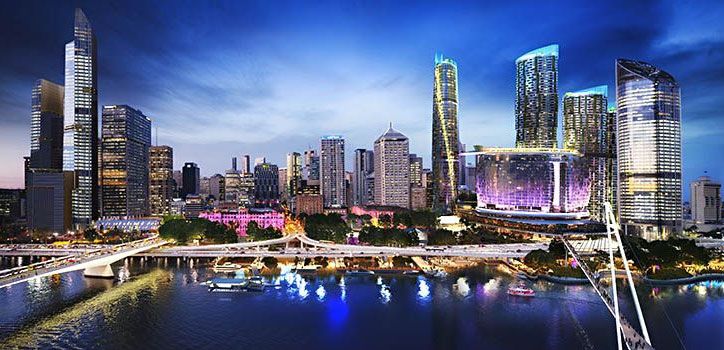
ECONOMIC CONDITIONS
      JOB GROWTH AT THE HIGHEST LEVEL SINCE GFC

 >           With the wind down of the mining investment                                        NAB business conditions - QLD
                                                                                                Quarterly rests:
             boom now a thing of the past, economic                                             30.00
             conditions have started to improve.                                                  25.00
                                                                                                                                                           Busine ss Con diti ons QL D

 >           Improving business conditions have translated into                                   20.00
             a turnaround in labour market conditions with                                        15.00
             QLD experiencing strong levels of jobs growth                                        10.00
             over the past 12 months.                                                                        5.00

 >           The improving labour market has started to attract                                              0.00
             an increasing number of job seekers with QLD                                              -5.00
             overtaking VIC as the state with the highest                                     -10.00
                                                                                                    2010                           2011     2012   2013    2014       2015        2016         2017       2018
             amount of interstate migrants.
                                                                                                                                                              Bloomberg, NAB and AMP Capital Property Research

Employment growth - QLD                                                                         Unemployment rate by State
Annual change monthly rests:                                                                    Quarterly rests:
 7%                                                                                                                   9.0
                                  QLD                                                                                                                                NSW                 VIC               QLD
 6%                                                                                5.2%
                                                                                                                                                                     WA                  ACT               SA
 5%                               Australia ex Q LD                                                                   8.0

                                                                                              Unemployment rate (%)
 4%                                                                                                                   7.0
 3%
 2%                                                                                3.1%                               6.0
 1%
                                                                                                                      5.0
 0%
-1%                                                                                                                   4.0
-2%
-3%                                                                                                                   3.0
      2013         2014        2015            2016             2017                2018
                                                                                                                      2.0
                                                                                                                            2013          2014      2015           2016              2017              2018
                                                      ABS and AMP Capital Property Research                                                                                    ABS and AMP Capital Property Research
                                                                                                                                                                                                         // 4
QLD INFRASTRUCTURE SPENDING
SIGNIFICANT PIPELINE OF MAJOR PROJECTS TO SUPPORT GROWTH
~$5.4bn ~$1.0bn
~$3.6bn ~$100m
~$2.0bn
BRISBANE
LIVE
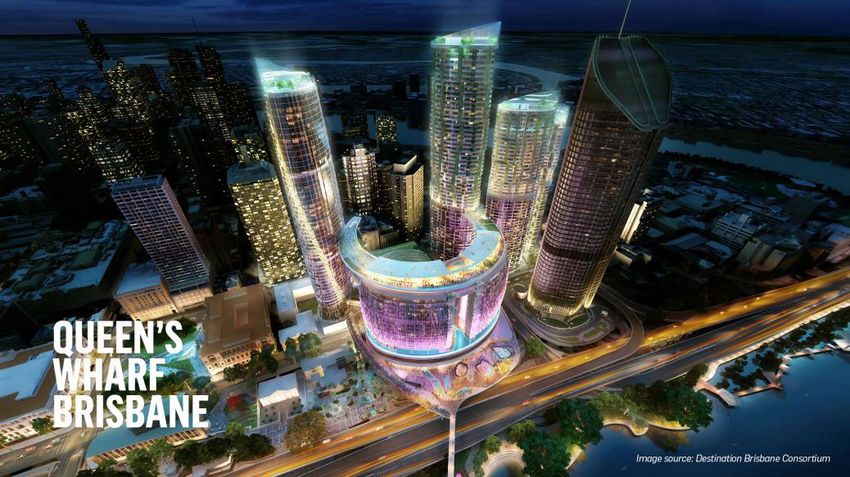
> The QLD government has committed to a significant pipeline of infrastructure construction projects
(~43bn over the next 6 years).
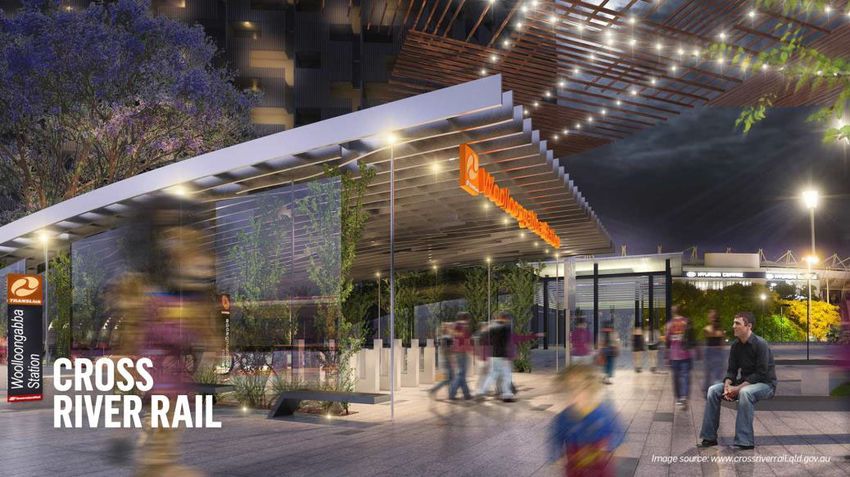
> The pipeline includes a number of transformative projects in inner Brisbane such as the Cross River
Rail, Queen’s Wharf Brisbane and the Brisbane Metro
|5RESOURCES SECTOR
RESOURCE SECTOR RECOVERY ALSO SUPPORTIVE OF STRONGER DEMAND
Base commodity index
Monthly rests
180
> Both resources prices and export volumes have 160
recovered from their cyclical lows.
140
> Higher profitability levels in the resources sector
120
have historically had a positive impact on office
demand in the Brisbane CBD. 100
80 +45%
60
2006 2007 2008 2009 2010 2011 2012 2013 2014 2015 2016 2017 2018
RBA and AMP Capital Property Research
NAB Business conditions and Brisbane office demand Coal export volumes
Quarterly rests: Brisbane CBD office market Monthly rests
5% 80 395
4%
Change in occupied space, YoY
60 390
3%
2% 40
Mining conditions
385
1%
0% 20
380
-1% 0
-2% 375
-3% -20
-4% 370
Occupied space (lhs) -40
-5%
-6%
Mining conditions, a dv 3mths
-60 365
2006 2007 2009 2010 2012 2013 2015 2016 2018 2014 2015 2016 2017 2018
Bloomberg, NAB and AMP Capital Property Research RBA and AMP Capital Property Research
// 6CAP RATE OUTLOOK
BRISBANE YIELDS APPEALING TO INVESTORS LOOKING FOR UPSIDE
Office Cap Rate Outlook
> Cap rates in high-demand markets such as Melbourne
10.0%
Sydney CBD Melbourne CBD
Leading Regionals, core office, and industrial will 9.0%
Brisbane CBD Perth CBD
continue to sharpen over the next 12 months.
> Transaction evidence shows Sub-regionals have already 8.0%
started to soften and this will continue. 7.0%
> Decompression is expected to be less pronounced than
the sharpening fixed interest cycle due to the amount of 6.0%
money on the sidelines wanting to get in at the right price.
5.0%
> Due to the degree of sharpening, movements will have a
larger-than-usual percentage impact on capital return. 4.0%
2000 2002 2004 2006 2008 2010 2012 2014 2016 2018 2020 2022 2024 2026 2028
Source: JLL; AMP Capital
Retail Average Cap Rate Outlook Industrial Cap Rate Outlook
11.0% 10.0%
Leading Regional Other Regional
Sydney Melbourne Brisbane
Sub-regional Neighbourhood 9.5%
10.0%
9.0%
9.0% 8.5%
8.0%
8.0%
7.5%
7.0%
7.0%
6.0% 6.5%
6.0%
5.0%
5.5%
4.0% 5.0%
2000 2002 2004 2006 2008 2010 2012 2014 2016 2018 2020 2022 2024 2026 2028 2000 2002 2004 2006 2008 2010 2012 2014 2016 2018 2020 2022 2024 2026 2028
Source: JLL; AMP Capital Source: JLL; AMP Capital // 7BRISBANE CBD OFFICE
VACANCY AT A 5 YEAR LOW BUT INCENTIVES REMAIN ELEVATED
Space Market Conditions
Brisbane CBD Office Market Brisbane space market fundamentals
2008 2013 2016 2017 2018 Quarterly rests
Item 10yrs 5yrs 1yr 1yr YTD 70 Net additions Net absorption Vacancy 20%
Occ. Space (s) 1,738 1,839 1,889 1,922 1,927
60
Dem and Net Abs (a) 19 -5 50 33 5 18%
CAGR 1.0% 0.9% 2.7% 1.8% 0.3%
50
16%
Vacancy Rate
space (000, sqm)
Stock (s) 1,808 2,176 2,270 2,260 2,250 40
Supply Net Add (a) 52 20 78 -10 -10 30 14%
CAGR 2.3% 0.8% 3.5% -0.4% -0.4% 20
Space (s) 70 336 381 338 323 10 12%
Vacancy Rate (s) 3.9% 15.5% 16.8% 15.0% 14.4%
0 10%
WSR (s) 14.1 15.1 15.0 15.0 15.0
NGER (a) -6.4% -2.7% -1.9% -1.0% 1.4% -10
8%
Rents NGFR (a) -1.1% 0.3% 0.8% 2.5% 1.5% -20
Incentives* 5% 30% 36% 39% 39% -30 6%
BOD (s) 100,596 100,518 103,848 104,887 106,907 Dec-13 Sep-14 Jun-15 Mar-16 Dec-16 Sep-17 Jun-18
WCE WCE (s) 0 121,494 126,025 128,130 130,169
Source: JLL and AMP Capital Property Research
CAGR 0.4% 1.1% 0.4% 1.7% 1.6%
JLL, Deloitt e Access Economics and AM P Capital Propert y Research
> Net absorption remains positive YTD (+5k sqm) but recorded a negative reading in 2Q:18 (-10,500
sqm), mainly reflecting Aurizon’s move to the Fringe market (Fortitude Valley). Excluding this move
net absorption would have been positive (+8,300 sqm). Notably, most of the Aurizon backfill was
taken up by WeWork (7,200sqm) which opened its first office in Brisbane.
> Limited supply is assisting the market to retreat from a cyclically high vacancy rate. Market vacancy
has slightly increased (50bps) to 14.4% and remains on a downward trajectory.
// 8BRISBANE CBD OFFICE
RENTS HAVE STABILISED BUT INCENTIVES STILL AT RECORD HIGHS
Prime effective rental growth Nominal rents and incentives
Annual rests
10%
0.5% 1.4% 900 Ince nti ves NGER NGFR
0% 800
-2.5% 700
-10%
600
NGER grow th
Nominal ($)
-20% -17.4%
500
400
-30%
300
-40% 200
100
-50%
0
2000
2001
2002
2003
2004
2005
2006
2007
2008
2009
2010
2011
2012
2013
2014
2015
2016
2017
2018
-60% -53.8%
10 yrs 5 yr s 3 yr s 1yr 6 months
Source: JLL and AMP Capital Property Research
Source: JLL, AMP Capital Property Research
Incentives and vacancy
> Effective rental growth remains muted but has turned Annual rests
positive. With incentives remaining stable, rental 45% 18%
growth has been driven by stronger face rents. 40% Ince nti ves Vacancy
38.8%
16%
35% 14%
> Rental uplift appears to be driven by “small tenant”
% of a ten year lease
30% 12%
Vacancy rate
moves, with recent leasing activity being dominated by 25% 10%
smaller tenancies 20% 8%
15% 6%
> In light of elevated vacancy levels, landlords continue 10% 4%
to offer high levels of incentives in order to secure 5% 2%
longer-term lease agreements. Incentives are now at 0% 0%
their highest level in the last 20 years. 98 00 02 04 06 08 10 12 14 16 18
Source: JLL & AMP Capital Property Research
// 9BRISBANE CBD OFFICE
DIVERGING PERFORMANCE ACROSS GRADES
Net absorption by grade Vacancy by grade
Jun-17 Sep -17 Dec-17
Quarterly rests: Prime and secondary stock Quarterly rests:
Mar-18 Jun-18 10yr avg
150 22%
Prime Second ary Tota l
20%
Annual space take-up (000 sqm)
100 18%
16%
50
Vacancy rate
14%
12%
10%
-50
8%
-100 6%
4%
-150 2%
05 06 07 08 09 10 11 12 13 14 15 16 17 18 Pre miu m A-G rade B-G rade Second ary Tota l
Source: JLL and AMP Capital Property Research
JLL and AMP Capital Property Research
> Tenants continue to take advantage of favourable Sub-lease Vacancy
leasing conditions to upgrade to higher quality Annual rests
premises. Government tenants have been very active 3.5%
in particular. 3.0%
Sub-lease vacancy %
2.5%
> Positive take-up levels of prime stock continues to 2.0%
push Prime and A-Grade vacancy lower, while 1.5%
secondary vacancy levels remain elevated.
1.0% 0.8%
> Notably, sub-lease vacancy has continued to decline 0.5%
and is now at the lowest levels since 2011. 0.0%
JLL and AMP Capital Property Research
// 10BRISBANE CBD OFFICE FORECAST
FIRMING FUNDAMENTALS WILL DRIVE UPSIDE
Incentives and vacancy
Space market fundamentals
Annual rests
Annual rests
250 Net additions Net absorption 20% 45% 18%
Forecast Ince nti ves Vacancy
Vacancy rate (rhs) 40% 16%
200 15%
35% 14%
150
10%
space (000, sqm)
% of a ten year lease
30% 12%
Vacancy rate
Vacancy Rate
100
5% 25% 10%
50
0% 20% 8%
0
15% 6%
-5%
-50 10% 4%
-100 -10% 5% 2%
-150 -15% 0% 0%
05 07 09 11 13 15 17 19 21 23 25 27 92 94 96 98 00 02 04 06 08 10 12 14 16 18 20 22 24 26
Source: JLL & AMP Capital Property Research. Source: JLL & AMP Capital Property Research
Incentives and rental forecasts
> Tenants continue to take advantage of favourable Annual rests
leasing conditions to upgrade to higher quality 1,000
premises. Government tenants have been very active 900
Ince nti ve NGFR NGER Forecast
in particular. 800
700
> Positive take-up levels of prime stock continues to 600
push Prime and A-Grade vacancy lower, while 500
secondary vacancy levels remain elevated. 400
300
> Notably, sub-lease vacancy has continued to decline 200
and is now at the lowest levels since 2011. 100
0
01 03 05 07 09 11 13 15 17 19 21 23 25 27
Source: JLL & AMP Capital Property Research
// 11FORECAST RETAIL SUPPLY
SUPPLY WILL DILUTE SALES AT EXISTING CENTRES
New supply as a Proportion of Total Stock
Completed, Under Construction, and Plans Approved only Neighbourhood From FY2019-21
15-year = 2.7% Sub-Regional
7.0%
10-year = 2.1% Regional NSW 255,000 sqm
2019 = 2.5% 15-year Average
6.0% 10-year Average VIC 150,000 sqm
2020 = 1.8%
2021 = 2.2%
5.0% QLD 320,000 sqm
4.0% WA 235,000 sqm
3.0% SA 50,000 sqm
2.0%
Regional 340,000 sqm
1.0%
Sub-Regional 300,000 sqm
0.0%
2002 2003 2004 2005 2006 2007 2008 2009 2010 2011 2012 2013 2014 2015 2016 2017 2018 2019 2020 2021 2022 2023 Neighbourhood 370,000 sqm
FY2019 Type State Retail Area FY2020 Type State Retail Area FY2021 Type State Retail Area
Coomera Sub-Regional QLD 55,000 Toombul Sub-Regional QLD 45,500 Castle
Regional NSW 80,000
Towers
Sunshine Ipswich
Regional QLD 37,000 Neighbourhood QLD 30,000
Plaza City Karrinyup Regional WA 53,000
Rhodes Sub-Regional NSW 34,000 Yamanto Neighbourhood QLD 20,000 Galleria Regional WA 52,000
Carousel Regional WA 27,500 Marsden
Sub-Regional QLD 19,500 Innaloo Sub-Regional WA 47,500
Park
South
Neighbourhood NSW 25,000 The Glen Regional VIC 19,000 Knox Regional VIC 45,000
Village
Source: JLL
// 12RETAIL OUTLOOK
LEADING REGIONALS WILL BE SOLID, SUB-REGIONALS NOT SO MUCH
Specialty Rental Growth Forecast (p.a. %)
5-year average by state and centre type
> Pressure on the supply/demand equation
3.0
> Neighbourhoods to perform well on a 2.5
sales growth basis due to online-resilient
2.0
categories and inflation tailwinds
1.5
> Middle market Sub-regionals will need to 1.0
re-base value of space to remain
0.5
competitive…OCRs to decrease
0.0
> Leading Regionals to benefit from highest -0.5
market share gains due to dominance and
-1.0
continued retailer demand
-1.5
NSW VIC QLD WA SA NSW VIC QLD WA SA NSW VIC QLD WA SA NSW VIC QLD WA SA
> House view preference is for Leading
Leading Regional Other Regional Sub-Regional Neighbourhood
Regionals which can support ELPs and
Neighbourhoods with strong convenience Forecast
Leading Reg. Other Reg. Sub Reg. N’Hood
(5yr average p.a. %)
Total return 5.4 4.3 3.5 5.9
Income return 4.6 5.6 7.1 6.7
Capital return 0.8 -1.3 -3.6 -0.8
| 13INDUSTRIAL OUTLOOK
PERSISTENT UNDERSUPPLY WILL EXTEND GROWTH THEMATIC
Gross Take Up Supply vs Take Up East Coast Industrial
> Industrial demand levels are at a ten year
high and well above the long term average
trend of 2 million square meters p.a. 1,000,000
5.6m sqm of undersupply
> The rapid rise in demand for e-commerce
services is providing a strong tailwind for 500,000
industrial demand
0
> Since 2008 industrial take up from e-
commerce categories such as transport,
logistics, retail and wholesale trade have -500,000
risen from 45% of all lease deals to 80%
as at Q3 2018
-1,000,000
> Traditional industrial sectors such as
manufacturing and construction continue
to drive underlying demand for the sector -1,500,000
2008 2009 2010 2011 2012 2013 2014 2015 2016 2017 2018 2019e
as it gradually transitions from blue collar
to high tech industrial industries NSW QLD VIC East Coast
Source: JLL REIS/AMPCI RE Research
| 14INDUSTRIAL OUTLOOK
POSITIVE RENTAL GROWTH OUTLOOK, FAVOURING SYDNEY
Prime Net Rental Growth 5 Yr Forecast by Precinct
Annual Rests % Growth
> Favourable demand conditions, rising land
values and muted supply levels are driving 6.0
5.2
increased rental growth across East Coast
5.0
industrial markets
4.0
> Pent up demand from industrial tenants 3.3
3.1 3.0 2.9
reached over 5m sqm from 2009-2018, 3.0 2.8
2.5 2.4
with an estimated 600k in 2019 1.7
2.0 1.7
> Rising land costs, low supply levels and
1.0
strong demand point to a positive rental
outlook for industrial, favouring the Sydney 0.0
Sydney South Sydney Inner Sydney Central Brisbane South Brisbane Trade Melbourne Melbourne West Brisbane North Adelaide (North) Perth (Southern)
market West Outer West Coast South East
> Scope to increase weighting to the Source: AMPCI RE Research
industrial sector given solid performance
Forecast
outlook and long-term structural tailwinds (5yr average p.a. %)
SYD MEL BNE
Total return 8.4 7.8 5.9
Income return 5.5 6.0 6.2
Capital return 2.8 1.8 -0.3
| 15HOUSE VIEW 5-YEAR FORECASTS (2019-23) – TOTAL RETURNS
WHERE WILL INVESTORS GET THE HIGHEST RETURNS?
Total Returns Forecast (p.a. %) Retail
> Brisbane’s late cycle recovery will offer higher income 5-year average by state and centre type
growth upside through 2020, as Melbourne and Sydney 7.0
markets cool. 6.0
> Yield spreads between Sydney/Melbourne versus 5.0
Brisbane will narrow across all categories except retail in
4.0
2019.
3.0
2.0
1.0
0.0
NSW VIC QLD WA SA NSW VIC QLD WA SA NSW VIC QLD WA SA NSW VIC QLD WA SA
Leading Regional Other Regional Sub-Regional Neighbourhood
Total Returns Forecast (p.a. %) Office Total Returns Forecast (p.a. %) Industrial
5-year average 5-year average
7.0 9.0 8.4
6.1 7.8
8.0
6.0 5.7
7.0
5.0 4.6 4.6 5.9
4.4 6.0
4.0 5.0
4.0
3.0 2.5
3.0
2.0
2.0
1.0
1.0
0.0 0.0
Sydney CBD Melbourne CBD Brisbane CBD Perth CBD Adelaide Canberra Sydney Melbourne Brisbane
// 16IMPORTANT
NOTE
The information contained in this document, including any attachments (collectively, "Information") has been prepared by AMP Capital Investors Limited (ABN 59 001 777 591) (AFSL 232497) (“AMP
Capital”) and its associates for providing general information about the investment capabilities referred to in the Information (“Capabilities”) and is qualified in its entirety by any product disclosure
statement, information memorandum, private placement memorandum or other relevant documentation. The Information is not intended for distribution or use in any jurisdiction where it would be
contrary to applicable laws, regulations or directives and does not constitute a recommendation, offer, solicitation or invitation to invest regarding the Capabilities.
Prospective investors should not treat the Information as advice on legal, tax or investment matters and should make their own inquiries and consult professional advisers as to applicable laws,
regulations and requirements in any particular jurisdiction (including, where the Information is received) and the consequences arising from any failure to comply.
The Information may contain projections, forecasts, targeted returns, illustrative returns, estimates, objectives, beliefs, back-testing, hypothetical returns, simulated results, non actual and similar
information ("Non Actual Information"). Non Actual Information is provided for illustrative purposes only and is not intended to serve, and must not be relied upon as a guarantee, an assurance, a
prediction or a definitive statement of fact or probability. Actual events and circumstances are difficult or impossible to predict and will differ from assumptions. Many actual circumstances are beyond
the control of AMP Capital. Some important factors that could cause actual results to differ materially from those in any Non Actual Information include changes in domestic and foreign business,
market, financial, interest rate, political and legal conditions. Various considerations and risk factors related to an investment in a Capability are described in relevant documentation. There can be no
assurance that any particular Non Actual Information will be realised. The performance of any investment or product may be materially different to the Non Actual Information.
The Information does not purport to be complete, does not necessarily contain all information which a prospective investor would consider material, and has been prepared without taking account of
any particular person’s objectives, financial situation or needs. While every care has been taken in preparing the Information, except as required by law, no representation or warranty, express or
implied, is made in relation to the accuracy or completeness of the information provided in this document. Accordingly, the Information should not form the basis of any investment decision. A person
should, before deciding, consider the appropriateness of the Information, and seek professional advice, having regard to the person’s objectives, financial situation and needs and should read the risks
section of any relevant document relating to the Capability.
Past performance is not a reliable indicator of future performance. Capabilities are subject to investment risks, which could include delays in repayment, and loss of income and capital invested. No
company in the AMP Group assumes any liability to, or takes any responsibility for any loss or damage suffered by, investors in connection with investment in a Capability or guarantees the
performance of a Capability or any rate of return or any obligations. Investments in a product are not deposits or liabilities of any company in the AMP Group and repayment of capital is not guaranteed.
Photographic images used are for illustrative purposes only and may not represent actual images of assets or opportunities described in the Information.
The Information is provided on a confidential basis and must be kept strictly confidential (with the exception of providing it to your professional advisors who are also contractually and/or professionally
bound to keep it confidential) and may not be reproduced or redistributed (in whole or in part) or otherwise made available to any other person in any format without the express written consent of AMP
Capital.
This Information, unless otherwise specified, is current at the date of publication and will not be updated or otherwise revised to reflect information that subsequently becomes available, or
circumstances existing or changes occurring after that date.
By accepting this Information, you agree to be bound by these limitations, terms and conditions.
TO ADD PRESENTATION TITLE TO YOUR FOOTER: GOTO THE INSERT TAB / HEADER & FOOTER OPTION / AND ADD YOUR TEXT | 17You can also read