SUGI CAPITAL MANAGEMENT - Global Real Estate Securities Market First Quarter 2019 Market Review

Page created by Seth Glover
 
CONTINUE READING
SUGI CAPITAL MANAGEMENT - Global Real Estate Securities Market First Quarter 2019 Market Review
SUGI CAPITAL MANAGEMENT
Global Real Estate Securities Market
First Quarter 2019 Market Review

April 9, 2019
SUGI CAPITAL MANAGEMENT - Global Real Estate Securities Market First Quarter 2019 Market Review
DISCLAIMERS

The information contained in this presentation is strictly confidential and intended solely for use of the persons to whom it has been delivered. It is not
to be reproduced or distributed to any other person.
This presentation contains information which is based on, or derived from, information provided by independent third-party sources. Sugi Capital
Management, Inc. (“Sugi Capital”) believes that such information is accurate and that the sources from which it has been obtained are reliable.
However, neither Sugi Capital nor any related companies or principals guarantee the accuracy, timeliness or consequential losses arising from its use. All
such information contained herein is for information purposes only and does not constitute an offer to sell or a solicitation to buy any securities and is
subject to change without prior notice. Readers should not assume that their performance will equal or exceed historical results and/or averages.
Past performance is not indicative of future performance. Except as required by applicable law, Sugi Capital is under no obligation to update this
presentation or the information herein, other than its obligation to provide quarterly portfolio performance reports to its investors.
This presentation may contain forward-looking information that involves risks and uncertainties, and readers are cautioned not to put undue reliance on
these forward-looking statements. Forward-looking statements speak only as of the dates noted, except as required by applicable law, we undertake no
obligation to update or revise such statements to reflect new circumstances or unanticipated events as they occur. No assurance can be given that the
results in any forward-looking statements will be achieved and actual results could be affected by one or more factors, which could cause them to differ
materially. Set forth for these statements, we claim the protection of the safe harbor for forward-looking statements contained in the Private Securities
Litigation Reform Act. The information contained herein does not constitute a recommendation to buy or sell anything and should not be considered by
anyone to be a substitute for their own judgment. This is not and may not be used as a solicitation.
All references in this presentation to “$” or to dollars are references to U.S. dollars unless otherwise noted. For more information, please contact our
investors relations team at: ir@sugicapital.com.

    Sugi Capital Management, Inc.                                                                                                                1
SUGI CAPITAL MANAGEMENT - Global Real Estate Securities Market First Quarter 2019 Market Review
A GOOD QUARTER FOR MOST ASSET CLASSES

  1Q19 PERFORMANCE – EQUITIES, BONDS, REITS, AND COMMODITIES
18.00%                                                                                                            After a dismal fourth quarter of
                                       Commodities                                                                2018, global REITs roared back in
16.00%                                 Global REITs                                                               the first quarter of 2019

14.00%                                 Global Equity
                                       Global Bonds
12.00%

10.00%

  8.00%

  6.00%

  4.00%

  2.00%

  0.00%
                                                                                  2/12/2019
                                   1/15/2019

                                               1/22/2019

                                                           1/29/2019

                                                                                              2/19/2019

                                                                                                          2/26/2019

                                                                                                                                   3/12/2019

                                                                                                                                               3/19/2019

                                                                                                                                                           3/26/2019
            1/1/2019

                        1/8/2019

                                                                       2/5/2019

                                                                                                                        3/5/2019
 -2.00%

 -4.00%

Source: Bloomberg LLC, April 1, 2019

Sugi Capital Management Inc.                                                                                                                                   2
REIT MARKETS BOUNCED BACK, IN SYNC

GLOBAL REAL ESTATE STOCK PERFORMANCE BY REGION, 1Q19 (USD RETURNS)

 FTSE EPRA NAREIT Developed AUSTRALIA Index

              FTSE EPRA NAREIT Developed US Index

          FTSE EPRA NAREIT Developed ASIA Index

             FTSE EPRA NAREIT Developed UK Index

     FTSE EPRA NAREIT Developed EUROPE Index

                                                                             0%   2%   4%   6%   8%   10%   12%   14%   16%   18%

 Source: EPRA,, the European Public Real Estate Association, April 4, 2019

 Sugi Capital Management Inc.                                                                                                 3
1Q19 HEADLINES – JANUARY AND FEBRUARY

January
▪ Economics: IMF cut global growth forecasts. Fed stayed on hold and sounded more dovish
▪ Europe: Portuguese government approved the introduction of REITs
▪ Asia: China saw its lowest GDP growth in a decade at 6.4%. India forecast to remain fastest-growing
  (7.6%) economy in 2019-20, according to UN’s report
February
▪ US Politics: Agreement yet to be reached in second Trump–Kim Jong Un summit. Trump declared
  national emergency to build the wall. US pulled out of Russian nuclear treaty. Trump ruled out a Xi
  Jinping meeting ahead of March 1 trade deadline, but trade talks appeared to make progress
▪ US Retail: December US retail sales the worst since 2008. Bankruptcy court approved Chairman
  Lampert's bid to keep Sears alive. Payless ShoeSource to close all ~2,300 stores
▪ UK/Europe: BOE lowered 2019 GDP forecast to +1.2%. European Commission cut their forecast for
  Eurozone GDP from 1.9% to 1.3%. Germany factory orders reported down 7.0% and retail sales down
  4.3% in December, the worst in 11 years. Italy’s GDP went negative
▪ Asia: Chinese state-run paper warned for the potential of only 6.0% GDP growth in 2019. Sri Lanka
  made plans to introduce REITs

  Sources: Bank of America Merrill Lynch, Bloomberg LLC, January, February 2019

  Sugi Capital Management Inc.                                                                   4
1Q19 HEADLINES – AN EVENTFUL MARCH!

March
▪ Capital markets: S&P ended its best quarter since 2009. US 3 month - 10 year yield curve inverts first
  time since 2007. German 10-year bund yield moved into negative territory for the first time in 3 years
▪ Economics: OECD cut 2019 global growth outlook again to 3.3% in 2019 (↓0.2%). US economy grew by
  2.9% in 2018, best performance in 3 years. German 2019 GDP forecasts cut -0.7% to
  +0.8%. Australia unemployment fell to 8-year low. US chose to leave Chinese tariffs in place to enforce
  trade deal
▪ Monetary policy: Fed rates unchanged, but lowers “dot plot” from 2 hikes in 2019 to zero. Canada
  rates unchanged at +1.75% (shifts from hawkish stance). ECB flipped back into easing mode just 2
  months after ending 4 years of QE
▪ Retail: US store closings reached 5,924, greater than 2018's full year number of 5,325. Tesla decided
  to close its stores, but then changed its mind. Bed Bath & Beyond rebounded >20% on news three
  activists were looking to replace the entire board
▪ Property: RFR / Austrian Signa reportedly bought NYC’s Chrysler Building for $150m, 81% below the
  price it last traded at after the ground lease rent ballooned
▪ Asia: Tokyo Feb office vacancies fall to 1.78%. Japan’s regional residential land prices were up 0.2% in
  2018 YoY, first time in 27 years. India got its 1st REIT, Embassy Office Parks

  Sources: Bank of America Merrill Lynch, Bloomberg LLC, March 2019

  Sugi Capital Management Inc.                                                                     5
US FED HAS BEEN IN TIGHTENING MODE…

 US FED – BALANCE SHEET AS A % OF GDP AND EFFECTIVE FED FUNDS RATE
3.00%
                                                                                                                                      Trump said April 5 the Fed               25.0%
                                                                                                                                    should cut interest rates and
                                                                                                                                     undertake another round of
                                                                                                                                          quantitative easing (!)              24.0%
2.50%

                                                                                                                                                                               23.0%
2.00%

                                                                                                                                                                               22.0%
                        US Federal Funds Effective Rate (LHS)
1.50%

                        US Fed Balance Sheet as a % of GDP (RHS)                                                                                                               21.0%

1.00%
                                                                                                                                                                               20.0%

0.50%
                                                                                                                                                                               19.0%

0.00%                                                                                                                                                                          18.0%
        10/1/2015

                    1/1/2016

                               4/1/2016

                                          7/1/2016

                                                     10/1/2016

                                                                 1/1/2017

                                                                            4/1/2017

                                                                                       7/1/2017

                                                                                                  10/1/2017

                                                                                                              1/1/2018

                                                                                                                         4/1/2018

                                                                                                                                         7/1/2018

                                                                                                                                                    10/1/2018

                                                                                                                                                                1/1/2019
Source: Bloomberg, LLC, April 1, 2019

Sugi Capital Management Inc.                                                                                                                                               6
…WHILE EUROPE AND JAPAN REMAIN LOOSE

 BANK OF JAPAN AND EUROPEAN CENTRAL BANK – BALANCE SHEET AS A % OF GDP
 110.0%

 100.0%

   90.0%

   80.0%                                                                                                                                                                     Bank of Japan Balance Sheet as a % of GDP
   70.0%
                                                                                                                                                                             European Central Bank Balance Sheet as a % of GDP
   60.0%

   50.0%

   40.0%

   30.0%

   20.0%
                         11/1/2014

                                                                                            11/1/2015

                                                                                                                                                               11/1/2016

                                                                                                                                                                                                                                  11/1/2017

                                                                                                                                                                                                                                                                                                     11/1/2018
                                                                                                                                                                                                 5/1/2017

                                                                                                                                                                                                                                                         3/1/2018

                                                                                                                                                                                                                                                                                                                 1/1/2019
              9/1/2014

                                     1/1/2015
                                                3/1/2015
                                                           5/1/2015
                                                                      7/1/2015
                                                                                 9/1/2015

                                                                                                        1/1/2016
                                                                                                                   3/1/2016
                                                                                                                              5/1/2016
                                                                                                                                         7/1/2016
                                                                                                                                                    9/1/2016

                                                                                                                                                                           1/1/2017
                                                                                                                                                                                      3/1/2017

                                                                                                                                                                                                            7/1/2017
                                                                                                                                                                                                                       9/1/2017

                                                                                                                                                                                                                                              1/1/2018

                                                                                                                                                                                                                                                                    5/1/2018
                                                                                                                                                                                                                                                                               7/1/2018
                                                                                                                                                                                                                                                                                          9/1/2018

                                                                                                                                                                                                                                                                                                                                3/1/2019
Source: Bloomberg, LLC, April 1, 2019

Sugi Capital Management Inc.                                                                                                                                                                                                                                                                                                7
A “RISING INTEREST RATE ENVIRONMENT”?

GLOBAL 10-YEAR BOND YIELDS (%)
    3.50%

    3.00%

    2.50%
                                               US
    2.00%
                                               Germany                        Despite pundits’ declarations of a
                                                                              “rising interest rate environment,”
    1.50%                                      Japan
                                                                              long-term yields have fallen in the
                                                                              three largest sovereign markets
    1.00%

    0.50%

    0.00%
         10/1/2018                 11/1/2018           12/1/2018   1/1/2019   2/1/2019           3/1/2019

   -0.50%
 Source: Bloomberg, LLC, April 1, 2019

Sugi Capital Management Inc.                                                                                        8
US TERM PREMIUM DROPS BELOW ZERO

US YIELD SPREAD: 10-YEAR – 3-MONTH (IN BP)
 120

 100

  80

  60
                                                                                      US yield
                                                                                        curve
  40                                                                                  actually
                                                                                      inverted
  20

    -
  10/1/2018                11/1/2018     12/1/2018   1/1/2019   2/1/2019   3/1/2019     4/1/2019

 (20)

 Source: Bloomberg, LLC, April 1, 2019

Sugi Capital Management Inc.                                                                   9
GLOBAL DEBT GROW TH LEVELS OFF

                   The pace of growth in global debt
                   slowed in 2018, while borrowing
                   by U.S. nonfinancial corporates
                   approached record levels

Source: Institute of International Finance, March 22, 2019

Sugi Capital Management Inc.                                 10
GLOBAL PROPERT Y MARKETS IN 2019

Investment
 While investment activity showed signs of leveling off at the end of 2018, investors have indicated plans to
  increase their capital commitment to commercial real estate in 2019, with the United States, Germany, and
  Canada leading the way (Deloitte, 2019 Commercial Real Estate Outlook)
 Nontraditional assets (e.g. student housing, manufactured housing, single-family rentals) and business
  models (e.g. flexible leases and spaces) likely to increase in popularity
 Commercial real estate investors in the US are shifting their attention from smaller cities to refocus on major
  markets, a pull-back to perceived stability and lower risk amid expectations that economic growth is set to
  slow (Jones Lang Lasalle, Commercial Real Estate Investment Trends & Outlook, February 2019)
Sectors
 Growth is slowing across asset classes, but some sectors affected more than others
 Retail is the most challenged sector globally. 2019 could be the year when we see the true impact of e-
  commerce on real estate demand and pricing (even worse than 2018)
 While retail struggles, industrial is cruising in its wake. E-commerce continues to drive demand for logistics
  space and investors continue to increase allocations to the sector, driving prices to all-time highs
 Office sector is undergoing a structural upheaval (e.g. co-working) which will continue in 2019 and beyond
 Steady multifamily demand continues to drive up rents. Millennials continue to embrace city living
Risks
 Trade, Recession
  Sugi Capital Management Inc.                                                                             11
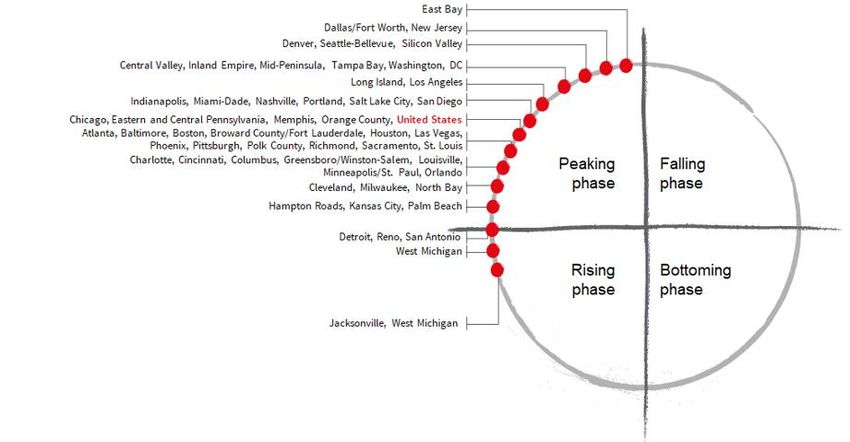
INVESTORS LOOKING LONGER TERM

TIME HORIZON FOR INVESTING, US REAL INSTITUTIONAL REAL ESTATE INVESTORS

                                                                                             Nearly 30% now have
                                                                                             a time horizon of 10
                                                                                             years or more

  Source: PWC and Urban Land Institute, Emerging Trends in Real Estate® 2019, January 2019
  Sugi Capital Management Inc.                                                                                      12
GLOBAL CITIES’ PROSPECTS VARY

GLOBAL CITIES’ GDP, INVESTMENT VOLUMES, AND PRICING COMPARISON
                  Year over year 2017-2018   2018   Year over year 2017-2018   2018

  Source: JLL, January 2019

 Sugi Capital Management Inc.                                                         13
GLOBAL CRE INVESTMENT VOLUMES PEAKING?

                               After a record 2018, there were signs in the final quarter that demand is
                               softening; investment and leasing volumes were lower than the previous
                                                year, and this trend appears likely to continue into 2019

Source: JLL, January 2019

Sugi Capital Management Inc.                                                                           14
GLOBAL OFFICE RENTS TOPPING OFF

Source: JLL, January 2019

Sugi Capital Management Inc.      15
INDUSTRIAL MARKET STILL IN HIGH GEAR

Source: JLL, January 2019

Sugi Capital Management Inc.           16
COMMERCIAL PROPERT Y PRICES FLATTENING…

GREEN STREET CPPI, 1999-APRIL 2019
   140.0

   120.0

   100.0

    80.0

    60.0
                                                                                                                    Green Street’s Commercial Property Price Index (CPPI) is a time series of
                                                                                                                    unleveraged U.S. commercial property values that captures the prices at
    40.0
                                                                                                                    which commercial real estate transactions are currently being negotiated
                                                                                                                    and contracted. Features that differentiate this index are its timeliness, its
    20.0                                                                                                            emphasis on high-quality properties, and its ability to capture changes in
                                                                                                                    the aggregate value of the commercial property sector.
      0.0
                                                                                                       2006-01-01

                                                                                                                                                                          2011-01-01
            1999-01-01

                         2000-01-01

                                      2001-01-01

                                                   2002-01-01

                                                                2003-01-01

                                                                             2004-01-01

                                                                                          2005-01-01

                                                                                                                      2007-01-01

                                                                                                                                   2008-01-01

                                                                                                                                                2009-01-01

                                                                                                                                                             2010-01-01

                                                                                                                                                                                       2012-01-01

                                                                                                                                                                                                    2013-01-01

                                                                                                                                                                                                                 2014-01-01

                                                                                                                                                                                                                              2015-01-01

                                                                                                                                                                                                                                           2016-01-01

                                                                                                                                                                                                                                                        2017-01-01

                                                                                                                                                                                                                                                                     2018-01-01

                                                                                                                                                                                                                                                                                  2019-01-01
Source: Green Street Advisors, April 4, 2019

Sugi Capital Management Inc.                                                                                                                                                                                                                                                      17
…BUT SECTORS CONTINUE TO DIVERGE

RCA CPPI, 2007-2018
  180

  160               The Real Capital Analytics (RCA) Commercial Property Price Indices (RCA
                    CPPI™) are a suite of price indices developed and published by Real Capital
  140               Analytics. They are transaction-based and accurately measure commercial
                    real estate price movements using repeat-sales regression methodology.
  120

  100

    80

    60

    40
         12/2006

                    12/2007

                               12/2008

                                          12/2009

                                                    12/2010

                                                                 12/2011

                                                                           12/2012

                                                                                     12/2013

                                                                                               12/2014

                                                                                                          12/2015

                                                                                                                    12/2016

                                                                                                                              12/2017

                                                                                                                                        12/2018
                   Apartment             Retail           Industrial         Office - CBD           Office - Suburban         Office
Source: RCA, February 2019

Sugi Capital Management Inc.                                                                                                                      18
MOST LISTED REAL ESTATE MARKETS STILL
   TRADING AT DISCOUNT TO NAV
PREMIUM/DISCOUNT TO NAV (%), BY COUNTRY
 40.00
 30.00
 20.00
 10.00
   0.00
 -10.00
 -20.00
 -30.00
 -40.00
 -50.00
                                               Japan

                                                       Singapore

                                                                                  United Kingdom

                                                                                                                                       Netherlands
                                    Malaysia

                                                                                                   Spain

                                                                                                           Ireland
              Belgium

                                                                            USA

                                                                                                                     Mexico

                                                                                                                              France
                                                                   Canada

                                                                                                                                                                    Hong Kong

                                                                                                                                                                                Italy
                        Australia

                                                                                                                                                     South Africa
  Source: S&P Global, April 4, 2019

  Sugi Capital Management Inc.                                                                                                                                                          19
OFFICE AND RETAIL REITS ARE STILL
  CHEAPEST
PREMIUM/DISCOUNT TO NAV (%), BY SECTOR, US REITS

     30.00
                                                                                                        Prem/Disc to NAV (%)                            Industry Median
     20.00

     10.00

      0.00

    -10.00

    -20.00

    -30.00

    -40.00
                                                                                  Casino

                                                                                                                            Diversified

                                                                                                                                                               Office
                                                    Other Retail

                                                                   Self-Storage
                  Manufactured home

                                      Health Care

                                                                                           Industrial

                                                                                                                                          Specialty

                                                                                                                                                                          Shopping Center
                                                                                                              Multifamily

                                                                                                                                                                                            Regional Mall
                                                                                                                                                      Hotel
 Source: S&P Global, April 4, 2019

 Sugi Capital Management Inc.                                                                                                                                                                               20
CLOSING THOUGHTS

▪ Market risks dissipated as the calendar turned to 2019
    ▪ Nearly all asset classes bounced back, including REITs
    ▪ Equities, including real estate equities, performed best
    ▪ Bonds lagged equities and commodities but still delivered positive returns
▪ Central banks’ tunes changed
    ▪ US Fed turned slightly more dovish
    ▪ ECB U-turned on QE to support European economies
▪ Yield curve inverted, causing some to worry about a recession
▪ Global REIT markets rising and falling in sync despite divergence in physical markets
    ▪ Industrial and residential performing well operationally, while retail and office grind through secular changes
    ▪ Niche asset classes continue to fare well
    ▪ Regional market performance very highly correlated
    ▪ Market pricing suggests that the market is not appreciating REIT subtleties such as asset quality, balance sheet,
      management, size, growth, location, and risks
 Growing pricing discrepancies between the public and private markets = opportunities for investors
  that invest in both
  Sugi Capital Management Inc.                                                                                     21
THANK YOU!

       For more information, contact us at:

       info@sugicapital.com

Sugi Capital Management, Inc.
Sugi Capital Management Inc.
You can also read