Knoll, Inc. Third Quarter 2018 Investor Presentation - Andrew Cogan, Chairman, President & CEO Charles Rayfield, SVP & CFO - Investor Relations
←
→
Page content transcription
If your browser does not render page correctly, please read the page content below

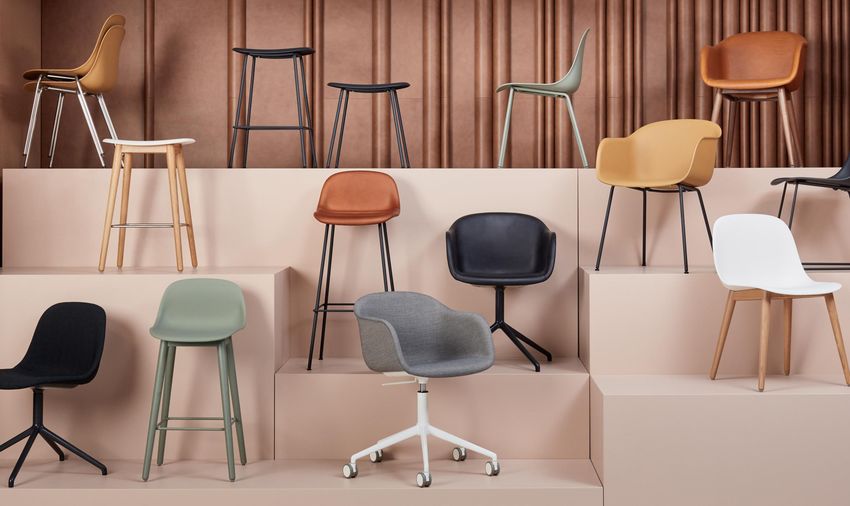
Knoll, Inc.
  Third Quarter 2018 Investor Presentation

  Andrew Cogan, Chairman, President & CEO      Hospitality at Work:
  Charles Rayfield, SVP & CFO                Knoll at NeoCon 2018
© 2018 Knoll Inc.                                                     1
Forward-Looking Statements/Non-GAAP Measures
     This presentation includes forward-looking statements within the meaning of Section 27A of the Securities Act of 1933, as
     amended, and Section 21E of the Securities Exchange Act of 1934, as amended. All statements regarding Knoll, Inc.’s
     expected future financial position, results of operations, revenue and profit levels, cash flows, business strategy, budgets,
     projected costs, capital expenditures, products, competitive positions, growth opportunities, plans and objectives of
     management for future operations, as well as statements that include words such as "anticipate," "if," "believe," "plan,"
     “goals," "estimate," "expect," "intend," "may," "could," "should," "will," and other similar expressions are forward-looking
     statements. This includes, without limitation, our statements and expectations regarding any current or future recovery in our
     industry, Muuto integration and performance, our supply chain optimization activities, and our expectations with respect to
     leverage. Such forward-looking statements are inherently uncertain, and readers must recognize that actual results may differ
     materially from the expectations of Knoll management. Knoll does not undertake a duty to update such forward-looking
     statements. Factors that may cause actual results to differ materially from those in the forward-looking statements include
     corporate spending and service-sector employment, price competition, acceptance of Knoll’s new products, the pricing and
     availability of raw materials and components, foreign exchange rates, transportation costs, demand for high quality, well
     designed furniture and coverings solutions, changes in the competitive marketplace, changes in trends in the market for
     furniture or coverings, the financial strength and stability of our suppliers, customers and dealers, access to capital, our
     success in designing and implementing our new enterprise resource planning system, our ability to successfully integrate
     acquired businesses, our ability to plan and implement supply chain optimization projects, and other risks identified in Knoll’s
     Annual Report on Form 10-K, and other filings with the Securities and Exchange Commission, as well as other cautionary
     statements that are made from time-to-time in Knoll’s public communications. Many of these factors are outside of Knoll’s
     control.

     This presentation also includes certain non-GAAP financial measures. A “non-GAAP financial measure” is a numerical
     measure of a company’s financial performance that excludes or includes amounts so as to be different than the most directly
     comparable measure calculated and presented in accordance with U.S. generally accepted accounting principles (“GAAP”).
     We present Non-GAAP measures because we consider them to be important supplemental measures of our performance
     and believe them to be useful to display ongoing results from operations distinct from items that are infrequent or not
     indicative of our operating performance. We have provided reconciliations of these non-GAAP financial measures to the
     most directly comparable GAAP measure in the presentation below.

     These non-GAAP measures are not indicators of our financial performance under GAAP and should not be considered as an
     alternative to the applicable GAAP measure. These non-GAAP measures have limitations as analytical tools, and you should
     not consider them in isolation or as a substitute for analysis of our results as reported under GAAP. Our presentation of
     these non-GAAP measures should not be construed as an inference that our future results will be unaffected by unusual or
     infrequent items.

© 2018 Knoll Inc.                                                                                                                       2
Knoll is:
A constellation of design-driven
brands and people, working
together with our clients to
create inspired modern
interiors.

Knoll’s reputation for iconic design, leadership, quality and
  innovation in both the workplace and residential markets
  is recognized globally

                    1938
                           80                        2018

© 2018 Knoll Inc.                                                 4
Investment Rationale

  ›     Improving macro environment with
        decreasing headwind from legacy
        products helping drive sales

  ›     Lean opportunities to drive
        Office margins higher

  ›     Strong track record of successful
        acquisitions; Muuto expected to be
        immediately accretive to both
        margins and EPS

  ›     Significant benefit from lower
        tax rates for both clients and
        Knoll

  ›     Driven and motivated
        management team aligned
        with shareholder objectives

© 2018 Knoll Inc.                            5
Four strategic imperatives drive our strategy

  ›     Target underpenetrated and
        emerging ancillary categories
        and markets for growth

  ›     Expand our reach into
        residential and decorator
        channels around the world

  ›     Maximize office segment
        profitability and growth

  ›     Leverage technology to expand
        our market visibility and
        improve our efficiency

© 2018 Knoll Inc.                                 6
Knoll brands span commercial and residential applications
  with high design opportunities, and are heavily influenced
  by architect and designer specifiers

                          Luxury
                                                                                       HOLLY HUNT
                                                                               Edelman

                                                                      KnollStudio                                  • Favorable demographics

                                                                                                                   • High margin opportunities
                                                  DatesWeiserKnollTextiles
                                       Spinneybeck                                                                 • Fragmented competitors
              Affordable luxury           FilzFelt                      Muuto

    • Changing work style
                                                       Knoll Office
    • Resimercial aesthetic
                                                                                                    - Residential product
    • Global capability                     KnollExtra
                                                                                                    - Hybrid product
                                                                                                    - Commercial product
                    Accessible

                                   Commercial                                                       Residential

                                   $73B Global Commercial Market                         $266B Global Residential Market
                                   • $8B luxury                                          • $9B luxury
                                   • $11B affordable luxury                              • $17B affordable luxury
                                   ~$18.5B North American Market
                                   Sources: Based on Knoll, Inc. and BIFMA estimates
© 2018 Knoll Inc.                                                                                                                                7
We have a singular line-up of brands and offerings from
  high-performance workplace to “resimericial” ancillary…

Knoll Office

DatesWeiser         KnollStudio               Muuto Ancillary Offering
© 2018 Knoll Inc.                                                        8

…and from uber-luxury living spaces to affordable luxury
  for the home

HOLLY HUNT | Vladimir Kagan   KnollStudio LA Home Design Shop

Muuto

© 2018 Knoll Inc.                                               9

Through both organic product development and M&A we
  are shifting the mix of our sales and profits out of Office

                                                                Q2 2018 Net Sales                                        Q2 2018 Adjusted
          Q2 2018 Net Sales                                      by Geography                                                EBITDA

                                                                         22%

                                                                                       78%

                                                                   USA             Rest of World

        Note: Adjusted EBITDA is a non-GAAP financial measure. For a reconciliation of Operating Profit to Adjusted EBITDA by segment, see page 30.

© 2018 Knoll Inc.                                                                                                                                     10
As Office clients rethink their priorities, we see a major
inflection point in workplace design, creating new
challenges and opportunities for Knoll
Primary
Primary Activity Client Space Allocation Activity
Individual Group
Formal Casual
Corporate / commercial aesthetic Residential aesthetic
Dedicated Shared
One Size Fits All Competition for Talent
Fixed Mobile / Adjustable
$1M+ projects Small to mid size projects
© 2018 Knoll Inc. 11Solving ancillary is critical for maintaining our position as
a market leader and fueling growth
Estimated share of wallet1 Estimated Market share2
2015 Knoll Dealers 2016 Industry ~$18.3B3
Workstations Ancillary Workstations Ancillary
(Primary Spaces) (Activity) (Primary Spaces) (Activity)
workplace ±90% ±10% workplace ±7% ±1%
1 ±50% combined share of wallet based on major project 2 ±4% combined market share, Knoll Estimate
review and reported Dealer value 3 Preliminary BIFMA 2016 estimate
© 2018 Knoll Inc. 12With the acquisition of Muuto, Knoll brands now span the
workplace market
WORKPLACE FURNITURE MARKET SEGMENTATION
Ancillary ≥ $8.5B1 Workstations ≤ $8.5B1
HOLLY HUNT
Luxury DatesWeiser
KnollStudio
Affordable luxury Knoll Office
Muuto
Accessible
Cheap
Residential (~$1B) Crossover Contract
• Limited durability & • Residential/hospitality • Aesthetic & function specific to workplace setting
warranty in sensibility; appropriate for • 10+ years durability and warranty
commercial setting commercial use
• Payment at order • ±5 yrs warranty
Note: Brand positions are directional. 1. BIFMA estimates the 2016 NA contract furniture industry at approximately $18.5B. Included in this estimate is approximately $2.5B related to
BIFMA Specialty (non-office products) which Knoll has excluded from the above analysis. Furthermore, approximately $1B of residential furniture sold into the workplace market (Knoll
Estimate) has been added to the above analysis.
© 2018 Knoll Inc. 13Muuto Expansion Strategy
We plan to more than double the size of Muuto over the next 3-5 years
1• North America: Massive upside to
~$15M sales today by leveraging
Knoll client base, architect and
designer relationships, and contract
and residential distributors
• NA dealer and showroom rollout
Muuto to be completed by end of Q3
2017A: • Already seeing strong dealer
uptake and meaningful
$71M Sales
penetration of Knoll corporate
$19M Adjusted EBITDA clients
2• Europe: Introduce Muuto to Knoll
1 residential distribution and
corporate clients
2
3• Product: Scale product scope
3
Sales & EBITDA growth >2X
Note: Adjusted EBITDA is a non-GAAP financial measure. For a reconciliation of Net Earnings to Adjusted EBITDA, see page 28.
© 2018 Knoll Inc. 14YTD Q2 2018 sales of newer workplace platforms exceeded those of legacy systems and storage © 2018 Knoll Inc. 15
Industry indicators are favorable
                          Corporate Profits increased in Q1                                            CEO Confidence declined slightly in Q2
                             % Change from Prior Year Quarter                                                          CEO Confidence Index

           25.00%                                                                               80
           20.00%
                                                                                                70
           15.00%
           10.00%
                                                                                                60
             5.00%
             0.00%                                                                              50
                         2014           2015           2016          2017     2018
           (5.00)%
                                                                                                40
         (10.00)%
         (15.00)%                                                                               30
         (20.00)%                                                                                     2014          2015      2016         2017       2018

                          Source: Bureau of Economic Analysis as of Q1 2018                                     Source: Chief Executive Magazine

                                Architectural Billings trending up                                      Net absorption trending down slightly
                                              ABI Billing Index                                                      Annual Net Absorption (sf)
                    60
                                                                                                 60
                                                                                                 55
                    55
                                                                                                 50
                                                                                     Millions    45
                    50
                                                                                                 40
                    45                                                                           35
                                                                                                 30
                    40                                                                           25
                         2014          2015           2016          2017      2018                           2014      2015        2016        2017   TTM Q2-18

                                 Source: American Institute of Architects                                                       Source: JLL

© 2018 Knoll Inc.                                                                                                                                                 16
Investments made in 2017 are paying off with a strong first
half of 2018, demonstrating both top and bottom line growth
Sales Growth YoY – ($ Millions) Adjusted Gross Profit ($ Millions) and %
$446 $447
$413 $415
$372
+17% +20%
35.4% 37.4% 38.3% 36.6% 36.4%
a/
a/
2014 2015 2016 2017 TTM 18
Adjusted EBITDA ($ Millions) and % Adjusted Diluted Earnings Per Share
$1.72
$1.55 $1.57
$1.42
+39% $1.11
+41%
a/ a/
2014 2015 2016 2017 TTM 18
a/ Represents the trailing twelve months as of June 30, 2018.
Note: Adjusted Gross Profit, Adjusted Gross Profit Percentage, Adjusted EBITDA, Adjusted EBITDA Percentage, and Adjusted EPS are non-GAAP financial measures.
For a reconciliation of Gross Profit and Gross Profit Percentage to Adjusted Gross Profit and Adjusted Gross Profit Percentage, Net Earnings and Net Earnings
Percentage to Adjusted EBITDA and Adjusted EBITDA Percentage, see page 27, for a reconciliation of GAAP EPS to Adjusted EPS, see page 30.
© 2018 Knoll Inc. 17Strong organic growth in Q2 2018 driven by favorable mix in
newer workplace models, as well as the addition of Muuto
#REF!
Q2 18 Q2 17 B / (W)
Actual Actual vs. Prior Year
Net Sales $ 323.4 $ 268.7 $ 54.7 20.3%
Adjusted Gross Profit 120.2 100.0 20.2 20.2%
Adjusted Gross Profit % 37.2% 37.2% 0 bps
Adjusted Operating Expenses 89.6 77.3 (12.3) (15.9)%
Adjusted Operating Profit 30.6 22.7 8.0 35.1%
Adjusted Operating Profit % 9.5% 8.4% 110 bps
Adjusted EBITDA $ 42.1 $ 32.3 $ 9.8 30.4%
Adjusted EBITDA % 13.0% 12.0% 100 bps
Adjusted Diluted EPS $0.42 $0.30 $ 0.12 40.0%
Note: Adjusted Gross Profit, Adjusted Gross Profit Percentage, Adjusted Operating Expenses, Adjusted Operating Profit and Adjusted
Operating Profit Percentage, Adjusted EBITDA and Adjusted EBITDA Percentage, and Adjusted Diluted EPS are non-GAAP financial
measures. For a reconciliation of Adjusted Gross Profit and Adjusted Gross Profit Percentage to GAAP Gross Profit and Gross Profit
Percentage, see page 25, GAAP Operating Expenses to Adjusted Operating Expenses, see page 26, GAAP Operating Profit and GAAP
Operating Profit Percentage to Adjusted Operating Profit and Adjusted Operating Profit Percentage, see page 25, Net Earnings to Adjusted
EBITDA and Adjusted EBITDA Percentage, see page 28 and EPS to Adjusted Diluted EPS, see page 26.
© 2018 Knoll Inc. 18Q2 2018 Results by Segment vs. Prior Year
($ in millions)
Net Sales (millions) Adjusted EBITDA (millions)
+ New products + Muuto
+ Volume + Muuto
+ Sales initiatives + Europe – Large
projects - Inflation + Europe Studio –
Sales volume
+ DatesWeiser – Ford - Price
Foundation project + DatesWeiser – Sales
- OPEX
volume
+ FX investments
- NA Studio
+20.3% +30.4%
** **
+17.3% +22.5%
**
+25.0% +37.2%
**
100 bps 130 bps (50) bps
Note: Adjusted EBITDA excludes unallocated corporate adjusted EBITDA of ($3.6M) in Q2 2017 and ($3.7M) in Q2 2018.
**Amounts in red including Muuto
Note: Adjusted EBITDA is a non-GAAP financial measures. For a reconciliation of GAAP Operating Profit to Adjusted EBITDA by segment, see page 30.
© 2018 Knoll Inc. 19Muuto contribution will offset inflation, efficiency initiatives
and price increases will drive margin growth
› Continuous improvement activities were steady during 2017 and continued through Q2 2018, and largely offset
inflationary pressure
› Pricing pressure intensified in the 4th quarter of 2017 and was partially alleviated by price increases in Q1 2018
› Muuto added additional volume and favorable margin mix in Q1 & Q2 2018, contributing to overall margin
increases over prior quarter
© 2018 Knoll Inc. 20“Less is More” Bringing Lean to Knoll
We are implementing a culture of continuous improvement Lean across Knoll
› Driving out waste and inefficiency
› Engaging our manufacturing associates
› Process and productivity improvement
› Commencement of supply chain optimization study
Recycled Content
Lean Initiatives
Waste and Landfill Safety Incident Rate
© 2018 Knoll Inc. 21Historical trends demonstrate our ability to reduce overall
leverage
Bank Net Leverage Ratio(1) Bank Debt ($ in millions)(2)
$533
$501
3.21
3.12
2.91
2.41
2.23
$290
$276
1.67
$239 $232
1.37 1.37
$197
$179
YE-2013 Q1-2014 YE-2014 YE-2015 YE-2016 YE-2017 Q1-2018 Q2-2018 (3)
YE-2013 Q1-2014 YE-2014 YE-2015 YE-2016 YE-2017 Q1-2018 Q2-2018
(1) For details on the calculation of the Bank Net Leverage Ratio, see
(2) Includes bank debt, outstanding letters of credit, and guarantee obligations.
page 29. The 2018 bank net leverage ratio’s incorporate TTM Adjusted
(3) Bank debt of $496M and outstanding letters of credit of $5M
EBITDA for Muuto.
› As of June 30, 2018 the $496M of bank debt is comprised of: ($155M revolver and $341M term loan)
› $402M USD
› €81M EURO, $94M in USD
› Executed a $300M, 1 year forward swap contract on LIBOR based debt
› Fixed LIBOR rate of 2.63% beginning Jan 1, 2019
› Hedged amount amortizes by $50M each calendar year
© 2018 Knoll Inc. 22And we continue to return cash to shareholders through
dividends and buybacks
$41.2
$30.3
$33.1 $34.7 $34.8
$31.7
$29.2 $30.0
$24.4
$22.7
Dividends
($ millions)
Shares Repurchases
$10.9
$9.0 $8.7
$5.5
$4.8
2014 2015 2016 2017 TTM 2018
© 2018 Knoll Inc. 23Thank You © 2018 Knoll Inc. 24
Reconciliation of Non-GAAP Results
                                                                                                         Q2 2018                   Q2 2017

                                         Operating profit ($mm)                                    $           24.8            $         19.9

                                         Add back (deduct):

                                             Acquisition related inventory adjustment                            0.9                          -
                                                                               (1)
                                             Acquisition related expenses                                        4.1                      0.6
                                             Restructuring charges                                               0.8                      2.2

                                         Adjusted operating profit                                 $           30.6            $         22.7
                                         Net Sales ($mm)                                           $          323.4            $       268.7
                                         Adjusted operating profit %                                           9.5%                      8.4%
      (1) Acquisition related expenses in the second quarter of 2018 includes amortization of intangible assets recognized in connection with business combinations of $2.1 million, in addition
      to retention agreements for key employees and other customary acquisition related expenses. Acquisition related expenses in the second quarter of 2017 represent amortization of
      intangible assets recognized in connection with business combinations.

                                                                                                         Q2 2018               Q2 2017

                                               Gross profit ($mm)                                    $        119.3        $          100.0

                                               Add back:

                                                      Acquisition related inventory adjustment                   0.9                     -

                                               Adjusted gross profit                                 $        120.2        $          100.0
                                               Net sales ($mm)                                       $        323.4        $          268.7

                                               Adjusted gross profit %                                        37.2%                   37.2%

© 2018 Knoll Inc.                                                                                                                                                                                  25
Reconciliation of Non-GAAP Results
Q2 2018 Q2 2017
Operating expenses ($mm) $ 94.5 $ 80.1
Less:
(1)
Acquisition related expenses 4.1 0.6
Restructuring charges 0.8 2.2
Adjusted Operating Expenses $ 89.6 $ 77.3
(1) Acquisition related expenses in the second quarter of 2018 includes amortization of intangible assets recognized in connection with business combinations of $2.1 million, in addition
to retention agreements for key employees and other customary acquisition related expenses. Acquisition related expenses in the second quarter of 2017 represent amortization of
intangible assets recognized in connection with business combinations.
Q2 2018 Q2 2017
Diluted earnings per share $ 0.27 $ 0.26
Add back:
Pension settlement 0.09
Acquisition related expenses 0.08 0.01
Restructuring charges 0.02 0.04
Acquisition related inventory adjustment 0.02
Less:
Tax effect on non-GAAP adjustments 0.06 0.01
Adjusted diluted earnings per share $ 0.42 $ 0.30
© 2018 Knoll Inc. 26Reconciliation of Non-GAAP Results
Years Ended December 31,
2014 2015 2016 2017 TTM 2018
Net earnings ($mm) $ 46.6 $ 66.0 $ 82.1 $ 80.2 $ 80.3
Add back:
Income tax (benefit) expense 29.2 37.5 45.4 (1.6) (4.2)
#VALUE!
Interest expense 7.4 6.9 5.4 7.5 $ 14.8
-
Depreciation and amortization 19.3 20.5 22.4 26.1 30.6
EBITDA $ 102.5 $ 130.9 $ 155.3 $ 112.2 $ 121.5
Add back:
(1)
Non-cash items and other 11.9 12.5 13.4 32.3 37.4
Adjusted EBITDA $ 114.4 $ 143.4 $ 168.7 $ 144.5 $ 158.9
Net sales ($mm) $ 1,050.3 $ 1,104.4 $ 1,164.3 $ 1,132.9 $ 1,227.3
Adjusted EBITDA % 10.9% 13.0% 14.5% 12.8% 12.9%
(1) - Non-cash and other items include, but are not limited to, asset impairment charge, pension settlement and other postretirement benefit curtailment, stock-based compensation
expenses, unrealized gains or losses on foreign exchange, restructuring charges, and acquisition related expenses
Years Ended December 31,
2014 2015 2016 2017 TTM 2018
Gross profit ($mm) $ 371.7 $ 412.1 $ 446.0 $ 414.6 $ 445.9
Add back:
Seating product discontinuation charge 0.9
Acquisition related inventory adjustment 0.9
Adjusted gross profit $ 371.7 $ 413.0 $ 446.0 $ 414.6 $ 446.8
Net sales ($mm) $ 1,050.3 $ 1,104.4 $ 1,164.3 $ 1,132.9 $ 1,227.3
Adjusted gross profit % 35.4% 37.4% 38.3% 36.6% 36.4%
© 2018 Knoll Inc. 27Reconciliation of Non-GAAP Results
Q2 2018 Q2 2017
Net earnings ($mm) $ 13.1 $ 12.9
Add back:
Income tax (benefit) expense 4.6 7.2
Interest expense 5.3 1.9
Depreciation and amortization 8.7 6.4
EBITDA $ 31.7 $ 28.4
Add back:
Stock compensation 2.1 1.7
Acquisition related expenses 2.0 -
Acquisition related inventory adjustment 0.9 -
Pension settlement charge 4.6 -
Restructuring charges 0.8 2.2
Adjusted EBITDA $ 42.1 $ 32.3
Net sales ($mm) $ 323.4 $ 268.7
Adjusted EBITDA % 13.0% 12.0%
2017
Muuto
Net earnings ($mm) $ 8.9
Add back:
Income tax (benefit) expense 4.3
Interest expense 0.6
Depreciation and amortization 0.6
EBITDA $ 14.5
Add back: -
Acquisition costs 4.6
Other non-cash items 0.3
Adjusted EBITDA $ 19.4
Net sales ($mm) $ 71.3
Adjusted EBITDA % 27.2%
Note: Per the 8-K/A, filed with the Securities and Exchange Commission on April 12, 2018, 2017 Muuto net earnings were reported as 58.9M DKK and Muuto net
sales were reported as 470.1M DKK. These figures were converted to USD using an exchange rate of 0.1516
© 2018 Knoll Inc. 28Reconciliation of Non-GAAP Results
12/31/13 3/31/14 12/31/14 12/31/15 12/31/16 12/31/17 3/31/18 6/30/18
(1) (1) (1) (1) (1) (1) (2) (2)
Debt Levels ($mm) $ 178.8 $ 289.8 $ 275.5 $ 238.7 $ 231.8 $ 197.4 $ 517.8 $ 499.8
a/ b/
LTM Net Earnings ($mm) $ 23.2 $ 25.0 $ 46.6 $ 66.0 $ 82.1 $ 80.2 $ 92.3 $ 89.9
LTM Adjustments
Interest 5.3 5.5 6.7 6.1 4.7 6.8 11.0 14.5
Taxes 15.7 16.0 29.2 37.5 45.4 (1.6) 1.3 (1.9)
Depreciation and Amortization 16.3 16.9 20.0 21.3 23.0 26.7 29.4 31.3
Non-cash Items and Other (3) 19.7 27.0 11.9 12.5 13.4 32.3 31.8 38.1
LTM Adjusted EBITDA $ 80.2 $ 90.4 $ 114.4 $ 143.4 $ 168.7 $ 144.5 $ 165.8 $ 172.0
Bank Net Leverage Calculation (4) 2.23 3.21 2.41 1.67 1.37 1.37 3.12 2.91
(1) - Outstanding debt includes outstanding letters of credit and guarantee obligations. Per the terms of the credit facility filed with the Securities and Exchange Commission on May 21, 2014,
excess cash over $15.0M reduces the outstanding debt.
(2) - Outstanding debt includes outstanding letters of credit and guarantee obligations. Per the terms of the credit facility filed with the Securities and Exchange Commission on January 23, 2018,
cash up to $15.0M reduces the outstanding debt.
(3) - Non-cash and Other items include, but are not limited to, intangible asset impairment charges, pension settlements and other postretirement
benefit curtailment, stock-based compensation expenses, unrealized gains and losses on foreign exchange, restructuring charges, and acquisition related expenses.
(4) - Bank net leverage is calculated by dividing debt by LTM Adjusted EBITDA, as calculated in accordance with our credit facility.
a/ Represents the trailing twelve months as of March 31, 2018 and includes twelve months of Muuto net earnings
b/ Represents the trailing twelve months as of June 30, 2018 and includes twelve months of Muuto net earnings
© 2018 Knoll Inc. 29Reconciliation of Non-GAAP Results
Years Ended December 31,
2014 2015 2016 2017 TTM 2018
Earnings per share - diluted $ 0.97 $ 1.36 $ 1.72 $ 1.67 $ 1.64
Add back:
Intangible asset impairment charge - 0.22 - 0.33 0.33
Pension settlement and OPEB curtailment 0.14 - - 0.04 0.13
Acquisition related expenses 0.02 0.03 - 0.01 0.18
Seating product discontinuation charge - 0.02 - - -
Restructuring charges 0.03 0.02 - 0.04 0.03
Loss on extinguishment of debt - - - - 0.03
- - - - -
Acquisition related inventory adjustment - - - - 0.02
Less:
Tax effect on non-GAAP adjustments 0.05 0.09 - 0.13 0.25
Tax Reform impact - - - 0.54 0.54
Adjusted earnings per share - diluted $ 1.11 $ 1.55 $ 1.72 $ 1.42 $ 1.57
Q2 2017 Q2 2018
Office Lifestyle Corporate Knoll, Inc. Office Lifestyle Corporate Knoll, Inc.
Operating profit ($mm) $ 4.8 $ 20.6 $ (5.5) $ 19.9 $ 10.3 $ 21.0 $ (6.5) $ 24.8
Add back (deduct):
Acquisition related inventory adjustment - - - - - 0.9 - 0.9
(1)
Acquisition related expenses - 0.6 - 0.6 - 3.6 0.5 4.1
Restructuring charges 2.2 - - 2.2 0.8 - - 0.8
Adjusted operating profit / (loss) $ 7.0 $ 21.2 $ (5.5) $ 22.7 $ 11.1 $ 25.5 $ (6.0) $ 30.6
Add back: (2)
Depreciation and amortization 4.6 1.0 0.2 5.8 5.0 1.4 0.2 6.6
- - -
Stock compensation 0.5 0.5 0.7 1.7 0.2 0.5 1.4 2.1
- - -
Other non-cash items 0.9 0.2 1.0 2.1 1.4 0.7 0.7 2.8
Adjusted EBITDA ($mm) $ 13.0 $ 22.9 $ (3.6) $ 32.3 $ 17.7 $ 28.1 $ (3.7) $ 42.1
- - - - - -
Net sales ($mm) $ 162.6 $ 106.1 - $ 268.7 $ 190.8 $ 132.6 - $ 323.4
- - - -
Operating profit % 3.0% 19.4% N/A 7.4% 5.4% 15.8% N/A 7.7%
Adjusted operating profit % 4.3% 20.0% N/A 8.4% 5.8% 19.2% N/A 9.5%
Adjusted EBITDA % 8.0% 21.6% N/A 12.0% 9.3% 21.1% N/A 13.0%
(1) Acquisition related expenses in the second quarter of 2018 includes amortization of intangible assets recognized in connection with business combinations of $2.1 million, in addition to retention agreements for key
employees and other customary acquisition related expenses. Acquisition related expenses in the second quarter of 2017 represent amortization of intangible assets recognized in connection with business combinations.
(2) Depreciation and amortization presented in the table excludes amortization of intangible assets recognized in connection with business combinations. These amortization expenses have been added back as part of the
Acquisition related expenses in the calculation of Adjusted operating profit / (loss), as noted above.
© 2018 Knoll Inc. 30© 2018 Knoll Inc. 31
You can also read