Steve Bachelder Chief Operating Officer - NASDAQ: LAKE September 2016 - Lakeland
←
→
Page content transcription
If your browser does not render page correctly, please read the page content below
NASDAQ: LAKE

   Steve Bachelder
Chief Operating Officer
      September 2016

                       Emerging Markets Exposure…
                           …Western Markets Expertise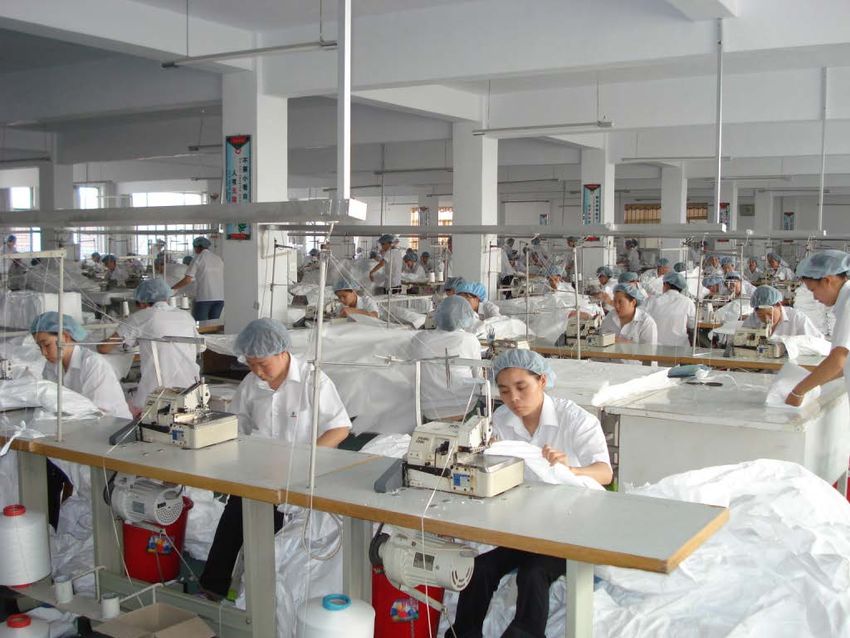
Safe Harbor Statement

With the exception of historical information, the statements set
forth in this presentation include forward-looking statements that
involve risk and uncertainties. The company wishes to caution
that a number of important factors could cause actual results to
differ materially from those forward-looking statements. These
and other factors could cause actual results to differ materially
from those in any forward-looking statements which are discussed
in this presentation. Please see Lakeland Industries’ SEC filings on
Forms 10-K and 10-Q for important information about the
Company and related risks. The Company disclaims any
obligation to update its forward-looking statements.

                                                                       2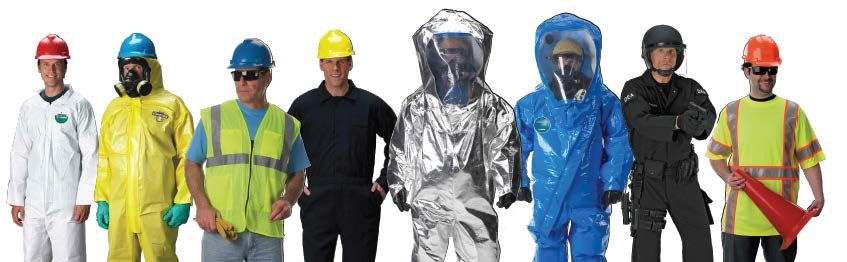
Lakeland At A Glance
• Leading manufacturer of industrial protective clothing
• Serving all major industrial market sectors
   – Chemical/Petrochemical
   – Basic Industry: Auto, Steel, Construction, Electric & Gas Utilities
   – Health Care & Food Chain; High Tech
   – Government, Fire Department, Public Safety, DOD, CDC, DEA, etc.
• In business since 1982 in a stable and growing market
• History: Lost nearly $80 million of annual revenue from DuPont products
  since 2006 and $15 million in Brazil since 2012
• But managed to maintain overall revenues by growing new business
• Driven by world-wide sales and profit growth opportunities
• Positioned for long term growth with strengthened balance sheet and
  significant upside potential

                                                                            3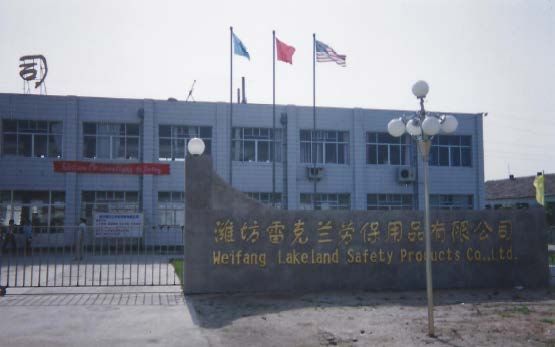
HOBBLED BY PRIOR DEPENDENCE ON
               DUPONT FABRICS & EXIT FROM BRAZIL
               Fiscal Year Sales History: Tyvek/Tychem and Brazil Declines Mask
                          Organic Domestic and International Growth*
($ Millions)
                  $120

                  $100

                    $80

                    $60

                    $40

                    $20

                     $-
                                2006 2007 2008 2009 2010 2011 2012 2013 2014 2015 2016

                               Non-DuPont Items Total Ex-Brazil                  Brazil Sales   DuPont Items Total

           Lost $78M in DuPont sales and $17M in Brazil Sales from 2006-2016
               *Chart shows figures for continuing and discontinued operations                                       4
Financial Issues Through 2015
      Company In A Sharp Turn Around Mode

•   DuPont had squeezed us for five years before terminating license in
    FY 2012.
•   We responded by opening international markets, creating our own
    branded products, and beefing up our sales force.
•   Then in FY 2013 Company got “homered” in a Brazil court case,
    leading to collapse of business there and $34 million in losses, and
    subsequent “Going Concern Opinion” as we lost our lender.
•   One day before loans were to be called in FY 2014, Company was
    able to get new (but expensive) financing, and the “Going Concern
    Opinion” was removed.
•   PIPE common stock issuance for $11.1 million completed in FY
    2015, enabling payoff of high cost debt and remainder of judgement
    in Brazil.
•   Company was then able to exit Brazil in FY 2016 via a local
    management transaction.
                                                                           5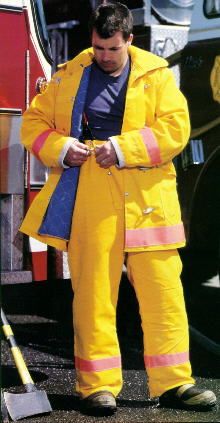
Growth in Operating Profit From
                            Continuing Operations
                                    (Year Ended January 31)

($ Millions)
               $14,000

               $12,000

               $10,000

                $8,000

                $6,000

                $4,000

                $2,000

                   $-
                             2013              2014           2015        2016

                            Operating Profit From Continuing Operations

                                                                                 6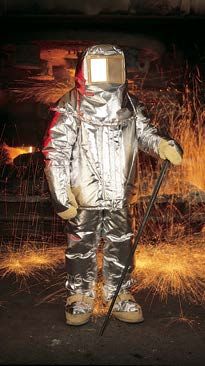
Proof Of Turn Around from FY2014-FY2016
                 Highlights FY 2016 (continuing operations)
        •       Revenue Growth
                • Consolidated sales increased for third consecutive year, despite currency headwinds
                • Revenues driven by organic growth and emergency demand in first three quarters of FY
                    2016 Gross margin for the year was 36.5% compared to 33.9% previous yea

        • Significant Increases in Operating Income, Adjusted EBITDA* and Free Cash Flow
            • Operating income increased to $11.8M from $7.0M previous year
            • As a percentage of sales, increased to 11.9% from 7.5%
            • Free cash flow (adjusted EBITDA less taxes and capital exp.) $10.8M vs. $7.4M

        • Net Income
           • FY 2016 net income of $7.8M declined from $11.1M previous year
           • Decline in net income primarily reflects the income tax benefit in FY 2015 from the
                Brazil worthless stock deduction of approximately $34M for a $9.5M tax credit
                recorded for the Company’s exit from Brazil

        • Balance Sheet Strength
           • FY 2016 vs. FY 2013: total liabilities down by 58%; shareholders equity up by 52%
           • Uses of cash during FY 2016 include payments of arbitration settlement of $3.8M and
               VAT tax liability of $2.3M as part of the Company’s exit from Brazil
*Includes non-GAAP measures and other adjustments – see tables included herein for reconciliations.
                                                                                                      7
Long Term Improvements in Continuing Operations
                                                            Summary of Operations
                                                            Year Ended January 31,
                                                 (in thousands, except share and per share data)
                                                                   2016               2015*              2014*              2013*
Income Statement Data:
Net sales from continuing operations                                   99,646    $        93,419     $      84,173      $       78,260
Operating profit (loss) from continuing operations                     11,812              6,691             4,053                 579
Arbitration judgment in Brazil                                             —                  —                 —              (7,874)
Income (loss) from continuing operations before income taxes           10,907              2,898             2,679             (8,538)
Income tax expense (benefit)                                            3,117             (8,188 )          (2,851 )             4,127
Net income (loss) from continuing operations                            7,790             11,086             5,530            (12,665)
Net income (loss) on discontinued operations net of tax               (3,936)             (2,687 )          (5,650 )          (13,624)

Earnings (loss) per share from continuing operations - basic   $          1.09   $            1.78   $           0.97   $       (2.39)

Earnings (loss) per share from continuing operations – diluted $          1.07   $            1.75   $           0.96   $       (2.39)
Weighted average common shares outstanding
Basic                                                               7,171,965          6,214,303          5,689,230          5,290,332
Diluted                                                             7,254,340          6,325,525          5,771,226          5,290,332
Balance Sheet Data:
Current assets                                                 $       69,655    $        68,635     $      65,481      $      60,605
Total assets                                                           88,260             93,208            80,483             80,051
Current liabilities                                                    19,958             26,222            26,835             27,761
Long-term liabilities                                                     786              3,730             9,171              8,801
Stockholders’ equity                                                   67,516             63,256            44,477             43,489
* Restated for discontinued operations
                                                                                                                                     8
The Company Today:
Positioned for Continued Long Term
Growth in Revenues and Profitability

                                   9
Expanded Product Line
Limited Use/Disposable       Chemical Suits          High Visibility Clothing
  Protective Clothing

         Fire Fighting & Heat Protective
                                              Gloves & Arm Guards
        Apparel/Reusable Woven Garments

                                                                            10
The Right Focus: End-user Segments
for Personal Protective Equipment
Gas Detection
Other
6%
21% Utilities
9%
Petrochemical
10%
Auto
11%
Construction
Metals 10%
8% Transport
Healthcare Pulp & Paper 7%
9% 7%
Lakeland End-user Segments Address Over 55%
of Total Market but the Company Possesses Less Than 1%
Source: Frost & Sullivan Estimates (2014-2015) 11The Right Focus: Personal
Protective Equipment Market
Footwear Gas Detection Head
Fall 13% 6% 2%
4%
Eye Hand
6% 29%
Respiratory
15%
Hearing
Protective Clothing
3%
22%
Lakeland Product Segments Address Over 50% of $23 Billion
Market but the Company Presently Represents Less Than 1% of
the Total Addressable Market (TAM)
Source: Frost & Sullivan Estimates 12Growth Opportunities
Lakeland Target Markets Among Largest and Fastest Growing
High
CAGR for Market Segments
(>6%)
3
2 1 Head/Eye/Face
7 6 5
4 1 2 Respiratory
Medium
(2%-6%) 3 Hand
4 Hearing
5 Prot. Apparel
Low 6 Foot
(0%-2%) 7 Fall Prot.
Small Medium Large
($2.5 Billion)
Market Size of Market Segments
Source: Frost & Sullivan; CAGR is calculated from 2008-2015 13Product Mix
Revenue by Product – Historical Approximation
Homeland Security
Chemical Suits 7%
High Visibility 7%
Glov es & A rm Protection
4%
Fire and Heat Protectiv e
Clothing and other
Wov ens 18%
Disposable Clothing 64%
Homeland Security Chemical Suits
Gloves & Arm Protection
Fire and Heat Protective Clothing and other Wovens
Disposable Clothing
High Visibility
Revenue Composition FY16*
Domestic 57%
International 43%
*Revenue from continuing operations
14Optimized Global Presence
Sales Operations (16)
Manufacturing Location (6) Headquarters: Ronkonkoma, New York
15May want to add 1HFY17
International Traction
• International Growth – Foreign Revenues
Comprised 43% of Total in FY16 International Revenues ($ Millions)
60
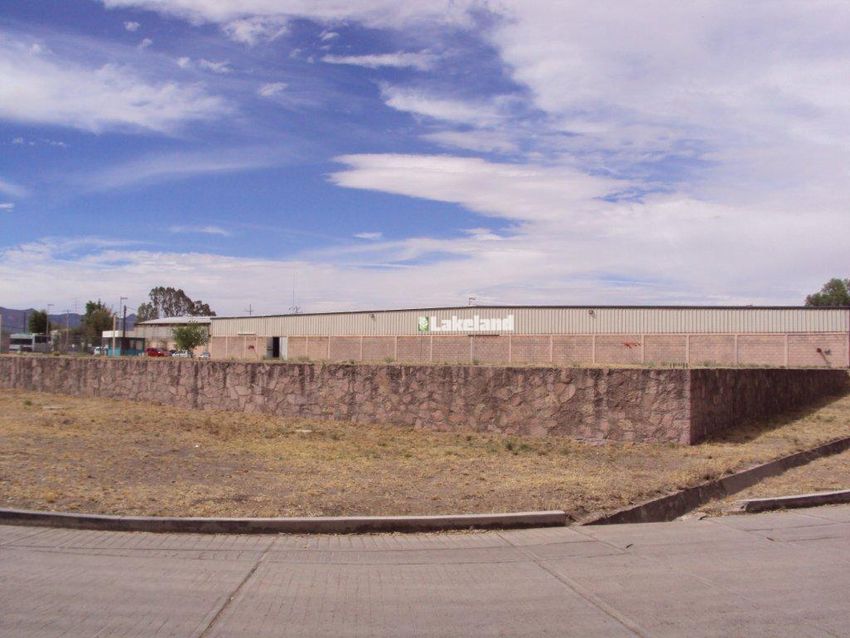
• Manufacturing Locations
– Small facility in US 50
– Expanded plant in Mexico
40
– Expansion in China
– Start-up operation in India 30
• New Markets Since 2007/08 20
– China/Asia Pacific
– Russia/Kazakhstan 10
– South America
– Southeast Asia/Australia 0
– Eastern Europe, Scandinavia
• Snapshot
– Asia: 15% of revenues with big upside Consolidated International Unit Sales
– Europe: 12% and growing Increased in FY16 from FY15 but Strength
– Canada: 9% and growing of US Dollar Distorted Results as Reported
– Russia, Latin America: flat due to political
problems and oil/commodities * Direct container shipments from China to US customers
reclassified to USA sales in 4QFY13 1617
18
19
Diversification Strategy & Transition
                (Continuing Operations for FY2016 Ended 1/31/16)

            Area                   FY2006                     FY2016
                                                     Multi-sourced, lower priced
COGS/Raw Materials              Tied to DuPont
                                                       fabrics than DuPont
                                                   29.2% in F14, 32.5% in F15 and
Pricing Power: Gross Margin      Approx. 22%
                                                   36.5% in F16 (excluding Brazil)

Sales Channel                    Distributors      Distributors and Key End Users

                                                   Diversified: Fire, Glove, Petro,
Customer Concentration           Focused: Auto
                                                   Food, Healthcare, Auto, Mining
Number of Products                   800

Country Sales Offices                 3                            16

Geographic Coverage             North America                  Global

Manufacturing Locations           U.S., China        China, Mexico, U.S., India

Manufacturing Capacity            $95 Million               $130+ Million
Profit Power: EBITDA Margin      Approx. 9%                 Approx. 13%               20
Unique Operating Platform
• Our base business grows both organically and from international expansion
• But always in a position to gain bonus business from emergencies like pandemics,
oil/chemical spills, natural disasters, etc.
• While timing is unpredictable, they do occur regularly, and spike our earnings
• We are able to capitalize due to our unique highly scalable operating platform of
company-owned manufacturing facilities
• Ebola/Avian Flu Crises Case Study
– Sudden, significant global demand for protective suits
– Increased Monthly Production Capacity 200% for sealed seam suits in just two months
– That’s how we won big ebola and avian flu contracts; no one else could scale up as fast
• Successful Crisis Performance Yielding Benefits
– Enhanced our brand by outperforming the big names
– Burnished reputation as the “go-to” supplier for emergencies, gaining us new customers
– Improved our access to healthcare and government agencies globally
– Unlike Brand D, we were also able to take care of our regular customers (and some of
theirs…)
21Growth Catalysts and Strategy
• Protective clothing market projected to grow at 7% world-
wide; faster in developing markets, and we can do much better
• Concentrating on high growth potential regions (Asia) or
where market share can be increased (Europe, US)
• Developing new and higher margin products
• Investing in process improvement, equipment and systems for
increased efficiency, capacity, quality, margins, and control
• Aggressively adding sales people in regions where under-
represented
• Focusing increasingly on end-users
• Leveraging global brand and worldwide company-owned
manufacturing facilities
• Benefiting from competitors manufacturing limitations
• Entering new markets in US and Worldwide
22International Profit Leverage
Opportunities
• We can grow anywhere, but best leverage is in developing
markets
• Developing countries/industries adopting OSHA-like regulations
• We already have our manufacturing capacity in place
• Little cost to extend broader US product line offerings or adapt to
local standards
• American global brands are greatly respected in developing
markets
• We have no company sales staff in many Asian countries
• We can put 5 sales people on the street in SE Asia for the cost of
one in the US and Europe…but selling prices are not much less
• So just hiring for better end-user coverage and to fill holes in
Europe and US
• But hiring as fast as can find qualified people in Asia
• This is our great upside play…
23Attractive Investment Merits
NASDAQ: LAKE
• Turnaround strategy has succeeded LAKE Stock Information
• Potential for steady industry-beating long term
Share Price $10.36
world-wide sales and profit growth
Shares (FD Issued & O/S) 7.3 million
• Huge upside in developing markets
Market Cap $75.6 million
• Significant advantages from unique operating
Price/Sales 0.8
platform
Price/Earnings 13.3
• Enhanced global recognition in $7 billion
Stock price as at 9/15/16; includes warrant shares. Ratios
worldwide market for protective apparel use consolidated results from continuing operations for
most recent quarter on annualized basis.
• Strong balance sheet; access to credit facilities
• Exit from Brazil, early payoff of liability; tax
benefit of over $9M credit expected
• Eventual rebound of foreign currencies will boost
profits
• Substantial insider ownership
24Appendix:
Financials
25Full Year Operating Earnings and
Adjusted EBITDA Reconciliation
Operating Results as Restated for Discontinued Operations ($ 000)
Reconciliation to GAAP Results
Year Ended Year Ended
January 31, January 31,
2016 2015
Net sales from continuing operations $99,646 $93,419
Year over year growth 6.7% -----
Gross profit from continuing operations 36,333 31,698
Gross profit % 36.5% 33.9%
Operating expenses from continuing operations 24,521 24,737
Operating expenses as a percentage of sales 24.6% 26.5%
Operating income from continuing operations 11,812 6,961
Operating income as a percentage of sales 11.9% 7.5%
Interest expense from continuing operations 785 1,688
Other expense from continuing operations (120) (2,375)
Pretax income from continuing operations 10,907 2,898
Income tax expense (benefit) from continuing operations 3,117 (8,188)
Net income from continuing operations 7,790 11,086
Non-cash reclassification of Other Comprehensive Income to
Statement of Operations with no impact on stockholder’s equity (1,286) -----
Loss from operations from discontinued operations (3,538) (2,836)
Loss from disposal of discontinued operations (515) -----
Loss before taxes for discontinued operations (5,339) (2,836)
Income tax expense (benefit) from discontinued operations (1,403) (149)
Net loss from discontinued operations (3,936) (2,687)
Net income $3,854 $8,399
Weighted average shares for EPS-Basic 7,171,965 6,214,303
Net income per share from continuing operations $1.09 $1.78
Net loss per share from discontinued operations $(0.55) $(0.43)
Net income per share $0.54 $1.35
Operating income from continuing operations $11,812 $6,961
Adjusted EBITDA 13,504 10,000 26
Free cash flow $10,838 $7,362Quarterly Operating Earnings and
Adjusted EBITDA Reconciliation
Operating Results as Restated for Discontinued Operations
($000)
Reconciliation to GAAP Results
Quarter Ended Quarter
July 31, 2016 Ended April
30, 2016
Net sales from continuing operations $22,269 $20,369
Gross profit from continuing operations 8,590 6,776
Gross profit % 38.6% 33.3%
Operating income from continuing operations 2,631 169
Operating income % 11.8% 0.8%
Interest expense from continuing operations 175 198
Other income from continuing operations (35) 8
Pretax income from continuing operations 2,421 (21)
Income tax expense from continuing operations 990 (24)
Net income $1,431 $3
Weighted average shares for EPS-Basic 7,254,999 7,254,162
Net income per share from continuing operations $0.20 $0.0
Net loss per share from discontinued operations ----- -----
Net income per share $0.20 $0.0
Operating income from continuing operations $2,631 $169
Depreciation and amortization 317 287
Other income from continuing operations (35) 8
EBITDA from continuing operations 2,913 464
Equity Compensation (52) 130
USA severance 152 309
Adjusted EBITDA 3,013 903
Free cash flow $2,537 $741
27Balance Sheet
LAKELAND INDUSTRIES, INC. AND SUBSIDIARIES
CONDENSED CONSOLIDATED BALANCE SHEETS
ASSETS July 31, January 31,
2016 2016
Current assets ($000’s)
Cash and cash equivalents $7,940 $7,022
Accounts receivable, net of allowance for doubtful accounts of $573 and $593 at July
31, 2016 and January 31, 2016, respectively 11,978 11,476
Inventories, net of allowance of $2,355 and $2,566 at July 31, 2016 and January 31,
2016, respectively 39,239 40,841
Other assets 5,526 4,333
Total current assets 64,683 63,672
Property and equipment, net 9,861 10,369
Deferred income tax, noncurrent 12,783 12,783
Prepaid VAT and other taxes 377 377
Security deposits 111 93
Other assets 8 95
Goodwill 871 871
Total assets $88,694 $88,260
LIABILITIES AND STOCKHOLDERS’ EQUITY
Current liabilities
Accounts payable $6,616 $4,254
Other accrued expenses 2,758 2,970
Current maturity of long-term debt 50 50
Short-term borrowing 3,232 3,226
Borrowings under revolving credit facility 6,160 9,458
Total current liabilities 18,816 19,958
Long-term liabilities 739 786
Total liabilities 19,555 20,744
Stockholders’ equity
Preferred stock, $0.01 par; authorized 1,500,000 shares (none issued) ----- -----
Common stock, $0.01 par; authorized 10,000,000 shares,
Issued 7,612,638 and 7,610,603; outstanding 7,256,197 and 7,254,162 at July 31,
2016 and January 31, 2016, respectively 76 76
Treasury stock, at cost; 356,441 shares at July 31, 2016 and January 31, 2016 (3,352) (3,352)
Additional paid-in capital 64,543 64,468
Retained earnings 9,942 8,508
Accumulated other comprehensive loss (2,070) (2,184)
Total stockholders' equity 69,139 67,516
Total liabilities and stockholders' equity $88,694 $88,260
28You can also read