CIC MARKET SOLUTIONS FORUM - May 19, 2021 - Investor Relations

Page created by Lori Shelton
 
CONTINUE READING
CIC MARKET SOLUTIONS FORUM - May 19, 2021 - Investor Relations
CIC MARKET SOLUTIONS
FORUM
May 19, 2021
CIC MARKET SOLUTIONS FORUM - May 19, 2021 - Investor Relations
SAFE HARBOR STATEMENT

Forward-looking statements involve risks.
This company presentation contains various statements concerning the future
performance of STRATEC. These statements are based on both assumptions and
estimates. Although we are convinced that these forward-looking statements are
realistic, we can provide no guarantee of this. This is because our assumptions involve
risks and uncertainties which could result in a substantial divergence between actual
results and those expected.
It is not planned to update these forward-looking statements.

MAY 19, 2021                                                                              2
CIC MARKET SOLUTIONS FORUM - May 19, 2021 - Investor Relations
AGENDA

1.     OVERVIEW AND BUSINESS MODEL
2.     THE IVD MARKET
3.     FINANCIALS
4.     OUTLOOK AND STRATEGY

MAY 19, 2021                         3
CIC MARKET SOLUTIONS FORUM - May 19, 2021 - Investor Relations
OVERVIEW AND
 BUSINESS MODEL

MAY 19, 2021      4
CIC MARKET SOLUTIONS FORUM - May 19, 2021 - Investor Relations
OVERVIEW AND BUSINESS MODEL

STRATEC AT A GLANCE
• Leading OEM player for automation solutions for the
    diagnostics industry and translational research
• Three decades of experience in highly regulated
    healthcare markets and growing technology pool
• Around 1.300 employees worldwide
      ~ 50% allocable to R&D
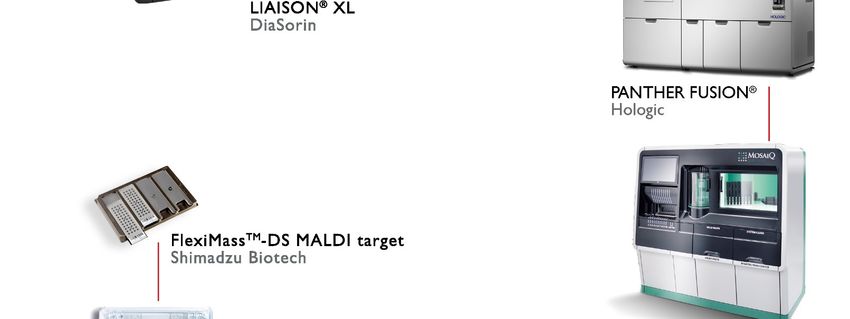
• Production sites in Germany (HQ), Switzerland,            SELECTED PRODUCTS
    Hungary and Austria
• High number of systems installed globally
      More than 13,000 medium to high throughput systems
      More than 25,000 low throughput systems
• Sales of € 250.1 million in 2020
      CAGR sales since IPO in 1998: ~15%
• Dividend payments raised over 17 consecutive years*

MAY 19, 2021                                                                    5
CIC MARKET SOLUTIONS FORUM - May 19, 2021 - Investor Relations
OVERVIEW AND BUSINESS MODEL

UNIQUE MARKET POSITION
STRATEC IN THE IVD VALUE CHAIN

                           Diagnostic             Blood Banks,            Patients
                           Companies              Laboratories

    STRATEC develops        Partners market        Laboratories            Growth drivers:
    and manufactures        systems together       performing tests
                                                                           • Aging population
    fully automated         with reagents and      and offering service
    analyzer systems        consumables to         to doctors and          • Developing
    and disposables         laboratories, blood    patients using          healthcare systems
    focusing on the high    banks and              reagents from           worldwide
    growth segments in      hospitals              diagnostic              • Rising prevalence
    diagnostics             worldwide              companies               of chronic diseases
                                                                           • High volume of
                                                                           new tests

MAY 19, 2021                                                                                     6
CIC MARKET SOLUTIONS FORUM - May 19, 2021 - Investor Relations
OVERVIEW AND BUSINESS MODEL

BUSINESS MODEL
STRATEC provides instrumentation, consumables, software and automation solutions
     OEM development and manufacturing
     Around 8,000 fully automated analyzer systems and modules manufactured annually
     Wide range of intellectual property rights

Extensive collaboration with partner during design phase
     STRATEC: Engineering / automation, software, QM
     Partner: System / reagent / market requirements

Systems have long market lifecycles
     Product lifecycles typically in an area of 12 to 15 years
     Leads to longstanding partnerships
     Expanding installed base of systems
     Product enhancement and extension drives value

MAY 19, 2021                                                                            7
CIC MARKET SOLUTIONS FORUM - May 19, 2021 - Investor Relations
OVERVIEW AND BUSINESS MODEL

SECURING RETURN ON INVESTMENT
Long-term agreements with partners                               INDICATIVE SALES CHARACTERISTICS
                                                                 OF AN ANALYZER OEM PROJECT
     Milestone payments during development stage
     Operating sales during series production stage
     Recurring sales from service parts & consumables
      sales

                                                                                                     launch of successor product
                                                                                                     Development and market
                                                         Sales
Minimum volume commitment
     Firm purchase orders
     STRATEC an integral part of partners’ plans

Reliable partnership
                                                                                           12 to 15 years
                                                                 2 to 4 years                                                      Another 5 years
     Shortened development time                                 Development
                                                                                Marketing phase of the analyzer system
                                                                                                                                   of service parts
                                                                    phase                                                          & consumables
     Integration of analyzer system and reagents                                    Service part & consumables
     Agreed development budget & transfer price
     High commitment by both partners

MAY 19, 2021                                                                                                                                      8
CIC MARKET SOLUTIONS FORUM - May 19, 2021 - Investor Relations
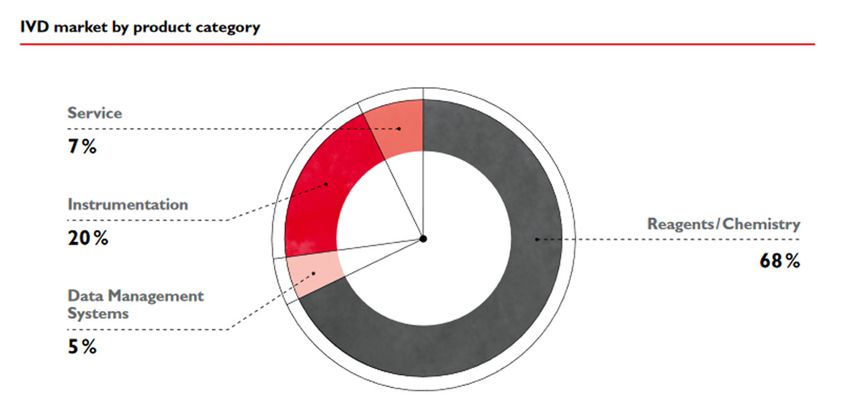
THE IVD MARKET

MAY 19, 2021      9
CIC MARKET SOLUTIONS FORUM - May 19, 2021 - Investor Relations
THE IVD MARKET

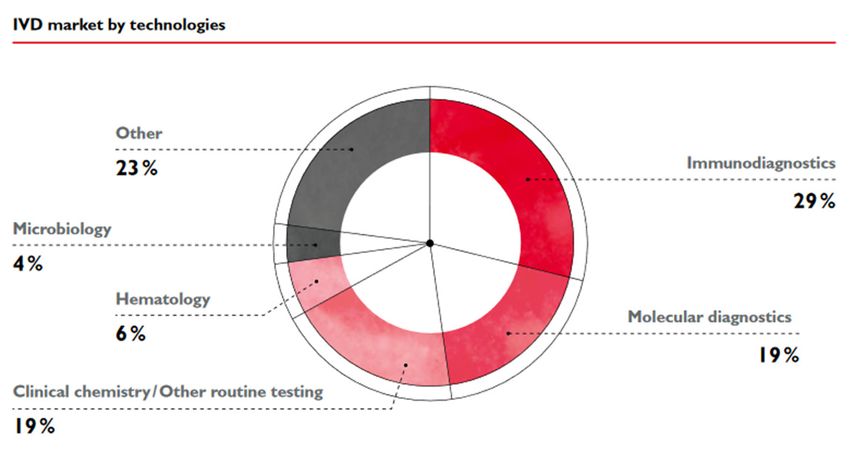
IVD MARKET SEGMENTS / IVD MARKET: ~ 85 BILLION USD IN 2020

                                                                                  Total instrumentation market ~ 17 billion USD

    Growth drivers
     Aging world population
     Rising prevalence of chronic diseases
     Expansion in healthcare systems, especially in emerging markets
     New technologies broadening scope of IVD applications (e.g. oncology, personalized medicine or non-invasive prenatal testing)
     Increasing automation

                                                                                           Source: MarketsandMarkets: “In vitro diagnostics market – forecast to 2025”, Oct 2020
MAY 19, 2021                                                                                                                                                                       10
THE IVD MARKET

OUTSOURCED VS IN HOUSE INSTRUMENTATION MARKET
 • The majority of instrumentation equipment in the IVD market is still developed in-house by diagnostics companies

 • Share of outsourced developments has already increased significantly over the last couple of years

 • Trend of outsourcing towards specialized players set to continue, due to:
    Engineering of automation solutions often not core competence of diagnostics companies
    Shorter development timeframes due to already existent technology pools
    Guaranteed project budget and firm transfer prices
    Keeping up with regulatory developments easier for specialized players
    Structured processes in order to address end customer needs, such as ease of use, user experience, workflow efficiencies, remote access,
     serviceability and preventive maintenance

     PAST                                                                                                                               FUTURE
                                         PROPORTION OF OUTSOURCED INSTRUMENTION DEVELOPMENTS

MAY 19, 2021                                                                                                                                     11
THE IVD MARKET

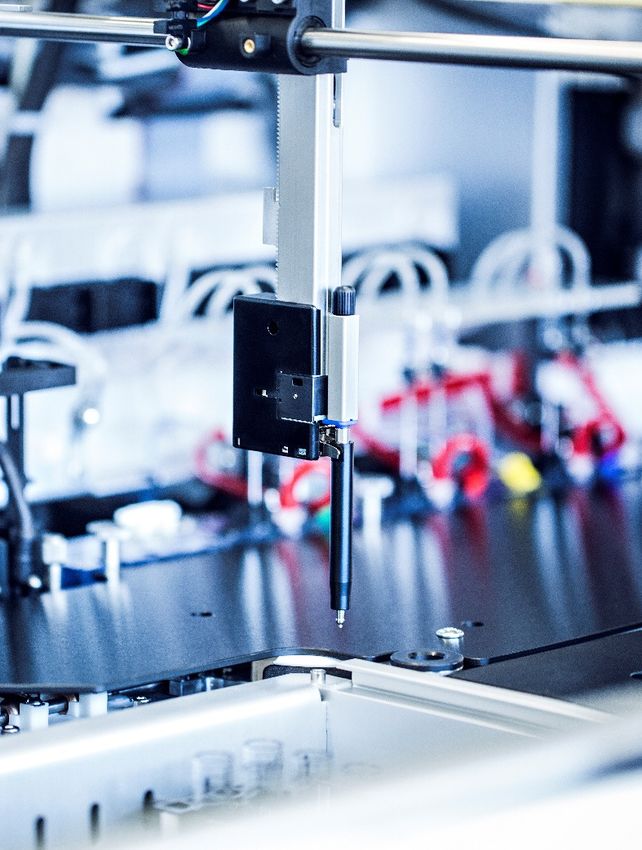
A SELECTION OF STRATEC CUSTOMERS
               GLOBAL TOP 20 IVD COMPANIES                                                 Sales 2020 (USD billion)    … AND OTHER
                                                                                                                      GAME-CHANGING
       1.    Roche                                                                                   14.8               COMPANIES
       2.    Abbott                                                                                  10.8
       3.    Danaher                                                                                 7.4
       4.    Thermo Fisher                                                                           5.3
       5.    Siemens Healthineers                                                                    4.7
       6.    BECTON DICKINSON                                                                        3.3
       7.    bioMerieux                                                                              3.0
       8.    Hologic                                                                                 2.9
       9.    Sysmex                                                                                  2.8
     10.     Perkin Elmer                                                                            2.1
     11.     Ortho Clinical Diagnostics                                                              1.9
     12.     Quidel                                                                                  1.7

     13.     BIO-RAD                                                                                 1.3
     14.     CH Werfen                                                                               1.3
     15.     Shenzhen Mindray                                                                        1.3
     16.     DiaSorin                                                                                1.1              STRATEC customer
     17.     Agilent Tech                                                                            1.1
     18.     Seegene                                                                                 1.0              Not a STRATEC customer
     19.     Grifols                                                                                 0.9
     20.     Qiagen                                                                                  0.9

 Source: IVD News / non-public companies estimated / non-reported sector sales estimated

MAY 19, 2021                                                                                                                             12
FINANCIALS

MAY 19, 2021   13
FINANCIALS

KEY FIGURES - TRACK RECORD

Sales in € million                                                                            EBIT in € million
CAGR ~9%                                                                                      CAGR ~9%
                                                                                                45.0                                                                                            1
                                                                                                                                                                                         41.7
                                                                                250.1
 250                                                                                            40.0                                                               1
                                                                                                                                                            36.4
                                                        207.5           214.2                                                                           1
                                                                                                35.0                                             32.3
                                                                187.8                                                                                                                1
 200                                            184.9                                                                                                                         29.3
                                                                                                30.0                                      26.9                            1
                                                                                                                                                                       26.2
                                  144.9 146.9                                                                                      24.1
 150                                                                                            25.0          21.8
                            128
                116.6 122.7                                                                            17.6
                                                                                                                            19.5
          102                                                                                   20.0
                                                                                                                     15.6
 100                                                                                            15.0

                                                                                                10.0
  50
                                                                                                 5.0

      0                                                                                          0.0
          2010 2011 2012 2013 2014 2015 2016 2017 2018 2019 2020                                       2010 2011 2012 2013 2014 2015 2016 2017 2018 2019 2020

  1   Figures adjusted for comparison; adjusted for depreciation and amortization from purchase price allocation for acquisitions, related integration expenses
      and other extraordinary effects. Reconciliation to IFRS figures can be found in the respective annual report.

MAY 19, 2021                                                                                                                                                                                        14
FINANCIALS

KEY FIGURES - TRACK RECORD

Net income in € million                                                                                   Dividend per share in €
CAGR ~10%                                                                                                 CAGR ~6%
 40.0                                                                                                    1.00
                                                                                                     1                                                                                       2
                                                                                              35.2                                                                                    0.90
 35.0                                                                                                    0.90                                                                  0.84
                                                                                                                                                                 0.80   0.82
                                                                                                         0.80                                      0.75   0.77
                                                                    1
 30.0                                                    1
                                                             27.9                                                                           0.70
                                                  25.4                                    1              0.70
                                                                                   24.1                                              0.60
 25.0                                      22.1                                1                                              0.56
                                                                                                         0.60          0.55
                                    19.8                                20.2                                    0.50
 20.0                                                                                                    0.50
               15.3          15.5
 15.0   13.0          12.4                                                                               0.40
                                                                                                         0.30
 10.0
                                                                                                         0.20
  5.0
                                                                                                         0.10
  0.0                                                                                                    0.00
        2010 2011 2012 2013 2014 2015 2016 2017 2018 2019 2020                                                  2010 2011 2012 2013 2014 2015 2016 2017 2018 2019 2020

  1 Figures adjusted for comparison; adjusted for depreciation and amortization from purchase price allocation for acquisitions, related integration expenses
    and other extraordinary effects. Reconciliation to IFRS figures can be found in the respective annual report.
  2 Subject to AGM approval

MAY 19, 2021                                                                                                                                                                                     15
FINANCIALS

FINANCIALS AT A GLANCE Q1 20211
 € 000s                                                                                 Q1 2021               Q1 2020               Change

 Sales                                                                                      71,995                56,504              +27.4%

 EBITDA                                                                                     18,840                10,142              +85.8%

 EBITDA margin (%)                                                                            26.2                   17,9           +830 bps

 Adjusted EBIT                                                                              16,045                 7,658             +109.5%

 Adjusted EBIT margin (%)                                                                     22.3                   13.6           +870 bps

 Adjusted consolidated net income                                                           13,147                6,2462             +110.5%

 Adjusted basic earnings per share (in €)                                                     1.09                  0.522            +109.6%

 Basic earnings per share IFRS (in €)                                                         0.95                  0.372            +156.8%

 bps = basis points

 1   For comparison purposes, adjusted figures exclude amortization resulting from purchase price allocations in the context of acquisitions.
 2   Result from continuing operations.

MAY 19, 2021                                                                                                                                    16
FINANCIALS

SALES Q1 2021
In € million                                             Q1 2021 sales up 27.4% yoy to € 72.0 million
                                                          +32.5% at constant currency
80
                                                 72.0
70
                                                            (+) Continuously high demand for
60                                       56.5
                                                               molecular and immunoassay solutions
                 49.5
50                               46.6                           Strong business with Systems as well
                         39.6                                      as Service parts & Consumables
40
        31.2
30
                                                            (+) Single-digit growth with
20                                                              Development and Services sales
10

 0                                                          (-) Ramp-up curve of newly launched
       Q1/16     Q1/17   Q1/18   Q1/19   Q1/20   Q1/21          products tampered by pandemic-driven
                                                                reallocation of priorities
As of March 31

MAY 19, 2021                                                                                            17
FINANCIALS

 ADJUSTED EBIT AND EBIT MARGIN Q1 2021

                                                                                 Q1 2021 adjusted EBIT up by 109.5%
EBIT in € million                                            EBIT margin in %
                                                                                 yoy to € 16.0 million
18
                                                                   16.0    24%
16                                                         22.3%
                                                                           21%   Q1 2021 adjusted EBIT margin up by
14
                                                                           18%   870 bps yoy to 22.3%
12
      14.5%         13.9%                                                  15%
                                                  13.6%
10
                                          10.7%      7.7                   12%       (+) Economies of scale
8                             10.1%
                    6.9
6                                                                          9%
       4.5                                 5.0
                              4.0                                                    (+) Sales/product mix
4                                                                          6%

2                                                                          3%
                                                                                     (+) Efficiency enhancements
0                                                                          0%
     Q1/16        Q1/17      Q1/18        Q1/19     Q1/20          Q1/21

     EBIT                   EBIT margin

 As of March 31

MAY 19, 2021                                                                                                          18
FINANCIALS

CASH FLOW AND NET DEBT Q1 2021

 € 000s                              Q1 2021   Q1 2020   Change    •   Strong improvement in operating cash flow
                                                                       dynamics but still elevated inventory needs
 Cash flow – operating activities     14.0       3.2     +337.5%

 Cash flow – investment activities     -4.3      -7.1      n/a     •   Lower investment spending following completed
 Cash flow – financing activities      -1.3     14.5       n/a         construction work for expansion of building
                                                                       capacity at HQ (investment ratio1 at 6.0% of sales)
 Free cash flow                        9.7       -3.9      n/a

                                                                   •   Net debt down by 8.5%
                                                                       Net debt / LTM EBITDA of 1.2x

 € 000s                              Q1 2021   FY 2020   Change

 Cash and cash equivalents
                                      45.7       37.6    +21.5%
 at end of period
                                                                       1 Total
                                                                             investments in intangible and tangible assets in % of sales
 Equity ratio (%)                     51.3       52.0    -70 bps       LTM = Last twelve months
 Net debt                             75.7       82.7     -8.5%

MAY 19, 2021                                                                                                                               19
FINANCIALS

SALES BY OPERATING DIVISIONS FY 2020

 Sales in € million                                                                    In % of total sales

                                                                                           100%
  160        +39.8%
             (+42.0% at CER)                                                                90%
  140                                                                                       80%
                                                                                                               48%
  120                                                                                       70%                                        57%
  100                            +18.0%                                                     60%
                                 (+19.7% at CER)
   80                                                                                       50%
                                                   -38.9%                                   40%
   60                                              (-38.6% at CER)
                                                                                                               32%
                                                                                            30%
   40                                                                                                                                  32%
                                                                     +15.4%                 20%
   20                                                                (+17.1% at CER)        10%                20%
                                                                                                                                       11%
     0                                                                                        0%
             Systems           Service Parts & Development            Others                                  2019                     2020
                                Consumables and Services
                                                                                               Others                        Development and Services
                           2019                    2020                                        Service Parts & Consumables   Systems
As of December 31
CER= Constant exchange rates

MAY 19, 2021                                                                                                                                            20
OUTLOOK AND
 STRATEGY

MAY 19, 2021   21
OUTLOOK AND STRATEGY

UPDATE COVID-19 PANDEMIC
    Several STRATEC customers are at the forefront of containing the COVID-19 pandemic
    - Significant proportion of genetic COVID-19 testing is performed on systems developed and manufactured by STRATEC
    - Additional demands for immunoassay solutions due to antibody screening and lab-based antigen tests
    - Still unprecedented demand levels and strong order trends  strong business performance expected for H1 2021

    Various factors set to influence H2 2021 demand levels:
    -   Magnitude of replacement potential triggered by elevated utilization levels of installed base
    -   Uplift of serological and other testing (e.g. full respiratory panels)
    -   Overall testing volumes and penetration of genetic versus rapid antigen tests
    -   Impact of significant expanded installed base on Service parts & Consumables business
    -   Catch up potential of non-COVID-related product lines

    Expected longer-term dynamics:
    -   Improved perception of IVD methods and further increase in STRATEC brand awareness
    -   Allocation of research budgets into infectious diseases
    -   Renaissance of decentralized testing capacities (more testing again in hospitals)
    -   Increased and sustainable public investments in healthcare infrastructures
    -   Sustainable additional testing demand (e.g. Long COVID, respiratory panels, other screening tests)

MAY 19, 2021                                                                                                             22
OUTLOOK AND STRATEGY

FINANCIAL GUIDANCE FOR FISCAL YEAR 20211
•       Constant-currency sales growth in at least a high single-digit percentage range

•       Adjusted EBIT margin of around 17.5% to 18.5% (2020: 16.7%)

•       Investments in tangible and intangible assets combined of around 6.0% to 8.0% of sales

1 Due     to the COVID-19 pandemic, STRATEC continues to observe higher volatility in its customers' order behavior. In the
    first quarter of 2021, the company witnessed an overall rise in order forecasts for the second half of 2021. Due to the
    additional forecasting uncertainty resulting from the pandemic, however, the higher order forecasts for the fourth quarter of
    2021 in particular are still not incorporated in the above financial guidance.

MAY 19, 2021                                                                                                                        23
OUTLOOK AND STRATEGY

                                     STRATEGIC PRIORITIES

•   Focus on high                                                                 •   Organically and via
    growth areas and    Enable customers and                                          M&A transactions
    segments
                       STRATEC to grow above       Expand
                                                 Expand    product/value
                                                        product/value offering    •   Without entering
•   Boost expertise        market average                                             into competition to
    and technology                                         offering                   partners
    portfolio

                                                                                  •   Utilize extended
•   Utilize tailwind                                                                  platform offering
    from increasing     Increase proportion of                                    •   Extend components
    complexity
                          recurring revenues     Drive customer
                                                   Expand       diversification
                                                            product/value             business
•   Expand smart
    consumables
                                                           offering               •   New markets (e.g.
                                                                                      veterinary,
    business
                                                                                      translational
                                                                                      research)

    MAY 19, 2021                                                                                          24
OUTLOOK AND STRATEGY

SELECTION OF ESG TOPICS AND LATEST ACHIEVEMENTS
•    Challenges of COVID-19 pandemic successfully managed
      Employee health top priority (new shift system, extended options for remote working, increased working hours
         flexibility, early and strict travel restrictions)
      Business continuity (supply chain, production, logistics, development and business operations)
•    Strong commitment to combat climate change
      Science based reduction target (SBT) in line with Paris agreement to limit global warming to less than 2.0°C
          30% absolute reduction of scope 1 and 2 emissions by 2030 (versus 2019)
      Expanded disclosure: Scope 3 emissions to be reported from 2020 onwards
      Compensation of unavoidable Scope 1 and 2 emission (certified emission reduction projects)
•    Employer attractiveness and talent management
      Further employee surveys conducted in 2020
      Roll-out of new group-wide talent development program
•    New ESG initiatives
      E.g. new waste reduction program initiated in 2020

MAY 19, 2021                                                                                                          25
APPENDIX

MAY 19, 2021   26
APPENDIX

KEY FIGURES AT A GLANCE1
     IFRS (€ million)                                   2016                   2017                  2018                  20193                  2020
     Sales                                               184.9                   207.5                 187.8                 214.2                 250.1
     Adjusted EBIT                                        32.2                   36.4                  26.2                  29.3                   41.7

     Adjusted EBIT margin (%)                             17.4                   17.5                  13.9                  13.7                   16.7

     Adjusted Consolidated net income2                    25.3                   28.9                  20.2                  24.1                   35.2
     Adjusted Earnings per share (€) 2                    2.14                   2.43                  1.70                  2.01                   2.92
     Dividend per share (€)                               0.77                   0.80                  0.82                  0.84                   0.90*
     No. of employees                                     976                    1,086                 1,228                 1,302                 1,319
     Total assets                                         258                     264                   275                   299                   332
     Equity ratio (%)                                     55.7                   59.8                  55.3                  53.1                   52.0

     Free cash flow                                       -70.4                  14.4                   1.2                   -6.4                  10.0

 1 Figures adjusted for comparison; adjusted for depreciation and amortization from purchase price allocation for acquisitions, related integration expenses
   and other extraordinary effects. Reconciliation to IFRS figures can be found in the respective annual report.
 2 From continuing operations
 3 Retrospectively adjusted to account for the recognition of the Data Solutions business unit as a discontinued operation pursuant to IFRS 5.

 *Subject to approval by AGM 2021

MAY 19, 2021                                                                                                                                                   27
APPENDIX

ADJUSTMENTS
EBIT                                      Consolidated net income

 € 000s             Q1 2021    Q1 2020    € 000s                                   Q1 2021    Q1 20201

 Adjusted EBIT       16,045      7,658    Adjusted consolidated net income          13,147       6,246

 Adjustments:                             Adjusted earnings per share in €
                                                                                      1.09        0.52
                                          (basic)
 PPA amortization     -1,917     -2,062
                                          Adjustments:
 EBIT                14,128      5,596
                                          PPA amortization                           -1,917      -2,062

                                          Taxes on income                              319         320

                                          Consolidated net income                   11,549       4,503

                                          Earnings per share in € (basic)             0.95        0.37

                                          1   Results from continuing operations

MAY 19, 2021                                                                                              28
APPENDIX

SHAREHOLDER STRUCTURE
(AS OF: JUNE 2020)

                                                  Fixed and family ownership
                                                  (incl. their investment companies)
                                                  Free float
                        41.1%

                                   58.9%
                                               Institutional investors > 3%:
                                               Allianz Global Investors
                                               Ameriprise Financial
                                               Juno Investment Partners
SHARE
  IPO                           Aug. 1998
  Number of shares              12,102,945
  Share price (05/17/2021)      € 111.80
  Market capitalization         € 1.4 billon

MAY 19, 2021                                                                           29
CONTACT

 STRATEC SE                 THANK YOU
 Gewerbestr. 37
 75217 Birkenfeld           FOR YOUR
 Germany
                            ATTENTION
 Phone +49 7082 7916-0
 Fax +49 7082 7916-999
 www.stratec.com

 CONTACT
 Jan Keppeler, CFA
 Head of IR & CC
 Phone +49 7082 7916-6515
 j.keppeler@stratec.com

MAY 19, 2021                        30
You can also read