Retail Outlook 2016 - KPMG Boxwood
←
→
Page content transcription
If your browser does not render page correctly, please read the page content below

Retail
Outlook 2016
Paul Martin
UK Head of Retail
KPMG UK

For NG Retail Event, Dublin October 2016
Key factors impacting Retailers & Consumer Goods
 companies 2016
 1. UK’s referendum on EU membership                          2. FX rates
• The UK’s leave vote is creating high market                • Sterling has already reached 31 year low against USD.
  volatility and is weakening both business and                This will specifically impact non-food retailers due to
  consumer confidence.                                         their high-dependency on USD buying

• Initial impact will be predominantly focussed on fx        • The US has began the long haul back to a more
  rates with Sterling weakening                                normal interest rate policy at the end of last year
                                                               which has strengthened the USD
• Long-term volatility depends on future
  governments plan and exit negotiations with the            • A number of currencies in key Export markets have
  EU                                                           lost significant value over recent years
                                                               e.g. Russian Rouble

 3. Low commodity prices                                      4. Continuing global uncertainties
• Commodity prices have fallen significantly, with oil at    • China will continue to decelerate with a predicted 6.8%
  $120 per barrel in 2012 - now at around $40.                 growth in 2016 (IMF), dragging emerging markets down
                                                               and slowing growth in rich nations.
• Positive for consumers and business customers in the
  UK, but large oil companies will continue to struggle as   • Brazil and Russia’s recessions will continue with both
  their cashflow withers.                                      economies to continue shrinking slowly in 2016.

• Demand for other commodities is low, especially for        • Eurozone debt crisis may also impact the economy,
  industrial commodities, which is why prices                  however it is showing slow signs of recovery
  may stay persistently low.                                 • Economic growth in the Middle East and
                                                               North Africa (MENA) is stagnating.

          Source: IMF
                                                                                                                         2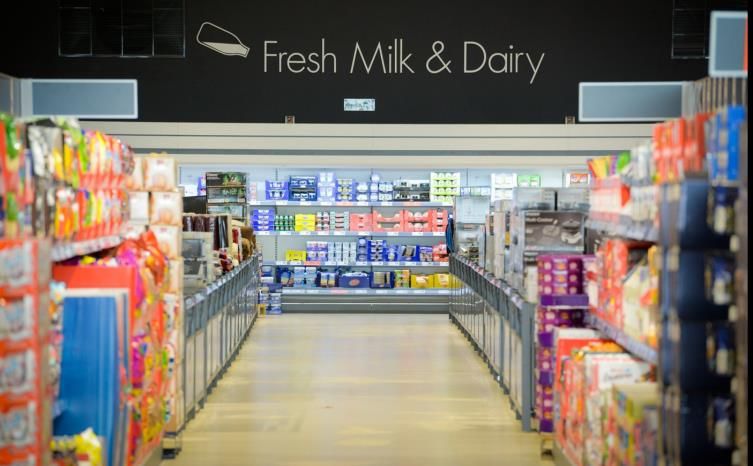
Brexit presents both challenge and opportunity
What’s going on:
• The UK will begin to exit the EU in April 2017
• UK participation in the European Single Market is undecided
• The pound continues to fall against the dollar, with an expectation towards parity

                                                             Challenges                              Opportunities
                                              • Unforseen FX hedging costs                • Lower tariffs - no longer paying
                                              • Personnel costs may rise -                  external EU tariffs on clothes
                                                     • National living wage will likely   • Positive exposure to €/$ if trading
                                                       raise costs                          overseas
                                                     • Businesses will be expected        • Business models that are more
                                                       to invest in and train its staff     efficient or relies on less staff are likely
                                                     • Restriction in migration may         to be more successful in the current
                                                       result in higher labour cost         environment
                                                     • Sourcing international design      • Sourcing locally could offer cost
                                                       talent might be impacted             savings, though first need to consider
                                              • A pricing policy decision will need to      our competitive position
                                                be made to pass on or absorb costs        • Originally tariff-free sources of product
                                              • Potential for longer inventory times        will have to change (e.g. Turkey), but
                                                and customs hassles                         Bangladesh, India and China are still
                                              • If exporting to Europe could incur          relatively lower cost options
                                                costs e.g. customs warehousing            • Potentially positive impact on the
                                              • Data privacy and sharing laws will          share price (inverse to dollar/pound)
                                                need to be reviewed (e.g. Denmark)

         Source: interview with KPMG BRC Expert Mark Essex
                                                                                                                                      3
Economic and retail outlook by region: Europe
                                                                              Sweden
                                                                            2.2% (GDP)
                                                                         1.5% (retail sales)

                                                Netherlands
                                                1.5% (GDP)                                                    Russia
                                             0.8% (retail sales)                                            1.1% (GDP)
                                                                                                         0.0% (retail sales)
                         UK                            Germany1.2% (GDP)
                     1.5% (GDP)                         1.2% (retail sales)
                  1.9% (retail sales)

                                                                                    Switzerland
                                                                                    1.6% (GDP)
                           France                                                0.6% (retail sales)
                         1.4% (GDP)
                      1.0% (retail sales)

           Spain
        1.9% (GDP)
     2.5% (retail sales)
                                                                                                             Turkey
                                                                                                           3.7% (GDP)
                                                                                                        1.4% (retail sales)
                                                    Italy
                                                1.1% (GDP)
                                             0.9% (retail sales)

                                                            GDP growth forecast 2016f-2020f (CAGR) [real]
    Source: Euromonitor, KPMG Boxwood analysis              Total retail sales growth forecast 2016f-2020f (CAGR) [real]       4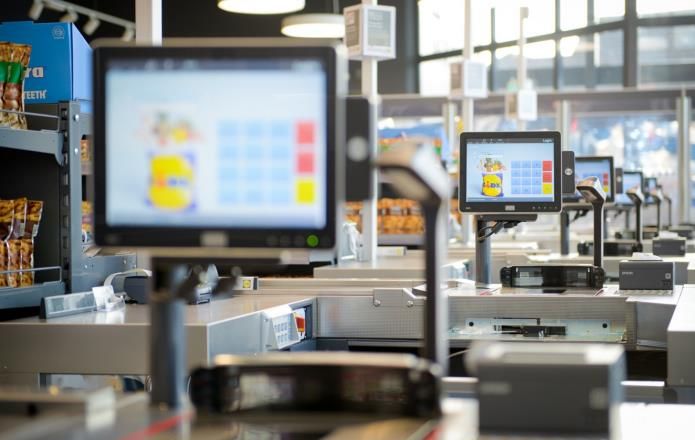
European Retail Outlook
W European Consumer Spending W Europe Channel Overview
RETAIL 2010-2020
600 CHANNEL CAGR
Consumer spending
Supermarket 1%
500
25,000
20,000 400 Internet 12%
USD per capita
Hypermarket 1%
USD bn
Health & Beauty 0%
15,000 300 Home & garden -0%
Discounters 3%
10,000 Leisure & personal -0%
200
Electronics & 0%
5,000 appliances
100 Mixed 1%
0 Direct 2%
2010 2011 2012 2013 2014 2015 2016F 2017F 2018F 2019F 2020F Vending 0%
0 Home shopping -8%
2010 2011 2012 2013 2014 2015 2016F 2017F 2018F 2019F 2020F
Consumer spend Retail spend
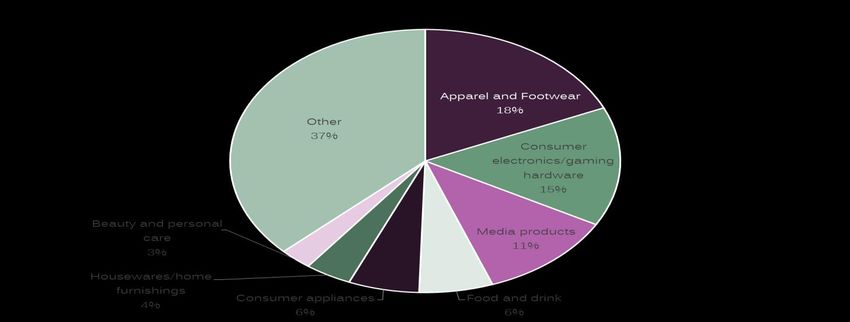
STORE VS NON-STORE Online Category split
12% non-store
Western Europe retailing
100%
% of retail sales
95%
90%
85%
80%
2010 2011 2012 2013 2014 2015 2016F 2017F 2018F 2019F 2020F
Store-based retailing Non-store retailing
Source: Euromonitor; WeAreSocial; Adyen
5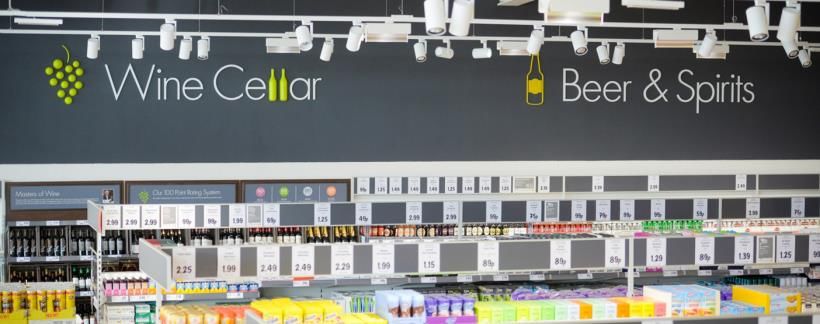
The Age of
Disruption

Disruptors
                    Poundland                       Amazon

                                         ALDI                                  Convenience
   Value                B&M
                                                                   Argos
                                     Cdiscount
                                                          Asos
                                         Uber
                                                                 Hello Fresh
                                                Zappos.com
                          Warby Parker
                                                   Thread.com

                                    Build A Bear
                                     Workshop

                                                Hamleys
                              Niketown

           Experience                                                                        7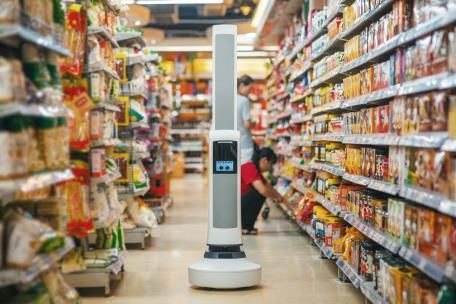
1                    2                    3
 Warby Parker           Hello Fresh         Thread.com

 Designer glasses
                       Redefining food   A personal stylist on
without the designer
                         shopping            your phone
     price tag

                                                           8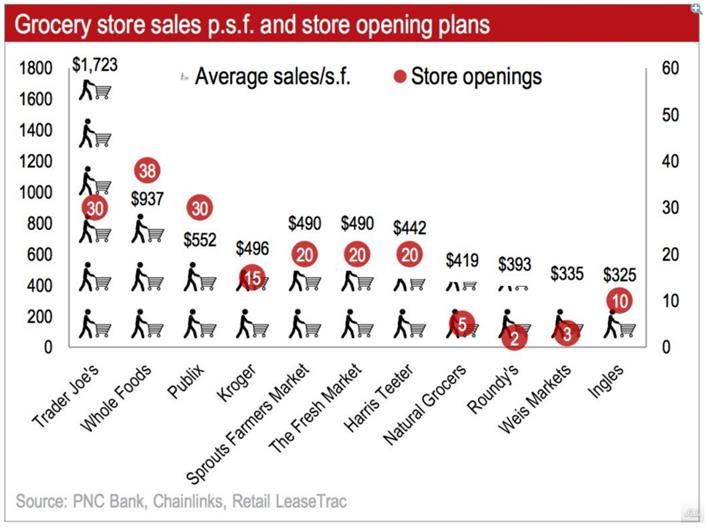
Top 10
Retail Trends
Retail macro trends
Internationalisation    Convenience     Fulfilment     Discounters      Innovation

 Business model        Connected home     Artificial   Omni-channel   Consumer power
                                        intelligence

                                                                                     10
Theme 1: Discounters
Both Aldi and Lidl have grown consistently
                                 Retail Value RSP                                                                    Number of outlets
       60,000
                                                                                                                                                      8462

                                                                                                    9,000                                    8016

                                                       +3.6%           51,898
       50,000
                                                                       48,986

                                                                                                    7,000

                                                                                Number of outlets
€ mn

       40,000                                                  +5.3%
                                                                                                    5,000
                 36,293

       30,000
                                                                                                    3,000
                 29,349

       20,000                                                                                       1,000

                                                Year           Aldi     Lidl                                                        Year

  Western Europe market
                                                                                                            Western Europe market
  Compound Annual Growth Rates noted
                                                                                                                                           Aldi     Lidl

                          Source: Euromonitor
                                                                                                                                            12
Discounters continue to threaten the multiples market
position
Asda’s low price proposition is under threat from the discounters Discounters gain significant market share, predominantly from Asda
‘The Grocer 33’ basket comparison: UK Retailers (2014-2015) Market shares: UK Retailers (2013-2015)
80 35%
Tesco Asda JS Morrisons Aldi Lidl
70 66.96 30%
Average basket comparison (£)
61.02
60 57.66 56.45
54.23 25% Asda market share declines to
Market Share (%)
16.4% below Sainsbury (16.5%)
50 47.18 for first time in 3 years
44.27
20%
40
15%
30
10%
20
10 5%
0 0%
Mar-13
Mar-14
Mar-15
Dec-13
Dec-14
Jun-13
Sep-13
Jun-14
Sep-14
Jun-15
Source: The Grocer 33 (Average basket price: 15/08/14, 7/11/14, 5/12/14, 13/3/15, 8/5/15, 2/7/15,
24/7/15)
Source: Kantar 12 week market shares (March 2013 – July 2015)
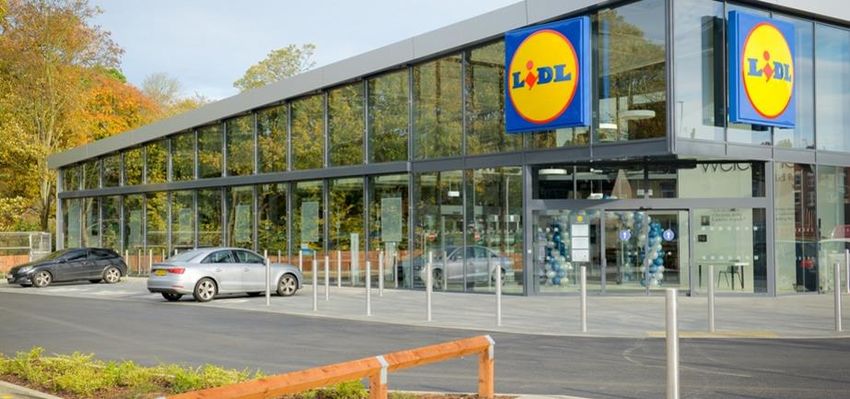
13Supermarketisation - Lidl Rushden
14Case study: Trader Joe’s
World’s leading private label organic supermarket High Sales Density
• Founded in in 1958 in California, this chain is owned by ALDI
since 1979 Trader Joe’s
• Over 450 stores in the US located stores
• Phenomenal growth: sales up from $2.1bn in 2003 to $9.4bn in operate at
2014 one of the
• For the last three years named by consumers as their overall highest sales
favourite store (survey by Market Force Information) density levels
in the US –
“Trader Joe’s doesn’t pick up on trends — it sets over $1,750
them” per sq. f.
A Trader Joe’s buyer
Value Proposition Operating Model
TJ is targeting different customer segments: from cost-conscious to
cool college kids to trendy well-heeled urbanites • Standardised store layout with most locations about 1,100m2
• Low SKU count (4,000) – they don’t carry all the necessities
What’s unique • Whenever possible, Trader Joe’s purchases directly from the
• Elevate food shopping from a chore to a cultural experience manufacturers
• Focus on gourmet, organic, natural, MSG free products, mostly • Small stores rely on timely distribution and don’t have large back
private label rooms
• Quirky fashionable products at a Walmart’s price point, many of • Good pay and employee culture help maintain customer service and
which you won’t see anywhere else (80% of stock is own label) low employee turnover (4%)
• Friendly ‘neighbourhood store’ type customer service
• Competing on price is not the only option – TJ is an example of how a chain with many characteristics of a discounter can position themselves
differently and target different customer segments
• Some of the Trader Joe's-branded products are already in Aldi stores in Europe – when will they be in Croatia?
15
15The trend towards “Supermarketisation”
Value Convenience
Experience 16Case study: Mercadona
2010 2011 2012 2013 2014
Sales (€m
15,055 16,284 17,422 17,849 18,163
ex.VAT)
Operating
560 641 656 660 675
profit
• Spain’s leading grocery retailer operating Outlet
supermarkets predominantly located in or 1,310 1,356 1,411 1,467 1,521
numbers
the edge of town centres Sales area
1,680 1,769 1,851 1,894 1,919
• A benchmark for retail productivity in Spain (‘000 sqm)
– sales per employee up by 62% between Sales per
2004 and 2012 outlet 11,698 12,216 12,597 12,404 12,157
(€’000)
• Sales: €18.2bn, growth of 20% between
Sales per
2010 and 2014 while overall Spanish 9,123 9,443 9,625 9,532 9,527
sqm (€)
household consumption contracted by 2%
• 1,576 stores, with plans to open a further
200 stores by 2018
“Mercadona wants to control its supplies totally,
to dictate what they produce, when and how.”
Javier Alfonso, author of “Mercadona, a success story”
17Case study: Mercadona continued
Value Proposition Operating Model
• Mid-market offering with excellent quality • Integrated supplier model - close relationship
to price ratio with a group of suppliers that exclusively
• Up to 8,000 branded and private label produce for Mercadona, often in exchange for
lines; private label accounts for over 20% Mercadona’s investment.
of Spain’s private label sales by volume • Tight control over costs across the supply
• Everyday Low Prices policy with stable chain, e.g. working with suppliers to eliminate
prices and low promotion share the glossy finish on some packaging
• Customer is at the top of the company’s • Innovation over imitation of popular brands -
organizational pyramid - high standards of Mercadona has its own laboratories where
customer service and constant they invite customers to showcase and test
dialogue with the customer their products
• High employee morale and low turnover
boosted by high job security (90% permanent
contracts) and above average pay
• Total control over supply chain and customer centricity allowed Mercadona to become the
market leader with over 20% market share
• Mercadona has successfully withstood the economic downturn and competition from discounters
– will it last in the online age?
18Theme 2: Connected Home & AI
The Connected Home
“Home” encompasses both the fabric and environment of the dwelling and the well being of people. The
connected home is no different. The connected home offers a huge spectrum of benefits, spanning the
provision of protection, convenience and environmental improvements to its inhabitants as well as delivering
entertainment, wellness and lifestyle benefits. These are available whether the occupants are In or away
from the house.

                                           Lifestyle       Automation &
                                           automation      control
                                           • Making        •Temperature
                                             shopping      •Lighting
                                             easier        •Blinds
                                                           •Garden

                              Wellness                                Security &
                              •Heath                                  monitoring
                               monitoring                             • Cameras
                              •Assisted living                        • Monitoring

                                                           Energy
                                         Entertainment     management
                                         &
                                         communication     • Intelligent
                                                             thermostats
                                         • Access in and
                                                           • Consumption
                                           out of home
                                                             management

                                                                                                      20
The Connected Home: the 5 ‘Cs’
$400-700bn market by 2019 | Growth of 50-60% annually over the next 5 years | 25bn connected devices by 2020
Customer Connectivity Cloud Content Kit
• Loyalty + trust • Infrastructure • Storage • Delivery channel • Media and social
• Complex sales • ID management capability • Media tech
• Tech service • Social • Access quality development • Beacons +
• Security • Learning + controls
• Relationship • Platform +
management Automation • Cross platform curation • Ambient
integration • Provider computing
• Insight + • Geofencing +
Analytics triggers management • Non-media tech
• Provider • White goods
management • Wearables
21Robotics in the value chain
• Robots are
• A robot in the
replacing
board of
warehouse
directors!
30% of Amazon workers!
• Bring back Robots marketplace sales • Self-driving
production entertain me in are priced by trucks have Robots are talking
thanks to the shop! algorithms! arrived! to us!
robotics!
Strategy &
Attract Buy Supply Sell Relate
Proposition
Support (Finance, Property, HR, IT, Partners)
I’ve been hired
by an An algorithm is telling
algorithm! me to replace failing
parts!
22Paul Martin UK Head of Retail, KPMG UK LLP +44 7551 152088 paul.martin@kpmg.co.uk KPMG UK LLP 15 Canada Square London E14 5GL United Kingdom
Disclaimer
The information contained herein is of a general nature and is not intended to address the
circumstances of any particular individual or entity. Although we endeavour to provide accurate and
timely information, there can be no guarantee that such information is accurate as of the date it is
received or that it will continue to be accurate in the future. No one should act on such information
without appropriate professional advice after a thorough examination of the particular situation.
You can also read