CORPORATE PRESENTATION - March 2019 - Arca Continental
←
→
Page content transcription
If your browser does not render page correctly, please read the page content below
C OR POR ATE PR ESEN TATION
          March 2019
It all started with Topo Chico mineral water

                             123 YEARS
93 YEARS

   Strong partnership with

Coca-Cola System pioneers in Mexico
Serving                                                                     USA

                                                                                MEXICO

  5 countries across the Americas
 Sales                 Production                                            ECUADOR
Vo l u m e              Facilities                  Associates

                                                                                         PERU

2.2
BUC
             158
             MXP$B
                          50           379            63         +1.3
                                                                   Million
                                                                                          ARGENTINA
                                                     Thousand

             Revenue                 Distribution                Points of
                                       Centers                     Sale

                                                                                                      4
A balanced portfolio of markets and business…
                                                                 PERU
                                   UNITED STATES

               EXPORTS                                     10%              ECUADOR
             AND VENDING

                                              35%                 7%
                1%                                                               ARGENTINA
                                                    Revenues        5%
                           CAGR
              2002          17%
                                  12x               2018            5%           SNACKS &
                                                                                 OTHER
                                                                                 BUSINESS

 MEXICO        99%
 BEVERAGES
                                                       38%
                                                                        MEXICO
      Mxp$ 13 billion
                                               Mxp$ 159 billion
                                                                                            5
…with a strong organic growth and an
 excellent M&A track record

                                                                                                   Great Plains

2002     2007       2008         2010       2011       2012         2014       2015   2016          2017          2018
ARCA     Snacks    Argentina &    Ecuador   CONTAL     Snacks &     Tonicorp   Peru   Sugar Mill   USA, AdeS Innovation &
Merger   Mexico   Jugos del Valle            Merger   Santa Clara                     Argentina     & Snacks    Snacks
                                                                                                                 USA
Our Corporate
Structure

           Market Cap(1):                USD$202 Bn                                                                Market Cap(1): USD$9.8            Bn

                       Coca-Cola Refreshments

                                                                                       20%                   80%                             100%

                                                                                          AC Bebidas                                 Food & Snacks

                                   99.8%                                                         100%                                    100%

                                                                                                                                    Coca-Cola Southwest
                                     Peru                                                      Mexico
                                                                                                                                        Beverages

                                                                  100%                                                    100%

                                                             Argentina                                                    Ecuador

____________________
(1) Considering a share price as of December 31, 2018. AC market cap was calculated using an exchange rate of MXP$19.65
                                                                                                                                                          7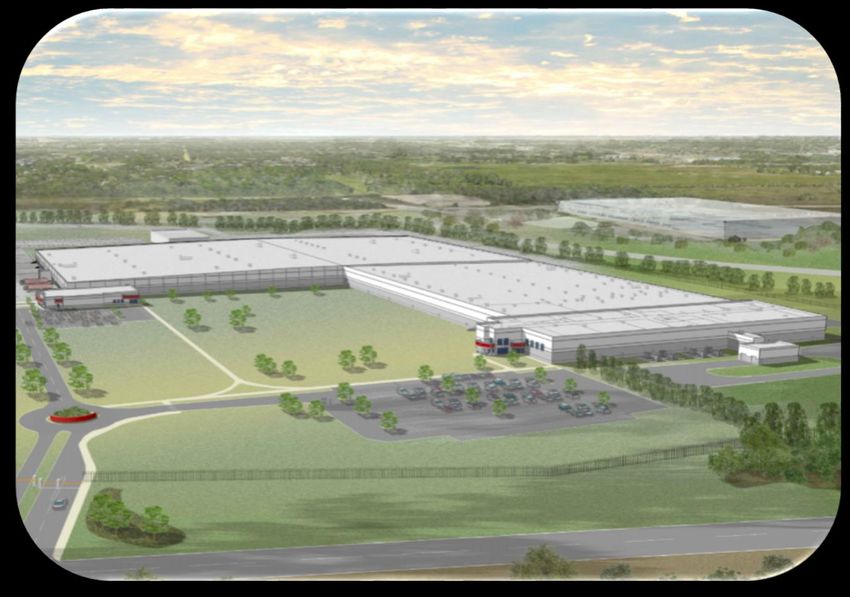
Best in class Corporate Governance

  • Majority shareholders only at Board level
  • Audit Committee comprised of independent members only
  • No transactions with related parties
  • A professional and independent Management Team          8
Our commitment to pursue value creation
opportunities for our shareholders

                                SSDs
                    New sparking beverage franchises

                             CORE
                             NARTD
                                                                           Stills
    Food & Snacks                                         Emerging still categories + Value added diary

                    NARTD: Non-alcoholic ready to drink                                                   9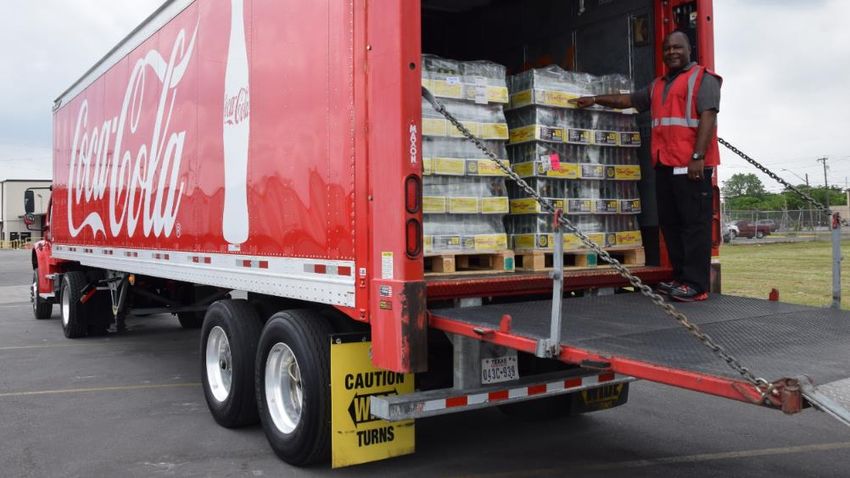
A wide brand portfolio to satisfy every
occasion of consumption

               + 28 Brands                +60 Brands
     2006      +   128 SKUs       2018    +1,500 SKUs

                                                        10
Strong presence in attractive markets…
MEXICO
USA
Start date: 1926
• Sales volume (MUC): 1,226 Start date: 2017
• % of KO volume: 33% • Sales volume (MUC): 443
• Population served (MM): 33 • % of KO volume: 12%
• Population served (MM): 32
ECUADOR
Start date: 2010
• Sales volume (MUC): 142
• % of KO volume:100%
• Population served (MM): 17
ARGENTINA
PERU Start date: 2008
• Sales volume (MUC): 130
Start date: 2015
• % of KO volume: 23%
• Sales volume (MUC): 278
• Population served (MM): 9
• % of KO volume: 100%
• Population served (MM): 32
____________________
MUC –Million Unit Cases
KO – The Coca-Cola Company 11…with a model that connects the entire
organization in order to reach the perfect
execution
Segmentation
METRICS
RGM
Picture of Success FUNDAMENTALS
RTM
Market Audit Customer
Love Score (CLS)
Digital Tools
People
12A sound financial position…
• Conservative net leverage Total Debt:
MXP$ 55.8 billion
level of 1.45x
48% 40% 13%
• 97% of debt denominated in Denominated in: MXP USD PEN
local currencies 73% 27%
• 73% of debt at a fixed rate, Rate: Fixed Variable
with an average cost of debt Cash Balance:
of 6.7% MXP$ 15.9 billion
• Long-term debt profile with 29% 64% 4% 3%
average maturity of 7 years Denominated in: MXP USD PEN ARS
____________________
13
*Using an exchange rate as of Dec 2018 of MXP $19.66…with balanced sources of revenue
SOLES
US ARS
DOLLARS 11% PESO • 45% of the company’s revenues
5% and 30% of EBITDA are
denominated in dollars
Revenue
45%
• Consolidated EBITDA in USD of
2018 around $475 MMD in 2019
39% MXN
• Raw materials needs in US
PESO
dollars of $270 MMD in Mexico
and $152 MMD in Peru
Mxp$ 159 billion 14Mexico
Maintaining positive trend in volume while
                increasing price
        Positive economic sentiment                                     Growing all the beverages portfolio
•   Consistent volume growth across all channels in 2018         •    Very positive trend in market share across all categories
    supported on strong market execution.
                                                                 •    Command #1 or #2 market leadership in most still categories
•   Mexico consumer confidence reaches record peak in
                                                                 •    Still beverages already represent 16% of total mix with 15
    February 2019 hitting its highest level on record.
                                                                      consecutive quarters of growth representing 53% of the total
•   This positive consumer outlook coupled with our execution         growth
    capabilities and strong brand portfolio positions us for a
    another year of volume growth.
                                                                                                        Powerade Market Share
                             Volume                                                                      vs Main Competitor(%)                                   100%
              8.3%                                                   85%                                                                                         80%
                                                                                                                                                     61%
                                                                                                                                                                 60%

                                                                                                                                                                 40%

                                                                     11%                                                                                         20%
                             2.6%          2.3%                                                                                                    36%
                                                                                                                                                                 0%
                                                                     2006   2007   2008   2009   2010    2011   2012   2013   2014   2015   2016   2017   2018

                                                                                                 Main Competitor                Powerade
                                                                                                                                                                        16
             2016           2017           2018
A flexible price-pack
architecture to drive
consumption and +25 SKUs only for regular Coke in Mexico
profitability MXP
$34
2.0
Ref 3.0
Pet NR
MXP 600
355 PET
ml
PACKAGE FORMAT $6 VR Retornable 66%
SINGLE SERVE No Retornable
NON RETURNABLE
$6 $6 $10 $13 $20 $25
32%
46%
54%
68% Low elasticity Protect affordability
SKU´s (multi-serve &
Returnable)
RETURNABLE MULTISERVE
Leverage on single serve presentations
17USA
CCSWB maintained focus on execution through
the Fundamentals
• Completed the first full year of CCSWB operating under the                     Oklahoma
  ACT model. This commercial strategy allowed us to:
    − Improve our trade execution and customer intimacy by                                   Dallas
      increasing face-to-face interactions.                        El Paso    Abilene
                                                                                                       Nacogdoches
    − Increase visit completion from 78% to 87%, and strike rate                        Fort Worth
      improved from 78% to 85%.                                              San Antonio
                                                                                             Houston

    − Increase our cold drink equipment in the Strike Zone
      placement by going from 33% in 2017 to 40% in 2018.                        McAllen         Gulfgate
• In 4Q18, CCSWB delivered its 7th consecutive quarter of
  net revenue growth of +2.9% vs PY, together with a
  continuous growth in value share above our competitors
  and the national average
• CCSWB delivered its 7th consecutive quarter of value share
  growth, finishing the year with a solid +0.8 percentage
  points vs prior year and a total of 32.9% value share, above
  the national average

                                                                                                              19
Improving execution at POS and
capitalizing synergies
Focus on better pricing Positive POS execution results
• Price in 2018 grew +3.4% vs PY achieving our target and • The ACT model will continue to be the backbone of our
securing rate above consumer inflation of 2%. execution strategy, delivering tailored strategies based on a
• We continued investing in developing our Go to Market customer segmentation and securing true rate increase
capabilities to ensure exceptional customer service while above consumer inflation
maintaining profitable growth
Volume Sales
0.8% 4.1%
1.0%
0.1%
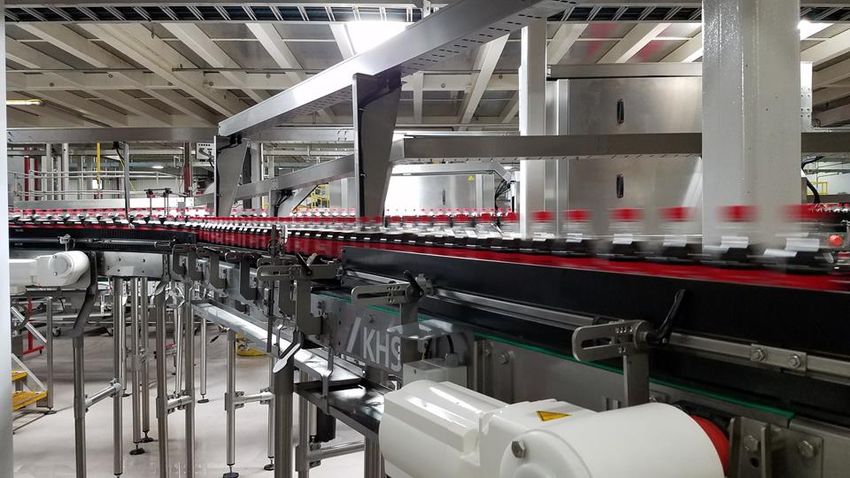
2017 2018 2017 2018 20CCSWB to build new plant in Texas
• Investment of US$250 million in a facility
close to 1 million square feet in size
• First Coca-Cola production plant built in
the U.S. in a decade
• New facility in Houston will utilize state-
the-art technology, with five new
production lines and in-line blow molding
capabilities
• Includes distribution facilities, warehouse
and sales, which will enable CCSWB to
efficiently serve the Southeast Texas
market
• Close to USD $30 million in cost
savings and operating efficiencies, as
part of the USD 90 million synergy Scheduled to begin
program.
operating in early 2020 21Detailed work plans for short and mid-term
identified synergies
Revenue: Savings:
• Vending • In-line blow molding (ILBM)
• Topo Chico • Direct Procurement
• Mexican Coke • Improvement in production lines
• Lightening of the PET bottles
• Reduction in freight costs
Strategic:
• New facility in Houston
• Shared Services
Synergies captured in 2018
USD$ 32 MMCapitalize uniqueness of the US market
Solid Base Continuous Improvement
ACT Model Operating Model
Fundamentals 3 MUs
Market Street Challenge 11 Regions
Prices 10 Plants
Tools Automation Specialized GTM
Top Line Growth Execution
New GTM FSOP Models
Volume Enabling Segmentation
Revenue Capabilities Investment
Value Share Analytics
E-Commerce
Recognized Leadership Collaboration
Customer Service
System Collaboration
Joint Business Plan
Community Engagement
+1 Mindset
PAC
Execution Strong Collaboration
23
Product QualityTopo Chico is now distributed in
our Red Truck across the USA
24
24Our journey to Advanced Analytics in the US
Plans underway to implement four Advanced Analytics
use cases in 2019
SKU upsell National & Local
Vending space & Fundamentals
trade promotion
service optimization recommendations “Why” Model
management
25Evolving the Way We Go To Market in USA
Customer Intimacy GTM 2.0 Optimize Visit Planning
Drink Equipment Tracking Vending Profitability GTM KPIs
85% 90%
79% 84%
Visit Strike Rate
Completion
26South America
Peru – Volume recovery and protecting
                 profitability
                 Offsetting volume impact                                        Maintaining profitability
• Leveraging the experience gained from past cases in Mexico and        • Leveraged by the price-pack strategy and a positive
  Ecuador allowed us to mitigate the impact of the increase in excise     performance of our vending business
  tax,                                                                  • Operative efficiencies with the consolidation of production in
• Solid volume growth in 4Q18 confirmed the recovery trend of the         Pucusana Plant and in distribution with the new meg
  last couple of quarters                                                 distribution center in Lima inaugurated in 2018
• Introduced in 2018 more than 30,000 coolers and more than
  900,000 returnable bottles                                                                      Cooler           EBITDA /
                                                                                   MUCs          Coverage            Sales
             Package                              Format
                                                                                                                       23%
                                                                                 278   278
                                                                                                       37%
                                                                                                                18%
            41%                                 28%
       Single-serve
                                             Returnable
                          59%                                                                    29%
                      Multi-serve                             72%
                                                                Non
                                                          Returnable

                                                                                 2015* 2018     2015* 2018      2015* 2018             28
Ecuador – Positive trend in volume and
pricing
Capturing market opportunities Focusing our efforts on 3 pillars
• Positive results in 2018 due to improvement in execution • Impulse stills category through launching of new products and
capabilities presentations
• Focus on RGM initiatives to improve the price per case • Strong expenses control that will continue bringing efficiencies in
2019
• Gained value share in 2018, despite weakening consumer
demand • Package Price strategy and innovations to increase volume
Cooler EBITDA /
MUCs Volume
Coverage (1) Sales
+3.7%
51%
142
17.3
17.0% % 2018
2016 2017
119
24%
-3.4%
-8.8%
2010* 2018 2010* 2018 2010* 2018 29Argentina – Focused on Fundamentals
in a challenging economic environment
Improving price pack architecture Leveraging on commercial capabilities
• Price-package architecture allowed us to pass-through most • Consumption have been severely impacted by a slowing
of the effect of high inflation rates economy, rising inflation and reduced disposable income.
• Focused on cost discipline and optimization. In 2018, we • Positive volume in 2018 outperforming the national results
captured significant savings as a result of the vertical • Gained value share in NARTD as we reinforced our two-fold
integration in cane sugar strategy to promote single-serve consumption and to increase
affordable, returnable presentations.
EBITDA / Format
Cooler Coverage Volume
Sales
64% 11%
Single-serve
+0.1%
21%
-1.1%
89%
Multi-serve
10% -6.8%
18%
2016 2017 2018
-8.8% 30
2008* 2018 2008* 2018 AC SystemFood and Snacks
A relevant player in the snacks industry…

        3rd most         #2 Brand       #1 Brand
       Important Brand   Metropolitan   in Ecuador*
          in Mexico      area of NY      *Baked Goods
                                        #2 Salty Snacks
                                                          32
…with high potential growth opportunity
based on strategic adjacencies
Around USD$ 380 MM Sales
Complementary to our core business
Expand snack business in Mexico under Bokados
and complements with Wise
Strengthen our presence in Mexico and the US
33Innovation at Arca
ContinentalWhy Advanced Analytics?
Arca Continental has a long-
standing culture of favoring data- Putting Big Data to work
driven decisions
Going from a mindset of viewing data as
something to be isolated, warehoused and
It has achieved a solid level of used for reporting, to a view that looks it as
1. PRODUCT AVAILABILITY
sophistication, in key commercial 2.raw
the COMMERCIAL EXCELLENCE
material for all decision making
capabilities
The explosion of available data
and computing power brings an
opportunity to take this effort to The desire to transform our business through
the next level ever-increasing internal and external data,
delivering value and creating a sustainable
competitive advantage
In this context, Advanced
Analytics is a key capability to
drive growth, profitability, and
maintain competitive advantage
35Understanding key variables to drive growth
“Why Model”
175 Variables 93 Variables 11 Sets of 3 Categories
Variables
Price Gap Sales Visits
Promotion & Advertising New Customer Economic
Price Change Performance Environment
Holiday and Service Indicators High Temperature
Weekend Stockup RED Improvement Weather
19% 16% 10% 2% 14% 3% 11% 7% 4% 4% 4%
Findings
FINDINGS Actions
ACTIONS
Identify key variables of overall performance and Price Religion and Fundamentals
build a scorecard, also differences between Arca
Continental´s Markets We strengthen our price religion in territories with high
price elasticities and build our fundamentals (KPI´s)
36Concrete use cases to apply analytics to
improve execution at the point of sale
1. PRODUCT AVAILABILITY 2. COMMERCIAL EXCELLENCE
Forecast non-availability of Quantify the effect of each
products by SKU and create a execution variable by POS and
"suggested order“ by POS prioritize it
Out of stock Volume sales
in POS increase
1-2 p.p. 2-3%
37Improving sales performance in traditional
channel with technification
Customer Benefits
• Increases traffic, sales and profits
• Additional income from e-payments
• Competitive advantage
• Improving store activation
• Adding Web-enabled POS
AC Benefits
Customers Sales
increase • Sales information on all categories
2018 • Customer insights
• Discounts Control
~5K 3% 38Financial Performance
Investments focused on incremental revenue
initiatives
  •   New Plants
  •   Coolers                                                     2%
                                                 10%      6%
  •   Returnable Bottles
                                         10%
  •   Vending Machines
  •   IT
                                                                    38%
  •   Production Lines
  •   Trucks                               34%

       CAPEX 2019e
   ~7-8% of Sales           Complementary US     Mexico    Peru   Ecuador Argentina
                               Business                                               40
Conservative debt profile & diversified
maturity schedule…
AC Debt Maturity Profile PEN
Total Debt: MXP$ 55,827 million USD 13%
7,863 7,863
6,860 6,756 6,388
5,843
40% MXP
5,663
By
Currency Variable
2,651
2,154 2,314 48%
1,474 27%
By
2019 2020 2021 2022 2023 2024 2025 2026 2027 2028 2029 2030 2031 2032
USPP Bonds Bank loans
Interest Rate
• 97% debt is in local currency
• Projected debt profile with average maturity of 7 years Fixed 73%
____________________
41
*Using an exchange rate as of Dec 2018 of MXP $19.66…with the highest credit rating among Mexican
issuers
Global Scale Net Debt / EBITDA
1.85
“A2” “A” 1.28
1.45
1.16
National Scale
“AAA(mex)” “mxAAA”
2015 2016 2017 2018
Global Investment Grade above Mexico’s
sovereign rating Financial flexibility and low leverage ratio 42Social Responsibility
Strong commitment towards our environment

                                 RECYCLING                   WATER*                    ENERGY*
                                  Mexico 2017

                      28%                   of PCR   1.7      Water Lts. /
                                                              Beverage Lts.     25.8        g CO2/
                                                                                            Beverage Lts.

                   51,049 Tons                       17% improvement          11% energy reduction
                   of resin produced by PetStar               vs 2010                  vs 2010

             Mexico is the global leader in           Leader in water reuse       25% from renewable
                  recycled resin use                      technology                    sources
____________________                                                                                        44
*2017 data for AC consolidated
Key investment highlights
Key investment highlights
Global leader… One of the largest Coca-Cola bottlers in the world with
a leading profitability in the KO System
Resilient and defensive industry
…in the right markets…
Strong presence in attractive markets
Highly diversified and well-balanced geographic
…the right products… presence with a wide product portfolio and
distribution channels
Proven track record of disciplined growth
…and a disciplined growth
strategy Strategic business model that connects the entire
organization in order to optimize execution
45Outlook for 2019
Consolidated volume growth in 2019 of ~2%, on a comparable
basis
Price in line with inflation at each of our operations, while
ensuring affordability of our products
Plan to invest 7-8% percent of total sales in CAPEX in 2019
Target $90 million dollars in annual synergies by 2020 in CCSWB
46TH A N K YOU ! Investor Relations Contact Information: Ulises Fernandez ulises.fernandezdelara@arcacontal.com Felipe Barquin felipe.barquin@arcacontal.com Pamela Ortiz pamela.ortizsa@arcacontal.com Francisco Leyva franscisco.leyvaa@arcacontal.com
You can also read