Creating Tomorrow's Today - Investor Presentation - Kaman Corporation
←
→
Page content transcription
If your browser does not render page correctly, please read the page content below

Creating Tomorrow’s
            Today

Investor Presentation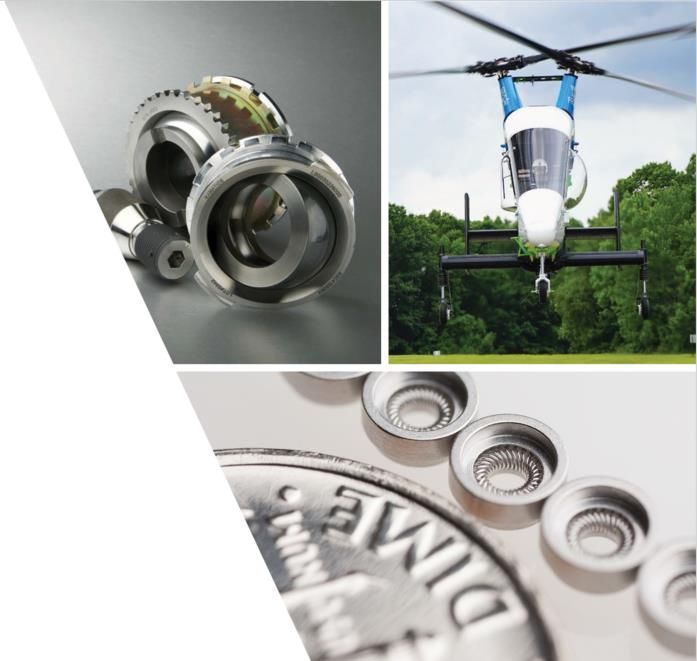
Forward Looking Statements
   FORWARD-LOOKING STATEMENTS
   This presentation includes "forward looking statements" relating to the announced transactions and future operations of
   the Company, which can be identified by the use of words such as “will,” “expect,” “poise,” “believe,” “plans,” “strategy,”
   “prospects,” “estimate,” “project”, “seek,” “target,” “anticipate,” “intend,” “future,” “likely,” “may,” “should,” “would,”
   “could,” and other words of similar meaning in connection with a discussion of future operating or financial performance
   or events. Forward-looking statements also may be included in other publicly available documents issued by the Company
   and in oral statements made by our officers and representatives from time to time. These statements are based on
   assumptions currently believed to be valid but involve significant risks and uncertainties, many of which are beyond our
   control, which could cause our actual results to differ from those expressed in the forward looking statements. Such risks
   and uncertainties include, among others, the ability to implement the anticipated business plans following closing and
   achieve anticipated benefits and savings; and future and estimated revenues, earnings, cash flow, charges, cost savings and
   expenditures. Additional risks and uncertainties that could cause our actual results to differ from those expressed in the
   forward looking statements are identified in our reports filed with the SEC, including our Quarterly Reports on Form 10-Q,
   our Annual Reports on Form 10-K, and our Current Reports on Form 8-K. The forward looking statements included in this
   presentation are made only as of the date of this presentation, and the Company does not undertake any obligation to
   update the forward looking statements to reflect subsequent events or circumstances.

   Non-GAAP Figures
   Management believes that the Non-GAAP financial measures (i.e. financial measures that are not computed in accordance
   with Generally Accepted Accounting Principles) identified by an asterisk (*) used in this presentation or in other disclosures
   provide important perspectives into the Company's ongoing business performance. The Company does not intend for the
   information to be considered in isolation or as a substitute for the related GAAP measures. Other companies may define
   the measures differently. Reconciliations from GAAP measures to the Non-GAAP measures are presented herein.

2021 Investor Deck                                                                                                            2
Our strategy continues to be focused on
              engineered products, prioritizing a culture
               of innovation to develop new solutions
                   that address complex customer
                             challenges

2021 Investor Deck                                          3
Recent Highlights
Full year 2020 performance benefited from diversified product portfolio providing offset to
continued weakness in commercial aviation
Key Highly disciplined in our application of COVID-19 policies and procedures
Messages Strong balance sheet and significant available capacity under our revolving credit facility
Delivered realized cost savings of approximately $26 million in 2020 with continued focus on cost
control
Net sales from continuing operations of $784.5 million; Gross Margin of 31.3%
2020 Financial
Adjusted EBITDA from continuing operations* up 4% to $102.9 million or 13.1% of sales
Performance
(from continuing operations) Adjusted earnings from continuing operations* increased to $58.5 million
Adjusted diluted earnings per share from continuing operations* increased 29% to $2.11
2021 Investor Deck 4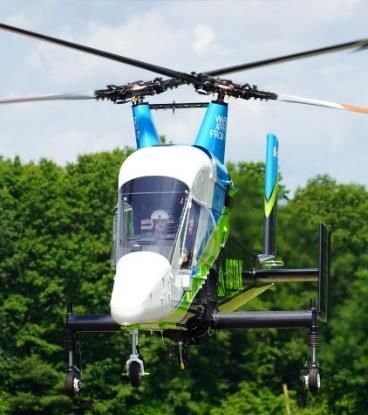
Diversified Portfolio

                           Actual Full Year 2020                           Consolidated Sales
                           Sales By End Market
                                                    OEM                                          88%
                     55% Defense
                                                    Aftermarket                                  12%
                           Commercial, Business &
                     28%                            Commercial, Business & General Aviation
                           General Aviation
                                                              Sales 28% of Total

                     9% Medical                     Boeing & Airbus                              35%
                                                    (Commercial Aviation)(direct and indirect)

                                                    All Other                                    65%
                     8% Industrial and Other        (Business & General Aviation)

2021 Investor Deck                                                                                     5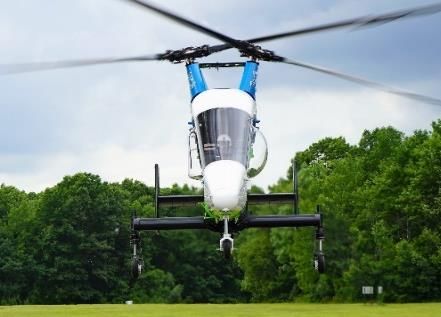
Meaningful Long Term Growth
Diverse End Market Exposure with Meaningful Long Term Growth
Platform /
Long Term Growth Drivers
End Markets
Defense exposures provide stability and growth opportunities
Continue to identify new opportunities on key defense programs, such as Future
Vertical Lift, the Joint Strike Fighter, Columbia Class Submarine, while extending the
Defense lives of existing programs
Breadth of content on a wide range of fixed wing and rotary wing aircraft
Continued investment in R&D through the downturn
Commercial, Business & General Aviation Positioned to capture share from the COVID-19 market recovery
Increasing medical needs of the aging population
Increasing biopharma capital budgets
Medical Strong technical advances and product development pipelines
Increasing number of robotics applications due to 5G adoption and artificial
intelligence
Industrials Maintenance, replacement, and upgrade of industrial equipment
2021 Investor Deck 6
Strategic Priorities

                   Strategically Focused on Highly Engineered Products,
                Generating Higher Margins with Strong Free Cash Flow Profile

           Growth through              M&A and Capital                Operational
             Innovation                  Allocation                   Excellence
         Accelerate internal           Expand capabilities          Deploy operations
         investments in our          through accretive M&A         excellence model to
         products, facilities,          while maintaining a           drive financial
             and people              disciplined approach to     performance positioning
                                      the return of capital to       the company for
                                           shareholders           significantly improved
                                                                        profitability

2021 Investor Deck                                                                    7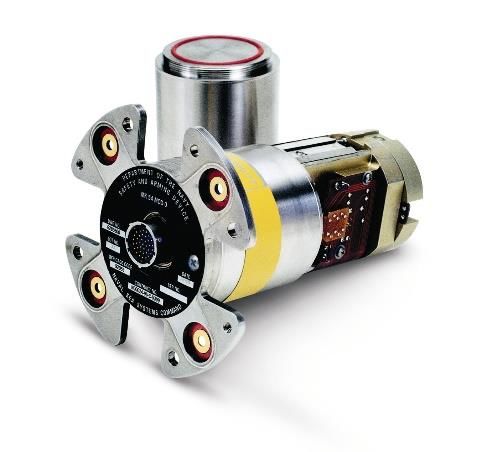
Growth through Innovation
     Designing new solutions to solve our customers’ toughest challenges

                            Evolving requirements
       Developing Next                               Innovative Material    Enabling Advanced
                                    of our
      Generation Munition                              Science for new      Neuro Stimulation
                             K-MAX® operators:
        Technologies:                               engineered products:     Implant Devices
                              Next Generation
       Height of Burst                               Titanium Diffusion       Micro Spring
                             Unmanned Aircraft
           Sensor                                        Hardening         Contact Technology
                                  Systems

                     Collaborating to create integrated solutions;
                          Leveraging multiple technologies
2021 Investor Deck                                                                              8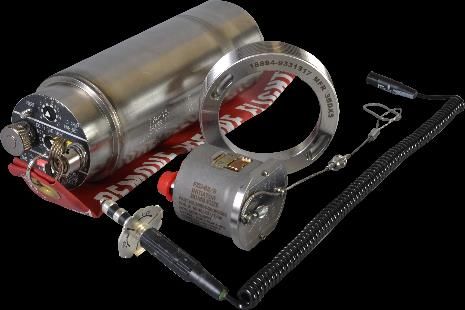
Disciplined Approach to M&A Assessment
Primary M&A Criteria
Technical leadership position in the markets they serve
Exposure to high-growth end markets with global macro tailwinds
Strong margins and cash flows from highly engineered proprietary product portfolio
Attractive financial profile with meaningful synergy opportunities
Maintain existing financial discipline while ensuring appropriate returns on investments
Execute accretive M&A aligned with our core strategy
2021 Investor Deck 9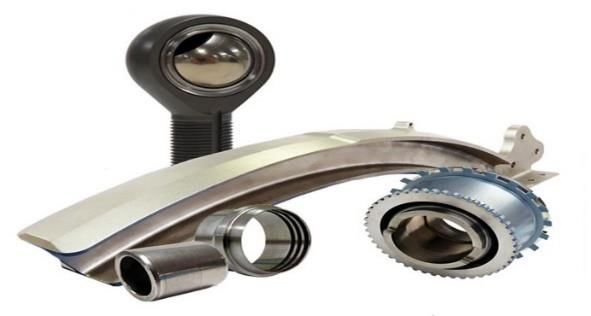
Proven Track Record of Portfolio Reshaping

    Long history of portfolio reshaping to drive growth and improve margin profile

                     1950s                    1970s              1997                        2015                    2020
                     Founded                  Launched           Divested               Expanded our
                                                                                                                                          Looking
                                                                                                                     Acquired
                     Kaman Nuclear            Distribution and    Kaman            engineered product                 Bal Seal
                     for                      grew business      Sciences            offerings with the            Engineering
                     diversification          through various
                                              acquisitions
                                                                                        acquisitions of
                                                                                      GRW and Extex                                        Ahead
1945 1950               1960           1970        1980           1990         2000          2010           2019    2021               Focus on our leading
                                                                                                                                       engineered solutions
                                                                                                                                          product portfolio
       1945                    1960s                       1980s                2007              2019                    2021        through a combination
       Kaman                   Founded Kamatics and        Entered the
                                                           fuzing
                                                                               Divested Divested Kaman
                                                                                             Distribution
                                                                                                                      Divested U.K.
                                                                                                                       Composites
                                                                                                                                       of organic growth and
       Aircraft                Kaman Music                                  Kaman Music
       Corporation                                         business                                                                            M&A
       founded as              Formed Kaman
       a Helicopter            Sciences out of Kaman
       company                 Nuclear, AviDyne,
                               Kaman Systems
                               Centers, and SEA
2021 Investor Deck                                                                                                                                       10
Operational Excellence
Focusing our attention on improving performance across these metrics
EBITDA Free Cash Return on
Margin Flow Conversion Invested Capital
Redesigned and Rolled Out Our
New Operations Excellence Model to Drive Improvement
2021 Investor Deck 11Capital Deployment Framework
Total Capital Deployed of Approximately $850 million Capital Deployment Priorities Moving Forward
Since 2015
Prioritizing value creating investments;
high return internal investments and
~$500
strategic acquisitions
Return of capital to shareholders
Focus on Leverage
Long term leverage target of 2x – 3x
2021 Investor Deck 12Highly Engineered Product Offerings
Traditional High Precision Engine High Precision
Self Lubricating Flexible Drive
Airframe Miniature Aftermarket Seals, Springs &
Bearings Systems
Bearings Bearings Components Contacts
Products
Proprietary Proprietary
Karon® Self Patented and FAA Parts
Custom Design design, design,
Lubricating Proprietary Manufacturing
Differentiator Machinable Liner
Capability
technology
machining, and
Authorization
machining, and
assembly assembly
Aerospace,
Industrial, Marine, Medical, Medical,
End Markets Hydropower, Aerospace Rotorcraft Industrial, Aerospace Industrial,
Space, Aerospace Aerospace
Aftermarket
Broad Range of Premier Engineered Products Serving Diverse End Markets
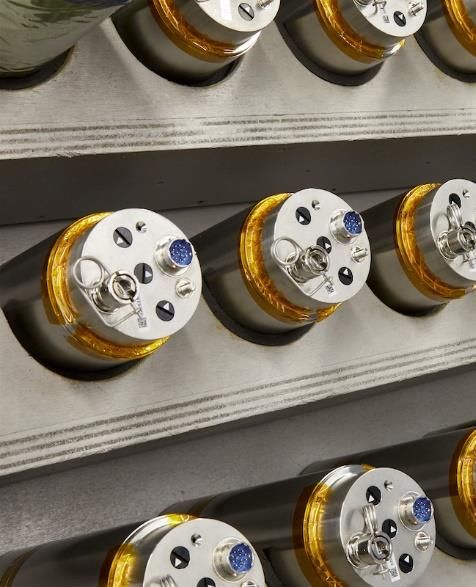
2021 Investor Deck 13Advanced Safe and Arm Devices
Broad Portfolio of Safe and Arm devices Safe and Arm Sales and Backlog
Joint Programmable Fuze Tomahawk ATACMS
Harpoon SLAM-ER Standard $500
Maverick JASSM/LRASSM AMRAAM
$400
$255
$254.6
$300
$200 $228 $248
$185 $196
$100 $164
$-
2016 2017 2018 2019 2020
Sales Backlog
Highlight on JPF
Completed negotiation of Option 15 & 16 of USG contract in JPF Deliveries Average
(units)
2020; $57.3 million order received under Option 15 60,000
Delivery levels in 2021 in line with historical averages 40,000
Removed anticipated JPF DCS order from 2021 due to 20,000
uncertainty caused by change in Presidential administration
0
Working with customers to identify new opportunities 2012 2013 2014 2015 2016 2017 2018 2019 2020 2021
14
2021 Investor DeckProprietary K-MAX® Platform Provides Growth
Strong Support for K-MAX® Aircraft Pursuing the Future of Unmanned Lift
• Aircraft meets the
diverse needs of our
customers
• Construction
• Firefighting
• Logging
• Humanitarian Aid
• Agricultural
• Expanding markets - new
international certifications
• Four aircraft sales expected Pioneer in repetitive unmanned lift with proven
in 2021 track record of operations in the field
• Increased service & support
Working with USMC on shaping
revenues in 2021
unmanned cargo lit requirements
• Expected fleet size of 45
aircraft by end 2022 Continued progress on development of
commercial UAS technology development
2021 Investor Deck 15Diverse Supplier of Key Structural Components
Broad Range of Programs Across Critical End Markets
Medical A-10 Thunderbolt Blackhawk Commercial AH-1Z
Imaging Beds Wing Assemblies Cockpit Engine OEM Precision Details
Continued Focus on Operational Excellence and Financial Performance
Steadily Improving financial Expanding market opportunities on
performance new platforms and technologies
Customer Recognition as Balanced portfolio across a broad
a Leading Supplier range of platforms
2021 Investor Deck 16Premier Global Customer Base 2021 Investor Deck 17
Our Manufacturing Footprint

                                                                                                          12   13
                                                                                                          11
                      2                                 7
           1                        4                   9 10
                  3

                                                    5
                          6
                                                    8

                                                                                                                                                                 14

                              = Low cost facility

      1.       Foothills Ranch, CA                             5.   Jacksonville, FL        9.  Middletown, CT                  12. Rimpar, Germany
               Seals, Springs, and Contacts                         Assembly & Metallic           o Safe and Arm Devices            Precision miniature bearings
      2.       Colorado Springs, CO                                 Structures                    o Memory and                  13. Pracatice, Czech Republic
               o Springs and Contacts                          6.   Chihuahua, Mexico                  Measuring                    Precision miniature bearings
               o Measuring                                          Metallic Structures     10. Bloomfield, CT
                                                                                                  o Air Vehicles                14. Goa, India (Joint Venture)
      3.       Gilbert, AZ                                     7.   Bennington, VT                                                  Composites structures
               Aftermarket Components                                                             o Self-lubricating bearings
                                                                    Composites Structures         o Flexible drive shafts
      4.       Wichita, KS                                     8.   Orlando, FL             11. Hochstadt, Germany
               Composites Structures                                Safe and Arm Devices        Traditional airframe bearings

2021 Investor Deck                                                                                                                                                    18
Questions 2021 Investor Deck 19
Non-GAAP Reconciliations

2021 Investor Deck                              20
Non-GAAP Reconciliation
   Organic Sales
   Organic Sales is defined as "Net Sales" less sales derived from acquisitions completed during the preceding twelve months. We believe that this measure provides management and investors with a more
   complete understanding of underlying operating results and trends of established, ongoing operations by excluding the effect of acquisitions, which can obscure underlying trends. We also believe that
   presenting Organic Sales enables a more direct comparison to other businesses and companies in similar industries. Management recognizes that the term "Organic Sales" may be interpreted differently
   by other companies and under different circumstances. No other adjustments were made during the three-month and twelve-month fiscal periods ended December 31, 2020 and 2019, respectively.

   Adjusted EBITDA from Continuing Operations
   Adjusted EBITDA from continuing operations is defined as earnings from continuing operations before interest, taxes, other expense (income), net, depreciation and amortization and certain items that are
   not indicative of the operating performance of the Company's for the period presented. Adjusted EBITDA from continuing operations differs from earnings from continuing operations, as calculated in
   accordance with GAAP, in that it excludes interest expense, net, income tax expense, depreciation and amortization, other expense (income), net, non-service pension and post retirement benefit expense
   (income), and certain items that are not indicative of the operating performance of the Company for the period presented. We have made numerous investments in our business, such as acquisitions and
   capital expenditures, including facility improvements, new machinery and equipment, improvements to our information technology infrastructure and ERP systems, which we have adjusted for in Adjusted
   EBITDA from continuing operations. Adjusted EBITDA from continuing operations also does not give effect to cash used for debt service requirements and thus does not reflect funds available for
   distributions, reinvestments or other discretionary uses. Management believes Adjusted EBITDA from continuing operations provides an additional perspective on the operating results of the organization
   and its earnings capacity and helps improve the comparability of our results between periods because it provides a view of our operations that excludes items that management believes are not reflective
   of operating performance, such as items traditionally removed from net earnings in the calculation of EBITDA as well as Other expense (income), net and certain items that are not indicative of the
   operating performance of the Company for the period presented. Adjusted EBITDA from continuing operations is not presented as an alternative measure of operating performance, as determined in
   accordance with GAAP. No other adjustments were made during the three-month and Twelve-month fiscal periods ended December 31, 2020 and 2019..

   Adjusted Earnings from Continuing Operations and Adjusted Diluted Earnings Per Share from Continuing Operations
   Adjusted Earnings from Continuing Operations and Adjusted Diluted Earnings per Share from Continuing Operations are defined as GAAP "Earnings from Continuing Operations" and "Diluted earnings per
   share from continuing operations", less items that are not indicative of the operating performance of the business for the periods presented. These items are included in the reconciliation below.
   Management uses Adjusted Earnings from Continuing Operations and Adjusted Diluted Earnings per Share from Continuing Operations to evaluate performance period over period, to analyze the
   underlying trends in our business and to assess its performance relative to its competitors. We believe that this information is useful for investors and financial institutions seeking to analyze and compare
   companies on the basis of operating performance. The following table illustrates the calculation of Adjusted Earnings from Continuing Operations and Adjusted Diluted Earnings per Share from Continuing
   Operations using “Earnings from Continuing Operations” and “Diluted earnings per share from continuing operations” from the “Consolidated Statements of Operations” included in the Company's Form 10-
   K filed with the Securities and Exchange Commission on February 25, 2021.
   Adjusted Free Cash Flow
   Adjusted Free Cash Flow from continuing operations - Adjusted Free Cash Flow from continuing operations is defined as GAAP “Net cash provided by (used in) operating activities from continuing
   operations” in a period less “Expenditures for property, plant & equipment” in the same period and any adjustments that are representative of the Company's cash generation or usage in the period. For
   2021 we will adjusted free cash flow to remove the cash payment made to Bal Seal employees under the retention plan established by the former owners of Bal Seal. Management believes Free Cash
   Flow from continuing operations and Adjusted Free Cash Flow provides an important perspective on our ability to generate cash from our business operations and, as such, that it is an important financial
   measure for use in evaluating the Company's financial performance. Free Cash Flow from continuing operations and Adjusted Free Cash Flow should not be viewed as representing the residual cash flow
   available for discretionary expenditures such as dividends to shareholders or acquisitions, as it may exclude certain mandatory expenditures such as repayment of maturing debt and other contractual
   obligations. Management uses Free Cash Flow from continuing operations and Adjusted Free Cash Flow internally to assess overall liquidity.
2021 Investor Deck                                                                                                                                                                                            21
Non-GAAP Reconciliation
                                                                                            For the Three Months Ended              For the Twelve Months Ended
   Organic Sales
                                                                                         December 31,        December 31,        December 31,         December 31,
                       (in thousands)                                                        2020                 2019               2020                 2019
                       Net Sales From Continuing Operations                            $          185,288 $            237,792 $          784,459 $            761,608
                       Acquisition Sales                                                            16,516                   -              76,965                   -
                       Organic Sales                                                   $          168,772 $            237,792 $          707,494 $            761,608
                       $ Change                                                        $          (69,020)                     $          (54,114)
                       % Change                                                                    (29.0)%                                  (7.1)%
                                                                                                            For the Three Months Ended                  For the Twelve Months Ended
 Adjusted EBITDA from Continuing Operations
                                                                                                       December 31,            December 31,         December 31,           December 31,
          (in thousands)                                                                                   2020                    2019                 2020                   2019
          Net Sales From Continuing Operations                                                     $              185,288 $             237,792 $             784,459 $             761,608

          (Loss) earnings from continuing operations, net of tax                                   $            (31,420) $               34,105 $            (70,434) $              56,446
          Interest Expense, net                                                                                    4,888                  2,607                19,270                17,202
          Income Tax Expense                                                                                     (6,708)               (19,103)               (7,730)              (15,859)
          Non-service pension and Post-Retirement Expense                                                        (4,062)                    (98)             (16,250)                 (396)
          Other expense (income), net                                                                              (304)                      58                (728)                 (309)
          Depreciation and Amortization                                                                           11,695                  6,546                43,899                25,854
          Other Adjustments
                   Non-cash, non-tax impairment charges                                                          36,285                       -               86,592                       -
                   Restructuring and severance costs                                                                539                  1,005                  8,359                 1,558
                   Cost associated with corporate development activities                                            207                  7,097                  4,539                10,090
                   Bal Seal acquisition costs                                                                        45                       -                 8,506                      -
                   Expenses associated with Bal Seal purchase accounting                                          5,704                       -               25,169                       -
                   Transition service agreement cost, net of transition service agreement income                    397                    790                  4,076                 1,000
                   Senior Leadership Transition Costs                                                                  -                      -                   280                      -
                   Reversal of prior year accruals in current period                                                   -                      -               (2,123)                      -
                   Loss (Gain) on sale of U.K Tooling business                                                         -                 3,739                  (493)                 3,739
          Adjusted EBITDA from Continuing Operations                                               $             17,266 $               36,746 $             102,932 $               99,325
                    Adjusted EBITDA Margin                                                                         9.3%                  15.5%                 13.1%                  13.0%
2021 Investor Deck                                                                                                                                                                             22
Non-GAAP Reconciliation
Adjusted Earnings from Continuing Operations and Adjusted Diluted Earnings Per Share from Continuing Operations
For the three months ended December 31, 2020
Adjustments to Tax Effect of Adjustments to Calculation of
Net Earnings, Adjustments to Net Earnings, Adjusted Diluted
(in thousands, expect per share amounts) Pre Tax Net Earnings Net of Tax Earnings Per Share
Net loss from continuing operations $(31,420) $(1.13)
Adjustments
Non-cash non-tax impairment charge $36,285 $- $36,285 $1.31
Restructuring and severance costs 539 123 416 0.01
Cost associated with corporate development activities 207 47 160 0.01
Bal Seal acquisition costs 45 10 35 0.00
Expenses associated with Bal Seal purchase accounting 5,704 - 5,704 0.21
Transition service agreement cost, net of transition service agreement income 397 91 306 0.00
Adjusted earnings from continuing operations $11,486 $0.41
Weighted Average Shares Outstanding – Diluted 27,735
For the twelve months ended December 31, 2020
Adjustments to Tax Effect of Adjustments to Calculation of
Net Earnings, Adjustments to Net Earnings, Adjusted Diluted
(in thousands, expect per share amounts) Pre Tax Net Earnings Net of Tax Earnings Per Share
Net loss from continuing operations $(70,434) $(2.54)
Adjustments
Non-cash non-tax impairment charge $86,592 $- $86,592 $3.13
Restructuring and severance costs 8,359 1,911 6,448 0.23
Cost associated with corporate development activities 4,539 1,038 3,501 0.13
Bal Seal acquisition costs 8,506 1,904 6,602 0.24
Expenses associated with Bal Seal purchase accounting 25,169 527 24,642 0.88
Transition service agreement cost, net of transition service agreement income 4,076 932 3,144 0.11
Senior leadership transition 280 64 216 0.01
Reversal of employee related tax matter in foreign operations (2,123) (244) (1,879) (0.07)
Gain on sale of UK Tooling Business (493) (123) (370) (0.01)
Adjusted earnings from continuing operations $58,462 $2.11
Weighted Average Shares Outstanding – Diluted 27,723
2021 Investor Deck 23You can also read


