Investment Themes Portfolio Construction in Times of the Coronavirus
←
→
Page content transcription
If your browser does not render page correctly, please read the page content below
Investment Themes
Portfolio Construction in Times of the Coronavirus
2nd Quarter, 2020
Views expressed are as of the date indicated, based on the information
available at that time, and may change based on market and other
conditions. Unless otherwise noted, the opinions provided are those of
the author(s) and not necessarily those of Fidelity Investments or its
affiliates. Fidelity does not assume any duty to update any of the
information.
Not FDIC Insured May Lose Value No Bank Guarantee
For Investor Use l © 2020 FMR LLC. All rights reserved.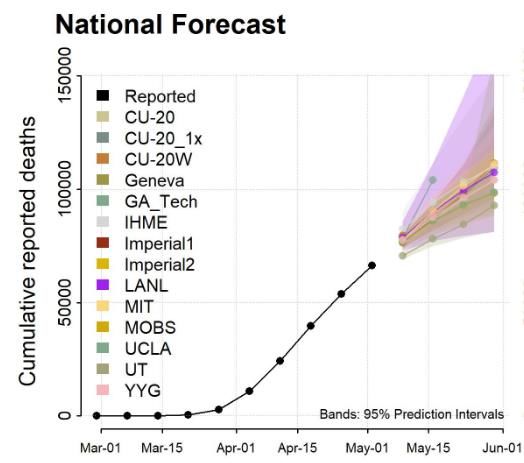
The News Flow is going to stay, at best, mixed for a while

                •      While the number of new cases is leveling off, the number of
                       total cases and deaths is going to rise further
                •      First Quarter Profit announcement have been weak, Q2 is
                       likely to be worse.
                •      Unemployment is going to rise further
                •      Drop in economic output for Q2 is going to be unprecedented

2   For Investor Use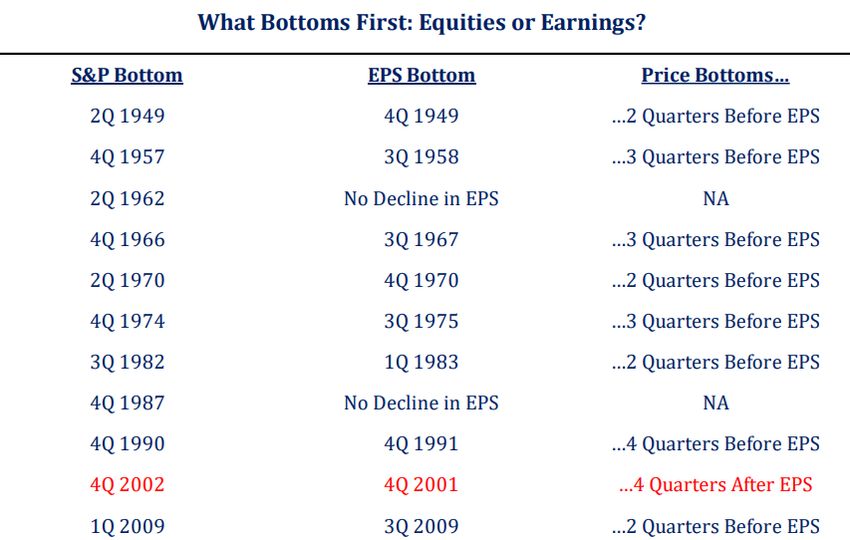
The Equity Markets usually do recover before the news flow
    gets better

                “Finally, be aware that the market does not turn when it sees
              light at the end of the tunnel. It turns when all looks black, but
                       just a subtle shade less black than the day before.”

                                     Jeremy Grantham (2009)

3
    For Investor Use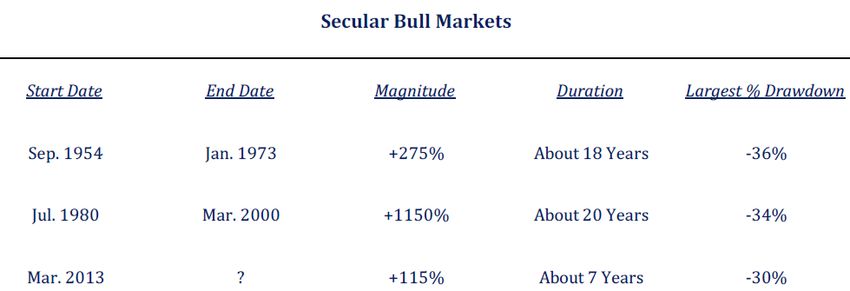
On average, stock prices have bottomed about 2 quarters
    before Earnings (2002 being the only exception of note)

    Past performance is no guarantee of future results. It is not possible to invest directly in an index. All market indices are unmanaged.
    Source: Strategas, as of 04/29/2020
4   For Investor Use
And the elements of a viable short-term stabilization path are
coming together while long term solutions are developed
Contact Social
Tracing Distancing
Warmer Short term: Possible
More Testing Long-term Solutions…
Weather Mitigate loss of
human life & ▪ Vaccine
damage to ▪ Herd Immunization
economy ▪ Successful Treatment
Fiscal Incremental
Stimulus progress in
treatment
Monetary
Stimulus
5 For Investor UseWhile we have been able to stabilize new cases, the
future path of the virus remains uncertain
CU-20, CU-20-1x, CU-20W (Columbia University – Models are based on assumptions about how levels of social distancing will change in the future); Geneva (University of Geneva);
GA_Tech (Georgia institute of Technology); IHME (Institute of Health Metrics & Evaluation); Imperial 1, Imperial 2 (Imperial College, London); LANL (Los Alamos National Laboratory); MIT
(Massachusetts institute of Technology); MOBS (Laboratory for the Modeling of Biological + Socio-technical Systems); UCLA (University of California, Los Angeles); UT (University of
Texas, Austin); YYG (Youyang Gu)
Source: https://www.cdc.gov/coronavirus/2019-ncov/covid-data/forecasting-us.html , as of 05/12/2020
6 For Investor UseFrom an equity perspective, the next big move is likely to be
virus dependent
YTD S&P 500 Performance
Index reached its
highest point on
Feb 19th
“V” If we find a medical solution
that gets us to an “acceptable”
mortality rate
Trading-range while we slowly
bring the economy back and
wait for a vaccine
“W” if we get hit by major set-
back and/or a “second-wave”
Past performance is no guarantee of future results. It is not possible to invest directly in an index. All market indices are unmanaged. Index performance is not meant to represent that
of any Fidelity mutual fund.
Source: Factset, as of 05/12/2020
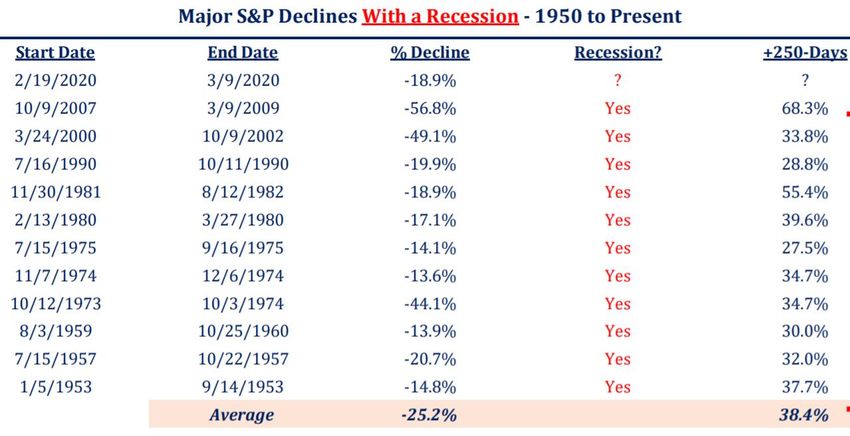
7 For Investor UseThe long-term outlook, looks a little bit more promising from
a historic perspective (provided we will have a vaccine)
Past performance is no guarantee of future results. It is not possible to invest directly in an index. All market indices are unmanaged.
Source: Strategas, as of 03/13/2020
8 For Investor UseIt might make sense to have the three elements in your
portfolio that can help address each possible Scenario
YTD S&P 500 Performance
Index reached its
highest point on
Feb 19th
“Offense”
“Income”
“Defense”
Past performance is no guarantee of future results. It is not possible to invest directly in an index. All market indices are unmanaged. Index performance is not meant to represent that
of any Fidelity mutual fund.
Source: Factset, as of 05/12/2020
9 For Investor UseFor this, consider a “Barbell Approach” with an Income
component
Offensive Defensive
investments investments
Income investments
Seek to generate
Risk On – To take advantage
income while market
of an eventual recovery Risk –Off: Core bonds to
remains range-bound
focusing on areas that stabilize and diversify your
should benefit most: portfolio in case the equity
Developed International and market drops further.
US Large Cap Growth.
10 For Investor UseYear to date, this example has mitigated losses
Bloomberg Barclays US Aggregate S&P 500 60% S&P : 40% US AGG
110
US Aggregate
105 104.20
60% S&P,
100
40% US AGG
portfolio
95 96.48
90 91.33
85
S&P 500
80
75
70
65
60
Past performance is no guarantee of future results. It is not possible to invest directly in an index. All market indices are unmanaged.
Diversification does not ensure a profit or guarantee against a loss. For illustrative purposes only.
Source: Factset, as of 05/11/2020
11 For Investor UseTactically, Active and Passive Outperformance Varies Over
Time for Equities but Active often wins during Recessions
U.S. LARGE CAP BLEND AVERAGE ROLLING ONE-YEAR RETURNS (%)
Active (no filters) - Passive (no filters)
Active Energy Savings & Dot-Com Subprime
12
Wins Crisis Recessions Loan Crisis Bust Mortgage Crisis
10
8
6
4
2
Percent
0
-2
-4
-6
-8
-10
Apr-79
Dec-80
Apr-84
Dec-85
Apr-89
Dec-90
Apr-94
Dec-95
Apr-99
Dec-00
Apr-04
Dec-05
Apr-09
Dec-10
Apr-14
Dec-15
Apr-19
Aug-77
Aug-82
Aug-87
Aug-92
Aug-97
Aug-02
Aug-07
Aug-12
Aug-17
Passive
Wins
Note: The passive group represented consisted of a single fund through 1985, though it is believed that the number of funds is not material given that passive managers, unlike active
managers, perform in sync with each other over different economic environments and market cycles.
Past performance is no guarantee of future results. It is not possible to invest directly in an index. All market indices are unmanaged.
See appendix for additional important information and methodology. The equal-weighted average rolling one-year returns, net of expense ratios, for all active mutual funds and ETFs in
the U.S. large cap blend category with the U.S. as the exchange country, excluding enhanced index funds, were calculated monthly. Then, passive return was subtracted from active
return each month. No filter was used this chart. Gray bars indicate periods of U.S. recessions.
12 For Investor UseActive management has done well so far in 2020’s volatility
Between 54-68% of active US Domestic and DM ex-US funds have beat their respective
benchmarks since the US Equity Market peaked in February
Performance from Market Peak through LTD
(2/20/2020 - 5/7/2020)
1.30 Active Wins
1.10
DM ex-US
US Small-caps
Excess Returns (bps)
0.90
0.70
EM Equity
0.50
0.30
0.10 US Mid-caps
Starting top down:
-0.10 US Large-caps US Large-caps
US Mid-caps
US Small-caps
-0.30
DM ex-US
0% EM Equity 20% 40% 60% 80%
Batting Average (%)
Active Passive
Source: Morningstar; Based on cheapest share class with region of sale = “U.S”. and base currency = “US Dollar”; Three-style boxes aggregated at the market-cap level, Time
period is from 2/20/20 – 5/7/20 (rationale being that S&P500 peaked on 2/19/20)
Past performance is no guarantee of future results. It is not possible to invest directly in an index. All market indices are unmanaged. Diversification does not ensure a profit or
guarantee against a loss. For illustrative purposes only.
13 For Investor UseActive’s outperformance in equities appears likely to continue
this time as the number of unprofitable companies was
already quite high before the virus emerged
Past performance is no guarantee of future results. It is not possible to invest directly in an index. All market indices are unmanaged.
Diversification does not ensure a profit or guarantee against a loss. For illustrative purposes only.
Source: Strategas, as of 04/24/2020
14 For Investor UseStrategies and funds to consider
Offensive Defensive
investments investments
Income investments
◼ Fidelity Advisor Growth
Opportunities Fund - FAGCX ◼ Fidelity Advisor Strategic Income
Fund - FSRIX
◼ Fidelity Advisor Low Volatility Factor
ETF - FDLO
◼ Fidelity Advisor New Insights -
FNIAX ◼ Fidelity Advisor High Income Fund -
FGTMX ◼ Fidelity Advisor Health Care Fund -
FHCIX
◼ Fidelity Advisor International Capital
Appreciation - FCPAX ◼ Fidelity Advisor Real Estate Income
Fund - FRIRX ◼ Fidelity Advisor Total Bond - FEPIX
◼
Fidelity Advisor Technology Fund -
FATIX ◼
Fidelity High Dividend ETF –
FDVV ◼ Fidelity Advisor Investment Grade
Bond - FGBPX
Fidelity Advisor Intermediate
◼ Municipal Income - FZIIX
◼ Equity ◼ Fixed income ◼ Blend
Unlike mutual funds, ETF shares are bought and sold at market price, which may be higher or lower than their NAV, and are not individually redeemed from
the fund.
Diversification does not ensure a profit or guarantee against a loss.
Please see slides 20 and 21 for important fund disclosures.
15 For Investor UseAppendix For Investor Use
Long term, we could still be in a secular bull market that
   started in 2013

        DJ 30 Industrials Average - Price                                                                                                                 Peak to Next
100,000                                                                                                                                                   Secular Bull
                                                                                                                                                          2001–2013?

 10,000                                                                                                     Peak to Next
                                                                                                            Secular Bull
                                                                                                            1969–1982

                                                    Peak to Next
  1,000                                             Secular Bull
                                                    1929–1942

    100

     10
          1900 1905 1910 1916 1921 1926 1932 1937 1942 1948 1953 1959 1964 1969 1975 1980 1985 1991 1996 2001 2007 2012 2018

    Source: Factset as of 03/16/2020; (Chart’s y-axis is on log-scale)
    Past performance is no guarantee of future results. It is not possible to invest directly in an index.. Index performance is not meant to represent
    that of any Fidelity mutual fund.
17 For Investor Use
Whose path resembles equity bull markets of the 50s & 80s – and both had a deep correction in Year 8 Source: Factset, as of 05/11/2020 Past performance is no guarantee of future results. It is not possible to invest directly in an index. All market indices are unmanaged. Index performance is not meant to represent that of any Fidelity mutual fund. 18 For Investor Use
Similar to the one we are going through right now

                                                                                                                                                          -34%

                                                                                                                                              We’re at least in the
    Figures based on S&P 500 Index.                                                                                                                right zip code.
   Past performance is no guarantee of future results. It is not possible to invest directly in an index. All market indices are unmanaged.
   Source: Strategas, as of 03/31/2020

19 For Investor Use
Important Information Stock markets, especially foreign markets, are volatile and can decline significantly in response to adverse issuer, political, regulatory, market, or economic developments. Foreign securities are subject to interest rate, currency exchange rate, economic, and political risks, all of which are magnified in emerging markets. In general the bond market is volatile, and fixed income securities carry interest rate risk. (As interest rates rise, bond prices usually fall, and vice versa. This effect is usually more pronounced for longer-term securities.) Fixed income securities also carry inflation, credit, and defaultrisks for both issuers and counterparties. (Unlike individual bonds, most bond funds do not have a maturity date, so holding them until maturity to avoid losses caused by price volatility is not possible.) Lower-quality bonds can be more volatile and have greater risk of default than higher-quality bonds. Sector funds can be more volatile because of their narrow concentration in a specific industry. The FA Total Bond, FA Strategic Income, Fidelity Advisor Investment Grade Bond and FA Intermediate Municipal Income funds can invest in securities that may have a leveraging effect (such as derivatives and forward- settling securities) that may increase market exposure, magnify investment risks, and cause losses to be realized more quickly. FA Intermediate Municipal Income: The municipal market is volatile and can be significantly affected by adverse tax, legislative, or political changes and the financial condition of the issuers of municipal securities. Income exempt from federal income tax may be subject to state or local tax. All or a portion of the Fund’s income may be subject to the federal alternative minimum tax. Income or fund distributions attributable to capital gains are usually subject to both state and federal income tax. Fidelity Low Volatility Factor ETF and Fidelity High Dividend ETF The securities of smaller, less well-known companies can be more volatile than those of larger companies. There is no guarantee that a factor-based investing strategy will enhance performance or reduce risk. Before investing, make sure you understand how the fund's factor investment strategy may differ from more traditional index funds. Depending on market conditions, fund performance may underperform compared to funds that seek to track a market-capitalization weighted index. The return of an index ETF is usually different from that of the index it tracks because of fees, expenses and tracking error. An ETF may trade at a premium or discount to its Net Asset Value (NAV). Given the nature of the relevant markets for certain of the fund’s securities, shares may trade at a larger premium or discount to the NAV than shares of other ETFs as well as become less liquid in stressed market conditions. FA Real Estate Income: Changes in real estate values or economic downturns can have a significant negative effect on issuers in the real estate industry. FA High Income: Commodity prices could impact some issuers in the high-yield segment. FA Growth Opportunities: Growth stocks can perform differently from other types of stocks and the market as a whole and can be more volatile than other types of stocks. FA Technology: The technology industries can be significantly affected by obsolescence of existing technology, short product cycles, falling prices and profits, competition from new market entrants, and general economic conditions. The fund may have additional volatility because it can invest a significant portion of assets in securities of a small number of individual issuers. FA Health Care: The health care industries are subject to government regulation and reimbursement rates, as well as government approval of products and services, which could have a significant effect on price and availability, and can be significantly affected by rapid obsolescence and patent expirations. 20 For Investor Use
Important Information
   Information provided in this document is for informational and educational purposes only. To the extent any investment information in this material is deemed to
   be a recommendation, it is not meant to be impartial investment advice or advice in a fiduciary capacity and is not intended to be used as a primary basis for
   you or your client’s investment decisions. Fidelity and its representatives may have a conflict of interest in the products or services mentioned in this material
   because they have a financial interest in them, and receive compensation, directly or indirectly, in connection with the management, distribution, and/or
   servicing of these products or services, including Fidelity funds, certain third-party funds and products, and certain investment services.
   Views expressed are as of the date indicated, based on the information available at that time, and may change based on market and other conditions. Unless
   otherwise noted, the opinions provided are those of the authors and not necessarily those of Fidelity Investments or its affiliates. Fidelity does not assume any
   duty to update any of the information.
   Investment decisions should be based on an individual’s own goals, time horizon, and tolerance for risk.
   These materials are provided for informational purposes only and should not be used or construed as a recommendation of any security, sector, or investment
   strategy.

   All indices are unmanaged and performance of the indices include reinvestment of dividends and interest income, unless otherwise noted, are not illustrative of
   any particular investment and an investment cannot be made in any index.
   S&P 500 Index is a market capitalization-weighted index of 500 widely held U.S. stocks and includes reinvestment of dividends. S&P 500 is a registered
   service mark of Standard & Poor's Financial Services LLC.
   Bloomberg Barclays US Aggregate Bond Index is a broad-based, market-value-weighted benchmark that measures the performance of the investment grade,
   US dollar-denominated, fixed-rate taxable bond market. Sectors in the index include Treasuries, government-related and corporate securities, MBS (agency
   fixed-rate and hybrid ARM pass-throughs), ABS, and CMBS.

   Dow Jones Industrial Average, published by Dow Jones & Company, is a price–weighted index that serves as a measure of the entire U.S. market. The index
   comprises 30 actively traded stocks, covering such diverse industries as financial services, retail, entertainment, and consumer goods.

    Methodology for Slide 12: Performance charts show the equal-weighted average rolling one-year returns, net of expense ratios, for all active funds in the set
    under analysis, calculated monthly. Similarly, equal-weighted average rolling one-year returns were calculated for all passive funds each month. Then, excess
    return was measured as annualized active return over annualized passive return. Data considers oldest share class of all funds and ETFs in the U.S. large-cap
    blend category with the U.S. as the exchange country, excluding enhanced index funds. Starting date of analysis for category is determined by the existence of
    continuous returns for both active and index funds. It was from September 1976 for U.S. large cap blend category. Returns from merged and closed funds and
    ETFs are included to reduce survivorship bias; funds and ETFs are removed from the set being averaged in the month they are closed or merged. If a fund closed
    or was merged during the rolling period, its returns were recorded for the months that it was in existence, and the weighting of the remaining funds in the subset
    was increased proportionally for the reminder of the period. No Fee filter or Rating filter was considered for both active and passive funds.

21 For Investor Use
For Investor Use
Past performance is no guarantee of future results.
Investing involves risk, including risk of loss.
Not FDIC Insured • May Lose Value • No Bank Guarantee
Not NCUA or NCUSIF insured. May lose value. No credit union guarantee.
Third-party trademarks and service marks are the property of their respective owners. All other trademarks and service marks are the
property of FMR LLC or an affiliated company.
Fidelity Institutional Asset Management® (FIAM®) provides registered investment products via Fidelity Distributors Company LLC, and
institutional asset management services through FIAM LLC or Fidelity Institutional Asset Management Trust Company. Fidelity Clearing
& Custody Solutions® provides clearing, custody, or other brokerage services through National Financial Services LLC or Fidelity
Brokerage Services LLC (Members NYSE, SIPC)
Before investing, consider the mutual fund or exchange traded products’, investment objectives, risks,
charges, and expenses. Contact Fidelity or visit institutional.fidelity.com for a prospectus or, if available, a
summary prospectus containing this information. Read it carefully.
Fidelity Distributors Company LLC, 500 Salem Street, Smithfield, RI 02917
680989.54.0
FIAM-BDYou can also read