Misleading Emerging Market Funds - Meta Point Advisors
←
→
Page content transcription
If your browser does not render page correctly, please read the page content below

Misleading Emerging Market Funds….
                 Do You Know What You Really Own in Your EM Funds?

                                      By Maya Marisa Joelson
                                         President, Meta Point Advisors
                            Registered Financial Advisor, Harvard MPA, Kellogg MBA

In 2017, emerging markets funds outperformed US markets -- the biggest emerging market ETF iShares
Core MSCI Emerging Markets ETF (IEMG) rose 37% while the largest US ETF SPDR S&P 500 ETF (SPY) rose
21%1. Why? Most news outlets and pundits reference the growth in emerging market nations like Brazil
and India…. But these countries are barely represented in the Emerging Market (EM) indices. Instead, the
EM index is dominated by Chinese and Asian tech stocks such as Tencent and Alibaba which have an
outsized influence on this supposedly global index. Moreover, well-developed nations like South Korea
and Taiwan have somehow become major components of the “emerging market” index. Even if, like me,
you believe in the growth prospects of Asian technology stocks, investors and clients need to be aware of
the real underlying holdings of emerging markets funds so that they can allocate their capital accordingly.

Emerging Market Indices: Asian Tech Stocks Have Higher Weighting than India and Brazil
If you have an emerging market fund, it is likely that MSCI’s EM Index drives its composition. As the
company reports on its website, “MSCI is a market leader in global equity indexes and has over $1.6
trillion in assets benchmarked to the MSCI Emerging Markets Index suite,” as of June 30, 2017.2 The S&P
Emerging Market index is the other primary benchmark for ETFs and mutual funds and it’s composition is
similar, although it does not include South Korea3 so allocates a bit more weight to real emerging markets.

Although the MSCI Emerging Markets Index claims it is, “designed to represent the performance of large-
and mid-cap securities in 24 Emerging Markets (with) more than 830 constiuents,”4 the index is
dominated by large-cap Chinese and developed market technology stocks.

The chart on the rights shows the top
10 MSCI constituents as cut and
pasted from their website. These top
10 stocks constitute more than a
quarter of all of Emerging Markets
holdings.

The largest stock Tencent with almost
6% of the index has almost double the
weighting of all Russia, which has only
a 3% weighting in the MSCI index.5
Tencent also has almost as much of a
weighting as all of Brazil which is
6.87% of the index.6 Tencent’s
representation can be considered
even more given this useful fact:        Source: MSCI. 5
Naspers, a South African telecom
company which is the only non-Asian stock in the top 10, has a 30% stake in Tencent.7 Tencent is a
Chinese technology company which owns Wechat, a popular social messaging application, as well as e-
finance, gaming, and other applications.

1 | Misleading Emerging Market Funds. | Copyright Marisa Joelson 2018. | All Rights Reserved.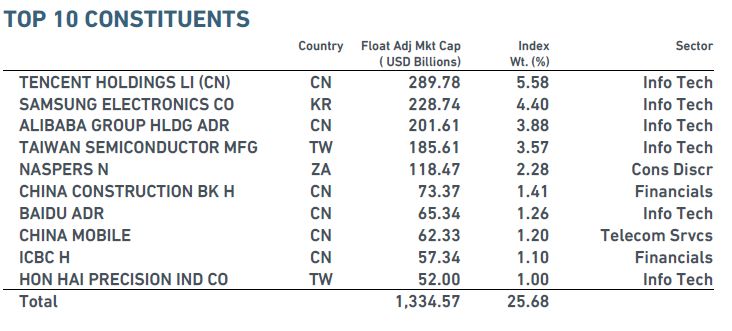
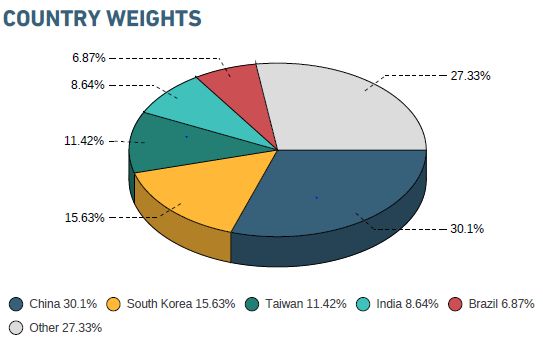
Tencent and Alibaba have a higher weighting in the MSCI index than India which is 8.64% of the MSCI
Emerging Market Index.8 India has 1.3 billion people and is on track to become the world’s fifth largest
economy9, but MSCI gives it a smaller weighting in its EM index than two of China’s tech companies.

In comparison, Apple has the highest market capitalization in the US at $870 billion but is just 3.8% of the
US SPDR® S&P 500 ETF (SPY)10 and presumably has a smaller weighting in global indices.

Tencent is not even close to being China’s biggest or most profitable company. Forbes considers this
honor to go to Chinese Industrial and Commercial Bank (ICBC) which it ranks as the world’s biggest public
company.11 ICBC is #9 in MSCI’s EM index but has less than a sixth of the EM weighting of Tencent which
Forbes ranks at #148. ICBC’s revenues are five times that of Tencent at $102 billion to $22B.12

MSCI’s Emerging Market Index Dominated by Advanced Economies: South Korea and Taiwan
MSCI has included South Korea and Taiwan
as major components in its emerging
market index even though the International
Monetary Fund considers these countries
to be “Advanced Economies.” The IMF
considers the following to be the major
emerging markets: Argentina, Brazil,
China, Colombia, Hungary, India, Indonesia,
Latvia, Malaysia, Mexico, Philippines,
Poland, Russia, South Africa, Thailand,
Turkey, and Ukraine.14

South Korea has a GDP per capita of
$29,115 while that of Taiwan is $24,000 –                                                    Source: MSCI. 13
these are akin to that of Italy and far above
the world’s GDP per capita of $10,000
which is on par with Russia, Turkey, and Brazil15 which you would think should have a higher
representation in an emerging market index than these advanced economies. Brazil has a higher gross
GDP than Korea and a population four times its size, but MSCI grants Brazil half of Korea’s weight in its
emerging market index.

Former Goldman Sachs economist Jim O’Neill popularized the term “BRIC” economies in 2001 to
summarize the biggest emerging markets with the most growth potential: Brazil, Russia, India, and China.
In 2013, O’Neill stated that, “the BRIC countries -- Brazil, Russia, India and China -- are already closely
watched. The group I’m studying for this project -- let’s call them the MINT economies -- deserve no less
attention. Mexico, Indonesia, Nigeria and Turkey all have very favorable demographics for at least the next
20 years, and their economic prospects are interesting.”16

Despite the growth prospects of these MINT economies with over $3 trillion in GDP and 640 million
people17, MSCI Emerging Markets decided to allocate more of their index to Tencent (5.6%) than to these
four emerging nations (5.2%)18. Meanwhile, MSCI decided to allocate 2 times these countries to Taiwan, a
country with 4% of MINT’s population and 15% of its GDP, and 3 times to South Korea, an advanced
economy with 8% of MINT’s population and 43% of its GDP.19 Some believe China should be promoted to
an “advanced economy” given its size but I can understand from a GDP/capita metric, it makes sense to
keep it as an emerging market. I don’t understand the sense of demoting South Korea and Taiwan from
advanced to emerging market status and allocating 27% of the MSCI EM index to these advanced
economies.

2 |Misleading Emerging Market Funds| Copyright Marisa Joelson 2018. | All Rights Reserved.
Chinese Tech Stock Opportunities and Risks
I believe in the growth potential of Chinese tech stocks and have bought some for my client’s portfolios
either as individual stocks or via a targeted ETF. Alibaba’s price increased by 97% in 2017 while Tencent
was up 113%, driving the EM index up higher – much more even than the MSCI China ETF which was only
up 52%.20 However, Tencent is not approved for sale in the State of Virginia – the stock is not registered
in Virginia and has not complied with Blue Sky Laws. Quite a few of the other stocks in MSCI’s top ten also
do comply with regulatory Blue Sky Laws. Clients should be aware of the risks they are taking when
investing in these Chinese internet stocks either individually or via EM funds.

Conversely, an investor may just choose to invest in Chinese internet funds or stocks if they want to get the
upside in Chinese stocks without being dragged down by underperformers like Russia, which had a 0%
return for the year. The KraneShares CSI China Internet ETF was up 68% for the year, double the 33%
increase in emerging market fund indices. In either case, investors and clients should understand how
much of their portfolio they are investing in Chinese internet stocks given their risk appetite.

                                                    2017                                                     2017
                                                    price %            Securities that Lagged the EM Index   price %
Symbol    Securities that Beat the EM Index Average change    Symbol   Average                               change
TCEHY     Tencent Holdings                            113%    EZA      iShares MSCI South Africa ETF            30%
BABA      Alibaba Group Holding                        97%    NGE      Global X MSCI Nigeria ETF                27%
NAPRF     Naspers                                      90%    IEFA     iShares Core MSCI EAFE ETF               24%
KWEB      KraneShares CSI China Internet ETF           68%    CICHF    China Construction Bank                  23%
MCHI      iShares MSCI China ETF                       52%    HNHAF    Hon Hai Precision Industry               23%
EWY       iShares MSCI South Korea Capped ETF          40%    XCH.TO   iShares China ETF                        23%
BIDU      Baidu                                        41%    EWT      iShares MSCI Taiwan Capped ETF           22%
TSM       Taiwan Semiconductor                         36%    EWZ      iShares MSCI Brazil Capped ETF           20%
IDCBF     Industrial And Commercial Bank               38%    SPY      SPDR S&P 500 ETF                         19%
INDA      iShares MSCI India ETF                       35%    VOO      Vanguard S&P 500 ETF                     19%
EEM       iShares MSCI Emerging Markets ETF            34%    EIDO     iShares MSCI Indonesia ETF               16%
IEMG      iShares Core MSCI Emerging Markets ETF       33%    EWW      iShares MSCI Mexico Capped ETF           11%
FXI       iShares China Large-Cap ETF                  33%    GXG      Global X MSCI Colombia ETF               10%
SSNGY     Samsung Electronics                           NA    UAE      iShares MSCI UAE Capped ETF               1%
Source:   Ycharts. Accessed December 31, 2017.                ERUS     iShares MSCI Russia Capped ETF            0%
Past performance is no guarantee of future results. The table is for informative purposes only and is not a
recommendation to invest in any security. Data access on December 31, 2017 at www.ycharts.com.

Given EM’s outperformance, many advisors are recommending increased allocations to EM. Meanwhile,
legendary scholars like Burton Malkiel argue that clients should reasonably put up to half of their
allocation to emerging markets. Malkiel is an advisor to robo-advisor Wealthfront which allocates up to
28% of clients’ portfolios to emerging markets.21 Yet, this could mean that approximately 14% of a
Wealthfront investor’s wealth could be put in Asian internet stocks without the client realizing this
exposure and up to 25% for an investor who blindly follows Malkiel’s advice.

Clients and investors should be aware of this concentration and wary that any adverse developments
involving North Korea or China could have a significant downside effect on their portfolios. The Chinese
government’s continued intervention in its economy, markets, or currency could also have an outsized

3 |Misleading Emerging Market Funds| Copyright Marisa Joelson 2018. | All Rights Reserved.
negative effect. Even the prosaic can
The US Dollar Lost Almost 10% Value in 2017,
dampen these stocks. Emerging market Boosting EM Returns
stocks have been boosted by up to 10% 110 AMEX Dollar Index Level 7
this year given the sharp depreciation in 105 6.9
6.8
the dollar.22 This could, of course, reverse 100 US Dollar to Chinese Yuan Exchange
Rate 6.7
especially if the new US tax law 95 6.6
precipitates massive repatriation of dollars 90 6.5
back to the US. 85 6.4
6.3
80
MSCI’s Questionable Methodology and the 6.2
Implication for Investors 75 6.1
In its methodology, MSCI explains that it is 70 6
1/2/13 1/2/14 1/2/15 1/2/16 1/2/17
now using float adjusted market
Source: Ycharts.
capitalization to construct the indices.23 13
Yet, one has to wonder if this is the best method to construct the index if it results in such distortions and,
by many measures, does not represent the emerging markets it claims to. I advised the top emerging
markets funds in London in the late 2000s and the EM index has been radically transformed while few
have noticed. Even emerging markets experts like Tim Seymour of CNBC’s Fast Money states that with
respect to emerging market returns, “we are not talking about single stocks. We are talking about entire
indices.”24 Yet this no longer seems to be true as the indices are now composed of single stocks like
Tencent and are not actually a composite of national stock market indices. Instead, the EM benchmark
indices are comprised of a basket of idiosyncratic securities with high percentages of free float. This
indicates that emerging market indices are much less diverse than most investors believe and prone to
much more volatility in the underlying holdings. MSCI has over $3 trillion benchmarked to its All World
index25 and it also makes one wonder what other ETFs and funds may be misleading to clients.
Besides the concerns for individual investors, there are systemic issues. Will companies begin gaming the
system to increase their float? If so, they too may rise to the top of MSCI’s index and de facto attract a
good portion of the $1.6 trillion benchmarked to MSCI EM indices. Was the 113% increase in Tencent in
2017 driven by its stock’s merits or by the self-fulfilling prophecy of having the highest weighting in the EM
benchmark? If Tencent’s weighting was 6% of the MSCI Index at the start of 2017 and has since doubled,
is it now more than 12% of many emerging market funds? If so, isn’t this too high a concentration for a
single stock for EM funds? If they decide they need to pare down, will that cause massive selling of the
high flying stocks such as Tencent and Alibaba – would that wreak havoc on the Chinese and global
markets? How much have active fund managers increased risk just to match these index returns? Why
has not anyone in the industry called out these discrepancies – a thirst for higher returns even if clients
and individual investors have no idea what risks they are taking?
If the point of EM index and mutual fund investing is to diversify away single stock risk and approximate
EM underlying growth, EM funds that are based on these benchmarks don’t seem to fit this goal. Financial
advisors, robo-advisor programs, and retirement plan administrators should be aware of these
discrepancies and inform and advise their clients accordingly. Caveat emptor.
4 |Misleading Emerging Market Funds| Copyright Marisa Joelson 2018. | All Rights Reserved.ENDNOTES
1. http://etfdb.com/compare/market-cap/. Accessed January 1, 2018.
2. https://www.msci.com/emerging-markets. Accessed January 1, 2018.
3. S&P Emerging BMI Factsheet. http://us.spindices.com/indices/equity/sp-emerging-bmi-us-dollar. Accessed
January 1, 2018.
4. “Emerging Markets: Looking to Expand Your Investment Horizon.” The Modern Index Strategy.
https://www.msci.com/documents/1296102/1362201/MSCI+Emerging+Markets+Brochure.pdf/a40037fd-
bed7-471e-b5da-111eecd0ea7e. Accessed January 1, 2018.
5. https://www.msci.com/emerging-markets. Accessed January 1, 2018.
6. https://www.msci.com/emerging-markets. Accessed January 1, 2018.
7. https://www.bloomberg.com/gadfly/articles/2017-08-16/that-naspers-tencent-gap-is-hard-to-close
8. “Emerging Markets: Looking to Expand Your Investment Horizon.” The Modern Index Strategy.
https://www.msci.com/documents/1296102/1362201/MSCI+Emerging+Markets+Brochure.pdf/a40037fd-
bed7-471e-b5da-111eecd0ea7e. Accessed January 1, 2018.
9. Babones, Salvatore. “India is Poised to Become the World’s Fifth Largest Economy, But It Can’t Stop There”.
Forbes. https://www.forbes.com/sites/salvatorebabones/2017/12/27/india-is-poised-to-become-the-worlds-
fifth-largest-economy-but-it-cant-stop-there/#75bfe45f3ff1. Accessed January 1, 2018.
10. Ycharts. SPDR® S&P 500 ETF (SPY) Holdings. Accessed December 31, 2017.
11. “The World’s Biggest Public Companies: 2017 Ranking”. Forbes.
https://www.forbes.com/global2000/list/#tab:overall. Accessed January 1, 2018.
12. “The World’s Biggest Public Companies: 2017 Ranking”. Forbes.
https://www.forbes.com/global2000/list/#tab:overall. Accessed January 1, 2018.
13. https://www.msci.com/emerging-markets. Accessed January 1, 2018.
14. World Economic Outlook: October 2017. International Monetary Fund. P.2. p. 243.
15. World Economic Outlook: April 2017. International Monetary Fund.
http://statisticstimes.com/economy/countries-by-projected-gdp-capita.php. Accessed January 1, 2018.
16. Boesler, Matthew. Business Insider. “The Economist Who Invented BRICs Just Invented a Whole
New Group of Countries: The MINTs. November 13, 2013. http://www.businessinsider.com/jim-
oneill-presents-the-mint-economies-2013-11). Accessed January 5, 2018.
17. World Economic Outlook: October 2017. International Monetary Fund. World Economic Database.
http://www.imf.org/external/pubs/ft/weo/2017/02/weodata/index.aspx. Downloaded January 2, 2018.
18. https://www.ishares.com/us/products/239637/ishares-msci-emerging-markets-etf/. Accessed Jan 2, 2018.
19. World Economic Outlook: October 2017. International Monetary Fund. World Economic Database.
http://www.imf.org/external/pubs/ft/weo/2017/02/weodata/index.aspx. Downloaded January 2, 2018.
20. Ycharts. Accessed December 31, 2017.
21. Malkiel, Burton G. “How Much We Should Invest in Emerging Markets.” 4/4/15.
https://blog.wealthfront.com/emerging-markets/. Accessed December 31, 2017.
22. Ycharts. Accessed December 31, 2017.
23. MSCI GLOBAL INVESTABLE MARKET INDEXES METHODOLOGY. November 2017.
https://www.msci.com/eqb/methodology/meth_docs/MSCI_November2017_GIMIMethodology.pdf.
24. Seymour, Tim. Fast Money. CNBC. Aired at 5 pm on December 29, 2017.
25. https://www.msci.com/acwi. Accessed January 1, 2018.
5 |Misleading Emerging Market Funds| Copyright Marisa Joelson 2018. | All Rights Reserved.Marisa (Maya) Joelson maya@metapointadvisors
Founder of Meta Point Advisors 415-691-1062
Maya is a Harvard-trained economist who leverages her two decades of top-level
experience across Wall Street, the City of London, emerging markets, and advanced
technology to devise investment strategies for her clients. She founded Meta Point Advisors
after several years as a Financial Advisor at Merrill Lynch. Maya's clients benefit from her
ability to provide savvy active management without the cumbersome costs and structure of
mutual funds.
Maya’s ability to abstract important concepts or “Meta Points” has differentiated her, whether writing about Russia's
conversion to capitalism while at Harvard, women in business at the World Economic Forum, equity markets in
London's hedge fund community, or artificial intelligence technologies for DARPA program managers. She seeks to
leverage these insights to achieve superior outcomes for her clients.
Maya Marisa Joelson holds a MPA from Harvard Kennedy School, a MBA from Kellogg at Northwestern
University, and a BA from Wesleyan University.
Marisa Joelson is a registered representative of Lincoln Financial Advisors Corp., a broker/dealer (member
SIPC) and registered investment advisor. Meta Point Advisors is not an affiliate of Lincoln Financial Advisors.
Past performance is no guarantee of future results. All investments involve risk, including possible loss of principal.
Foreign securities are subject to certain risks of overseas investing including currency fluctuations and changes in political
and economic conditions, which could result in significant market fluctuations. These risks are magnified in emerging or
developing markets.
This information is prepared for general circulation and does not have regard to any specific investment objectives. The
information is an assessment of the market environment at a particular point in time and is not intended to be a forecast of
future events, or a guarantee of future results. Neither the information presented nor any opinion expressed constitutes a
solicitation for the purchase or sale of any security. Statements regarding future prospects may not be realized and may differ
materially from actual events or results. CRN-1959088-112917
6 |Misleading Emerging Market Funds| Copyright Marisa Joelson 2018. | All Rights Reserved.You can also read